Stat 201: Module 1-2
1/47
There's no tags or description
Looks like no tags are added yet.
Name | Mastery | Learn | Test | Matching | Spaced | Call with Kai |
|---|
No analytics yet
Send a link to your students to track their progress
48 Terms
Inferential Questions
Questions regarding how summaries, patterns, trends or relationships in a data set extend to the wider population
Observation
A quantity or a quality (or a set of these) we collect from a given entity/object
Population
Complete collection of individuals or cases of interest
the population is fixed
you don’t have access to all elements of the population
we mathematically denote the population’s size using upper-case N
Population Parameter
A quantity that summarizes the population
parameters are constant (not random)
parameters are usually unknown
Whenever we’re interested in a proportion of some value in a population, the population parameter has a specific name: the population proportion
Census
An exhaustive enumeration or counting of all N individuals in the population
we do this in order to compute the population parameter’s value exactly
Sample
A collection of observations from a population
Sample estimate
Numerical characteristic of the sample that estimates the population parameter
Statistical Inference
The process of using a sample to make a conclusion about the broader population from which it is taken
Point Estimate (aka Sample Statistic)
Single number calculated from a random sample that estimates an unknown population parameter of interest
the value is only an estimate (our best guess of our population parameter using this sample)
since the sample was random, if we took another random sample and compute the value for that sample, we’d get a different answer
estimates vary from sample to sample due to sampling variability
if we get a different value for an estimate w/ a different sample, the point estimate might be unreliable
specific name when considering proportion: the sample proportion
Variable
An attribute of the elements in the population
what we’re measuring for each individual
Random Sample
A randomly selected subset of the population
ensures our point estimates are accurate
ensures that a sample is unbiased and representative of the population
every individual has an equal chance of being sampled
changes every time you draw a sample
you do have access to all elements of the sample
Sampling
The act of collecting a sample from the population, which we generally do when we can’t perform a census
we mathematically denote the sample size using lower case n
typically n is much smaller than the population size
sampling is a cheaper alternative than performaing a census
Representative Sample
A sample is said to be representative if it roughly “looks like” the population
Generalizable Sample
We say a sample is generalizable if any results based on the sample can generalize to the population
Biased/Unbiased Sampling Procedure
a sampling procedure is biased if certain individuals in a population have a higher chance of being included in a sample than others
a sampling procedure is unbiased if every individual in a population has an equal chance of being sampled
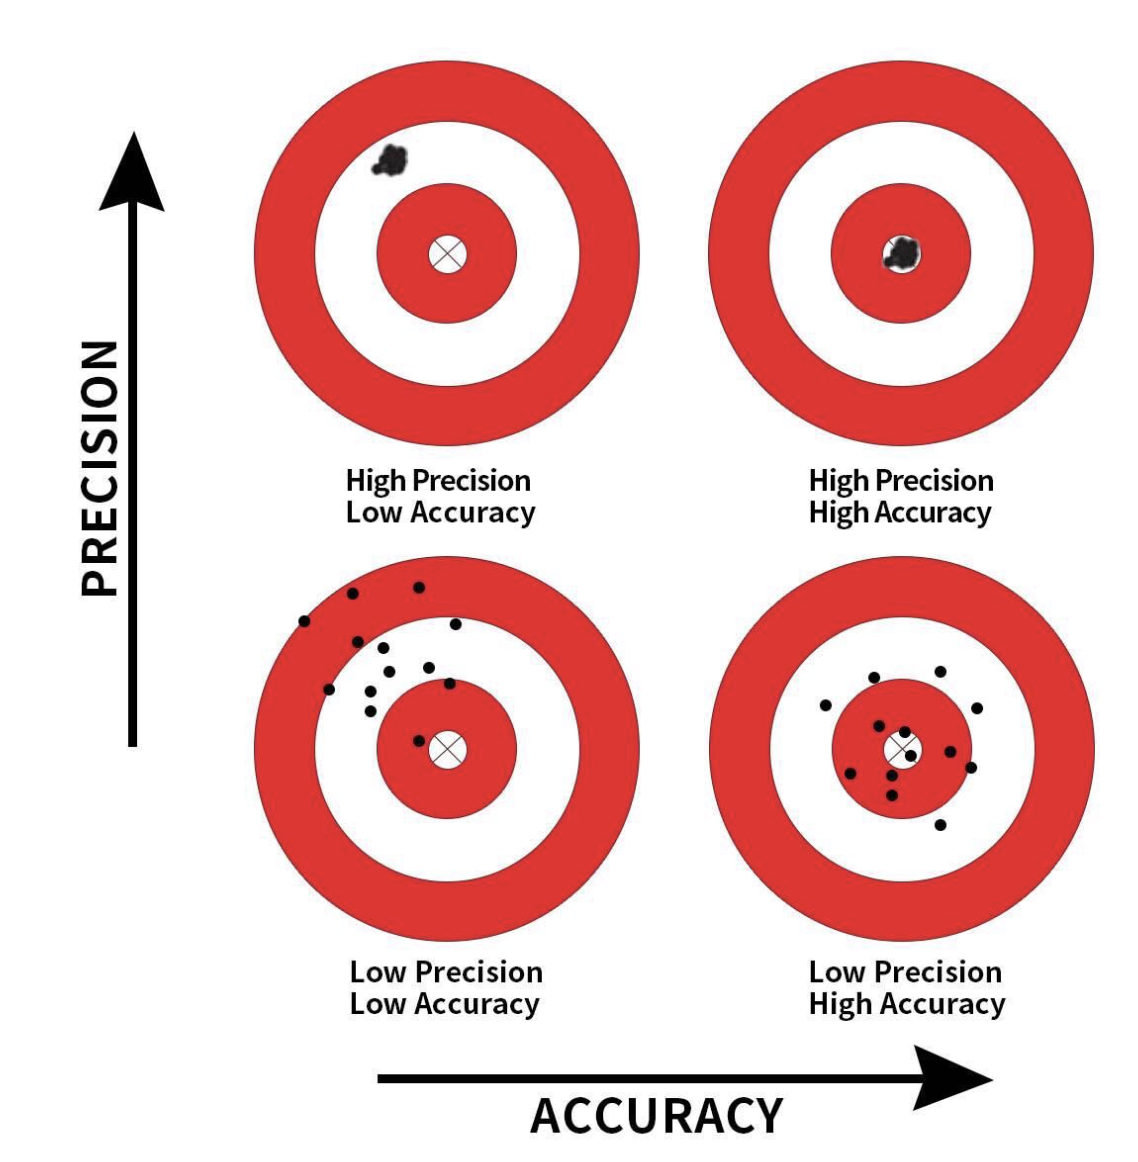
Accuracy vs Precision
random sampling ensures out point estimates are accurate
having large sample sizes ensures our point estimates are precise
Statistic
A quantity calculated based on a sample
eg. sample mean, sample standard deviation
statistics are used to estimate parameters
statistics are random quantities and depend on the sample drawn
What happens to the statistics when a new sample is taken?
Statistics will change, since the sample is random. It is likely that the sample will be different every time
Proportion
The number of entities/objects with a specific characteristic divided by the total number of entities/objects
can be used to describe categorical data
Variance
The mean of the sum of the squared distances of each observation from the mean value of all observations
Quantile
A number such that a given percentage of the data is lower than that number
Correlation
The strength and direction of the relationship between two variables
Sampling Distribution
A probability distribution of a statistic calculated from all possible samples of a specific size drawn from a population
helps us see how spread out the samples are from each other
each time we take a random sample we will have the same sampling distribution
an ideal sampling distribution would be one bar concentrated on the population parameter
tells us a lot about our statistic
we could calculate the probability that our statistic would be to a certain range around the parameter
Sample size on Sampling Distribution
the bigger the sample size, the more narrow the sampling distribution
there are fewer differences due to sampling variation and the distribution centers more tightly around the same value
the smaller the sample size, the wider the sampling distribution
What does it mean to have a narrower sampling distribution?
less variability between samples
the values in the ‘table containing all possible samples' will be closer to the population parameter
it matters less which sample is randomly chosen
Questions to consider when looking at a sampling distribution
what is the centre of the sampling distribution?
how spread is the sampling distribution?
what is the shape of the sampling distribution?
What does the sampling distribution show us?
what point estimates are possible (even more: their probabilities of occurring)
where the true parameter is (eg. for means it lies at the mean of the sampling distribution)
If we knew the population, could we find the sampling distribution?
Yes, the sampling distribution is usually unknown, but technically if we knew population, you could potentially obtain the exact sampling distribution
calculate the statistic across all possible samples
this is only manageable for very tiny problems as there are many possible samples for even small samples
What is the center of a sampling distribution of the sample mean?
The population mean
What affects the variability of the sampling distribution?
population: affects the samples taken
sample size
statistic
Symbols to remember
Population average = μ
Sample average = x̄
Proportion = p
sample proportion = p̂
Population Distribution
the population distribution is obtained by measuring all the elements in the population
the population distribution is unknown
Sample Distribution
the sample distribution is obtained by measuring all the elements in the sample
the sample distribution is known
we hope that the sample distribution resembles the population distribution
Is the mean susceptible to outliers?
Yes, but the median is more robust
Median
The middle observation of a sorted variable’s data
Independence
Independent sample: the selection of one element does not influence the selection of another
Sampling with Replacement
This allows repeated elements in our sample
works better when the population is larger, as there is a lower chance of getting the same values in a sample, and actually collecting new information
Steps:
select one element from the population
put the element back in the population
do steps 1 and 2 n times
Sampling w/o Replacement
This does not allow repeated elements in our sample
always getting new information
more informative than sampling w/ replacement
impacts independence and the chances of getting chosen
when the population is large, the chances of getting chosen aren’t changing as much, but are still not independent
Steps:
select one element from the population
remove the element from the population
do steps 1 and 2 n times
Rule of Thumb: Sample Size
The sample size at most 10% of the population size
Pros of Sampling w/ Replacement
independent sample: selection of an element doesn’t influence the selection of other elements
variability even when the sample is the same size as the population
Used for bootstrap samples
Cons of Sampling w/ Replacement
less informative (repeated information)
less efficient
Pros of Sampling w/o Replacement
more informative (less repeated information)
more precise parameter estimate
Used for sampling the population
Cons of Sampling w/o Replacement
Dependence: elements picked affect the chance of the elements you will pick later
less problematic when sample is small compared to population
need to check 10% rule
no variability if the sample is the same size as the population
Standard Error (SE)
The standard deviation of a statistic/sampling distribution
quantifies the amount of variation of the sample statistic around its mean
general rule, as sample size increases, the standard error decreases
Standard Deviation (σ or s)
The square root of the variance
measures the amount of variation of the values of a variable about its mean
Surreal Approach to Approximating the Sample Distribution
taking many samples from the population
the approximation depends on the samples we draw
the more samples that are taken, the more representative they are of the population
Estimating the sampling distribution w/ bootstrapping
in reality, we only take 1 sample from the population of interest
the bigger the sample, the better
we use the sample distribution as an estimate of the population distribution and take samples w/ replacement from the original sample (bootstrap samples)
bootstrap samples need to be the same size as the original sample size (smaller = wider bootstrap distribution, larger = narrow bootstrap distribution)
we then calculate the average in every bootstrap sample and plot the bootstrap distribution to approximate the sampling distribution
bootstrap samples can’t be used to improve the original sample, we only use it to estimate the sampling distribution
The Bootstrap Distribution
an approximation of the sampling distribution (has similar spread and shape)
is centered around the sample statistic (not the parameter)
used to estimate the standard error of a statistic