Lec #4: Population Growth Part 1
 Call Kai
 Learn
Learn Practice Test
 Spaced Repetition
 Match
Match Flashcards
 Knowt Play
1/14

There's no tags or description
Looks like no tags are added yet.
Name | Mastery | Learn | Test | Matching | Spaced | Call with Kai | Chat |
|---|
No analytics yet
Send a link to your students to track their progress
15 Terms
Population
Def: Individuals of the same species living in the same geographical area
The populations of species vary over space and time
Conditions that determine population density/dynamics
Immigration, natality, mortality, emigration (and resources)
Population attributes (demographic events) concerned with changes in population size are interrelated
Density and measured by two ways
Density = the number of individuals per unit area or volume
Measured by:
1. Total Counts: count all individuals within a population (usually labor/time intensive, inefficient, and impractical or impossible) (better for constrained species)
2. Sub-sampling methods: sub sample population to estimate densities and total population size N (quadrats, line transects, mark and recapture techniques, etc.) (easy, less time/labor)
3. Indirect indicators - number of nests, fecal droppings, eggs, tracks, etc., as estimates of density (better for mobile animals, not very accurate)
Sub-sampling methods: quadrats
Count the number of organisms in a grid and extrapolate
Extrapolating has bias, so you should have multiple grids for more accuracy
Inaccurate because of variation; over and under estimation
Sub-sampling methods: mark and recapture techniques
Technique used because species move
Assume: organisms distribute randomly back in the environ (even though capturing these organisms will alter their behavior)
They collect, mark release, and then take another sample to estimate how many total organisms
Not accurate, maybe close, better than nothing

Patterns of Dispersion and the three kinds
The spacing of individuals within the geographic range of a population
1. Clumped: Individuals distributed in discrete groups
- most common in nature
- due to unequal distribution of resources and/or social behavior
- Ex: schools for protection; hide amongst themselves
2. Uniform: Distributed based on minimum distance between individuals
- due to interactions between individuals
- Ex: penguins are 1m apart because they are territorial for their young; it is constrained, but if you zoom out, it will look like clumps
3. Random: Distributed without regard to position of other individuals
- rare in nature, chance dispersal or resources not limiting
- Ex: flowers from the wind or current; resources aren’t limited
Patterns of dispersion change with spatial scale (measure at scale of interaction)
Natality (birth rate)
Def: the # of offspring produced per unit time
It is dependent on type of organism
The reproductive population excludes too young or old organisms

Mortality (death rate)
Def: the # of offspring dying per unit time
Natural senescence is rare: most organisms die from predation, parasitism,
disease, hazards, etc.
The population at risk could be the outside of a school of fish even though they have resources

Immigration and Emigration Rate
- The importance of movement as loss and gain processes to populations is dependent on spatial and temporal scales
- The smaller the spatial / temporal scale, typically the greater the importance of movement to pop. dynamics (local vs. global impact)
- The bigger the spatial / temporal scale, typically the greater the importance of birth/death rate to pop. dynamics
- Also critical to population persistence
Methods of identifying population changes
Direct observations (not always practical due to long lived organisms)
Sequoia trees are 1000 years old; groups of people are needed to extend the observation range —> age structure
View age structures (life tables and survivorship curves)
Type 1 (human): odds of survival are high but decrease at 70 since we are born with behaviors and add to it (lower than 70 now due to stress and diet)
Type 2 (birds): linear decrease because survival is the same throughout life; they are born with all the needed info in DNA (lack of learning)
Type 3 (plants, fishes): odds of survival are low when born, but they live a long time, like the bluefin tuna
Mathematical models (view populations at fundamental levels)
- Results from models are often general and can be applied to
other systems
- Good for measuring populations that are difficult to observe
directly (long life, too big, etc)
The number of population in the future is important because it tells what planet we live in
Biological dynamics
Patterns of change & growth of biological systems
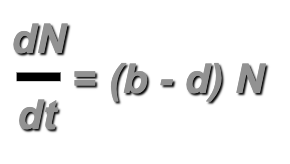
Can be described by differential equations; it can predict the population size at any point in time if we know the initial population size and the rate of population growth
Algebra measures lines (slope, space, area)
Calculus measures curves (like in bio)

Simple Population Growth Model
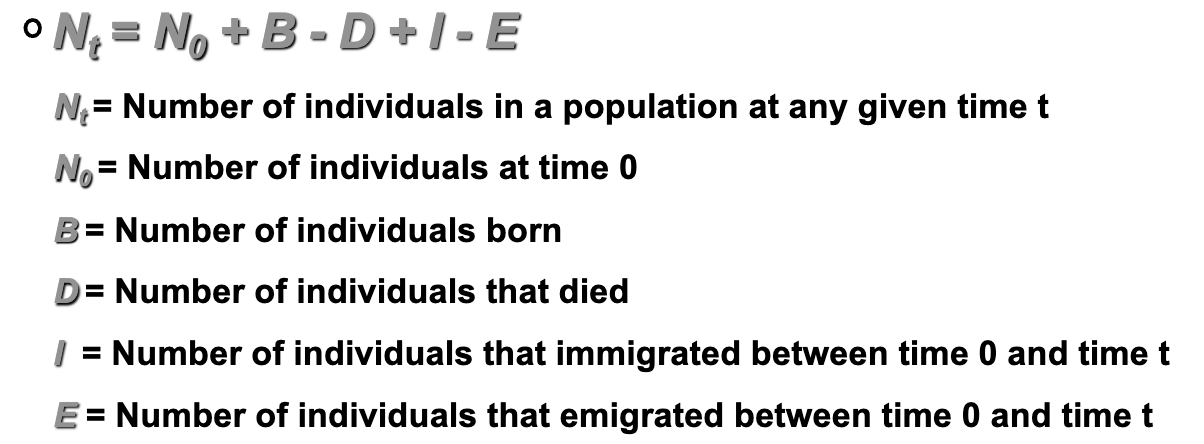
If we measure these rates over many time intervals, we can
determine how a population’s density changes over time
1. If B + I > E + D then population increases
2. If B + I < E + D then population decreases
Exponential Growth Model
All populations have the potential for exponential growth
Assumption: there is an unlimited resource environment:
- There are no restrictions on an organism’s ability to harvest energy,
grow and reproduce
- usually short amount of time
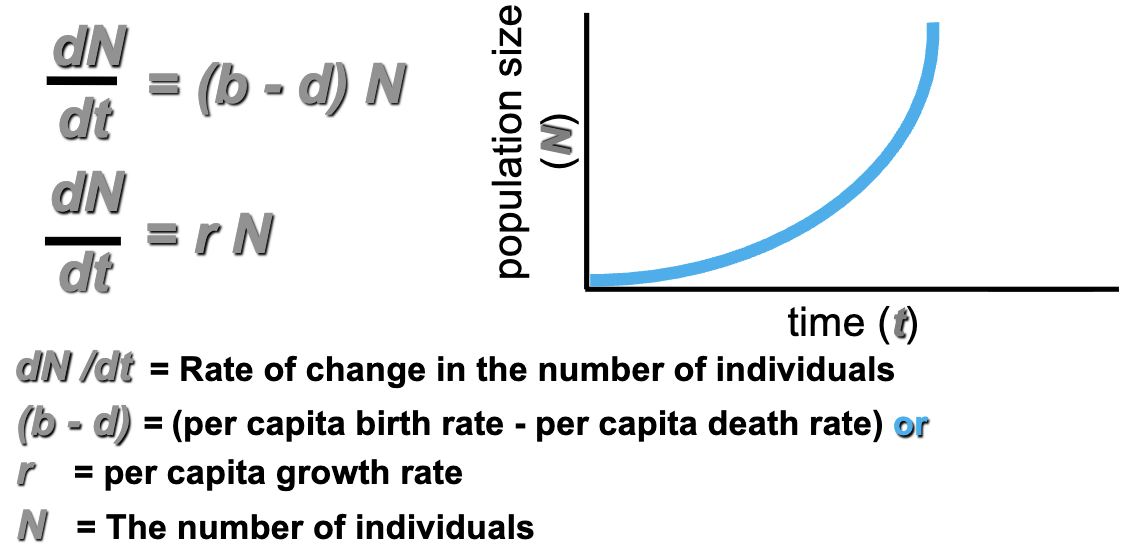
1. If the number of new individuals added per individual per unit time to a population is constant
2. And if the environment is constant and resources are unlimited:
positive rates of increase lead to exponential growth
If: r < 0 (death is bigger than birth; population decreases), r = 0 (b=d; population size is constant, r > 0 (b>d; population size increases)
A population with a higher per capita growth rate (r) will grow faster than one with a lower per capita growth rate
For short time periods some populations may grow at rates close to the intrinsic growth rate (rmax)
Exponential Growth Model Unique Example: COVID-19
Mutations and variants make the virus better at spreading
Because of the unlimited resources (us; none are immune), it is an exponential growth curve
Exponential (geometric) Growth Model Example: European Rabbits (Australia)
- Rabbits were introduced to South Australia by England
- Each female can produce 4 liters of up to five young per year (20/yr)
- Ate native grasses and vegetation used by other grazing animals (devastate the country)
- Population increased exponentially and spread
- Built worlds largest fence to contain their spread (failed) (jumped; dug; barrier collapsed)
Made another fence halfway, but the rabbits just dug deeper and jumped higher
An electrical fence, just made the dead rabbits stuck to the fence and make a step ladder
Predator poor and unlimited resources (exponential curve)
- Viral disease Myxomatosis, killed 500 million rabbits
- Rabbit Hemorrhagic Disease Virus (RHDV) escaped a quarantine facility in 1995,
released in 1996, and again in 2017
Some rabbits resisted these diseases; these diseases are released every year to manipulate conditions