Econ 2006 Exam 1
1/81
There's no tags or description
Looks like no tags are added yet.
Name | Mastery | Learn | Test | Matching | Spaced |
|---|
No study sessions yet.
82 Terms
Origins of Macroeconomics
Hoover’s failure to understand what caused the Great Depression (or how it could be tamed) was common at the time.
Microeconomics was well-developed; macroeconomics was not.
The effort to understand economic slumps and find ways to prevent them is at the core of macroeconomics.
During the Great Depression, “Hoovervilles” sprang up across America, named after the economically clueless President Herbert Hoover.
Microeconomic questions
Should I go to business school or take a job right now?
What determines the salary Google offers to Cherie Camajo, a new MBA?
What determines the cost to a university or college of offering a new course?
What gov’t policies should be adopted to make it easier for low-income students to attend college?
What determines whether Citibank opens a new office in Shanghai?
Why was there a shortage of toilet paper during the coronavirus pandemic?
Macroeconomic questions
How many people were employed in the economy as a whole this year?
What determines the overall salary levels paid to workers in a given year?
What determines the overall level of prices in the economy as a whole?
What gov’t policies should be adopted to promote employment and growth in the economy as a whole?
What determines the overall trade in goods, services, and financial assets between the US and the rest of the world?
How did a fall in consumer spending during the pandemic affect overall employment?
The whole is greater than the sum of its parts
Macroeconomic questions can’t be answered simply by adding up microeconomic answers
The combined effect of individual decisions can have results that are different from what any one individual intended. The behavior of the macroeconomy is greater than the sum of individual actions and market outcomes.
Paradox of thrift
When people are worried about economic hard times, they prepare by cutting their spending. This reduction in spending depresses the economy and businesses react by laying off workers.
As a result, people end up worse off than if they hadn’t cut their spending. Seemingly virtuous behavior—saving more—harms everyone.
Self regulating economy (pre-1930s wisdom)
Problems such as unemployment are resolved without government intervention through the working of the invisible hand.
Keynesian economics (post 1930s conventional wisdom)
Economic slumps are caused by inadequate spending, and they can be mitigated by government intervention.
The business cycle since the 1930s
The US (and most national gov’ts) uses tools to improve the economy
Monetary policy
Uses changes in the quantity of money to alter interest rates and affect overall spending.
Fiscal policy
Uses changes in government spending and taxes to affect overall spending.
Growth interrupted (1985-2020)
Major economic indicators show a strong upward trend.
But they didn’t rise steadily. There were downturns in the early 1990s, the early 2000s, 2007, and 2020.
Recessions (contractions)
Periods of economic downturn, when output and employment are falling.
Expansions (recoveries)
Periods of economic upturn, when output and employment are rising.
Business cycle
The short-run alternation between recessions and expansions.
Business cycle-peak
The point at which the economy turns from expansion to recession
Business cycle-trough
The point at which the economy turns from recession to expansion
The pain of recession
The most important effect of a recession is its effect on the ability of workers to find and hold jobs.
Recessions cause many people to lose their jobs and make it hard to find new ones.
Recessions reduce the standard of living, increase poverty, cut corporate profits, and result in bankruptcies of many small businesses.
Can anything be done to reduce the frequency and severity of recessions?
Modern policy makers
According to John Maynard Keynes and Milton Friedman, policy makers should try to “smooth out” the business cycle. They try to smooth out the business cycle. They haven’t been completely successful but helped make the economy more stable.
Long run economic growth
The sustained upward trend in the economy’s output over time.
Reflects one of our basic principles of economics: Increases in the economy’s potential lead to economic growth over time.
Modern invention (Britain wasn’t any richer in 1650 than it was 2 centuries earlier)
Countries don’t necessarily grow at the same rate. Britain was once substantially richer than the United States, but it was overtaken by the United States after 1875.
Canada & Argentina
Canada and Argentina began the 20th century looking like twins…
Political instability and high inflation slowed Argentina down.
Now Canada’s standard of living is on par with the U.S., 2.5x as high as Argentina
Inflation
A rising overall level of prices
Inflation discourages people from holding onto cash (because cash loses value if prices are rising). In extreme cases, people stop using cash altogether.
Deflation
A falling overall level of prices
Deflation can cause the reverse problem. Since cash gains value if the price level is falling, holding on to it is more attractive than investing in new factories and other productive assets. This can deepen a recession.
Price stability
The economy has price stability when the overall level of prices changes slowly or not at all.
Economists view price stability as a desirable goal (from 1990s-2020 it has been achieved)
In the short run…
Movements in inflation are closely related to the business cycle.
When the economy is depressed and jobs are hard to find, inflation tends to fall;
When the economy is booming, inflation tends to rise.
In the long run…
The overall level of prices is mainly determined by changes in the money supply.
Open economy (US)
It trades goods and services with other countries.
Trade deficit
The value of goods and services bought from foreigners is more than the value of goods and services sold to them.
Since the 1990s, the United States ran a big trade deficit when it imported than it exported.
Trade surplus
The value of goods and services bought from foreigners is less than the value of the goods and services sold to them.
What causes trade imbalances?
Decisions about savings and investment spending.
Countries with high investment spending relative to savings run…
Trade deficits
Countries with low investment spending relative to savings run…
Trade surpluses
How do you measure an economy
Comparing the value of their production
GDP (gross domestic product) is the most important and common way to estimate an economy’s size
The national income and product accounts (NIPA)
measure our nation’s economic performance
compare American income and output to that of other nations
track the economy’s condition throughout the business cycle - keep track of spending of consumers, sales of producers, business investment spending, government purchases, and other flows of money between different sectors of the economy.
Circular-flow diagram
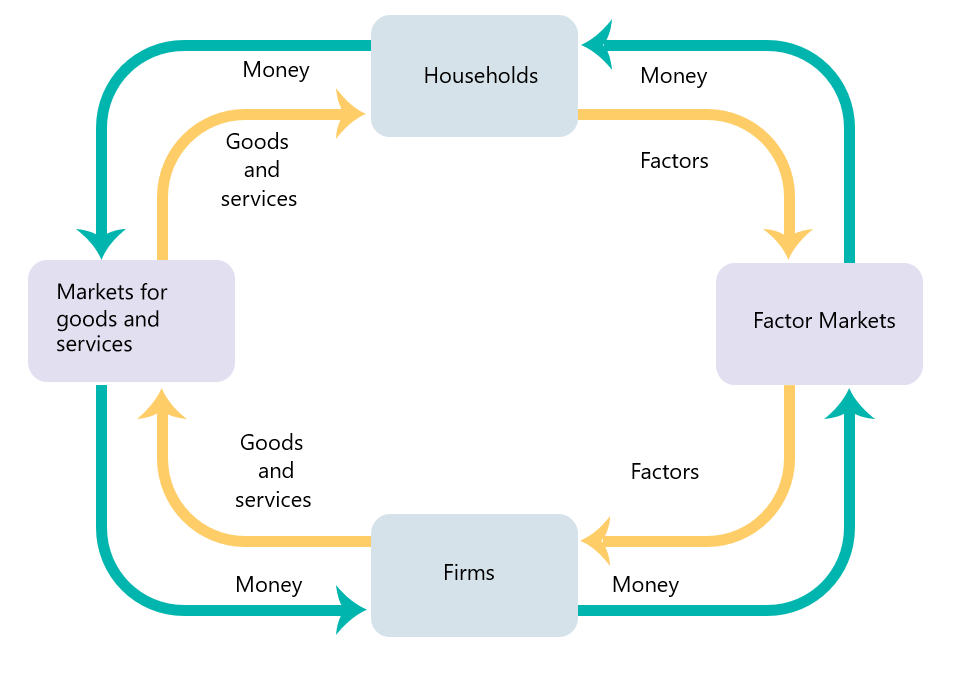
Consumer spending
household spending on goods and services
Stock
a share in the ownership of a company held by a shareholder.
Bond
borrowing in the form of an IOU that pays interest.
Government transfer
payment by the government to individuals for which no good or service is provided in return.
Disposable income
income plus government transfers minus taxes; available to spend on consumption and to save.
Private savings
disposable income minus consumer spending.
Financial markets
the banking, stock, and bond markets, which channel private savings and foreign lending into investment spending, government borrowing, and foreign borrowing.
Government borrowing
the total amount of funds borrowed by federal, state, and local governments in the financial markets.
Government purchases of goods and services
total expenditures on goods and services by federal, state, and local governments.
Exports
goods and services sold to other countries.
Inputs
goods and services purchased from other countries
Inventories
stocks of goods and raw materials held to facilitate business operations.
Investment spending
spending on productive physical capital, such as machinery and construction of structures, and on changes to inventories.
Gross domestic product (GDP)
The market value of all final goods and services produced within a country in a year.
Calculating GDP
Add up the total value of all final goods and services produced
Add up all spending on domestically produced final goods and services.
Add up the total factor income earned by households from firms in the economy
Spending = income
It doesn’t matter HOW we measure the production, since one person’s spending is another’s income.
Calculating GDP
as the value of final goods and services
as aggregate spending on domestically produced final goods and services
as factor income earned by households from firms in the economy
What is not included in GDP?
GDP measure PRODUCTION
Sale of used goods: NOT included.
The sale of financial assets, such as stocks and bonds, are not included.
GDP within a country
Only production that takes place within the borders of a country is included in GDP.
GDP produced within a year
GDP is like annual income:
it measures a rate of production during a given period.
What is included in GDP?
Investment spending
Capital spending (it’s part of investment spending)
Domestically produced final goods and services, including capital goods, new construction of structures, and changes to inventories
What is not included in GDP?
Intermediate goods and services
Inputs
Used goods
Financial assets, such as stocks and bonds
Goods and services produced outside this country
Value added
Value added of a producer is the value of its sales minus the value of its purchases of intermediate goods and services.
Add up the value of all the final goods and services produced in the economy.
We count only each producer’s value added in the calculation of GDP: the difference between the value of its sales and the value of the intermediate goods and services it purchases from other businesses.
If intermediate goods and services were included in the GDP, it would cause us to count the same items several times. To avoid double counting, we count only each producer’s value added in the calculation of GDP.
Final goods and services
goods and services sold to the final, or end, user.
Intermediate goods and services
goods and services (bought from one firm by another firm) that are inputs for production of final goods and services.
Spending
Add up all spending on domestically produced final goods and services.
This results in the equation GDP = C + I + G + X – IM where
C = consumer spending,
I = investment spending,
G = government purchases of goods and services,
X = sales to foreigners, and
IM = imports (purchases here of foreign goods… or income that has leaked across national borders).
Measuring GDP as factor income earned from firms in the economy
Add up all the income:
The wages earned by labor
The interest paid on savings
The rent earned by those who lease their assets
Dividends paid to the shareholders
Net exports
the difference between the value of exports and the value of imports
What GDP tells us
GDP measures the size of the economy.
One must be careful when comparing economies over time. That’s because increases in GDP over time might represent increases in prices rather than increases in output.
We need to adjust GDP for price changes—we need real GDP.
Who created the national accounts and why
The national accounts owe their creation to the Great Depression. The only data available were scattered statistics (railroad data, etc.)
Simon Kuznets (a young Russian-born economist) developed a set of national income accounts. The first version was presented to Congress in 1937.
The push to complete the national accounts came during World War II, when policy makers were in even more need of comprehensive measures of the economy’s performance.
The federal government began issuing estimates of gross domestic product and gross national product in 1942.
Real GDP: a measure of aggregate output
We need to be able track the quantity of total output over time.
Aggregate output
the total quantity of final goods and services the economy produces.
We measure aggregate output by real GDP
Real GDP
the total value of the final goods and services produced in the economy during a given year, calculated using the prices of a selected base year.
Nominal GDP
the value of all final goods and services produced in the economy during a given year, calculated using the prices current in the year in which the output is produced.
Real vs. Nominal GDP
Except in the base year, real GDP is not the same as nominal GDP: output valued at current prices.
Chained dollars
the method of calculating changes in real GDP using the average between the growth rate calculated on an early base year and the growth rate calculated on a late base year.
GDP per capita
average GDP per person; not by itself an appropriate policy goal.
Rich is better
Richer countries on average have a higher well-being than poor countries.
Money matters less as you grow richer
As GDP rises, the average gain in life satisfaction per extra dollar gets smaller and smaller.
Money isn’t everything
Sometimes middle-income nations seem more satisfied with their lives than richer nations.
Aggregate price level
a measure of the overall level of prices in the economy.
Market basket
To measure the aggregate price level, economists calculate the cost of purchasing a market basket.
A hypothetical set of consumer purchases of goods and services.
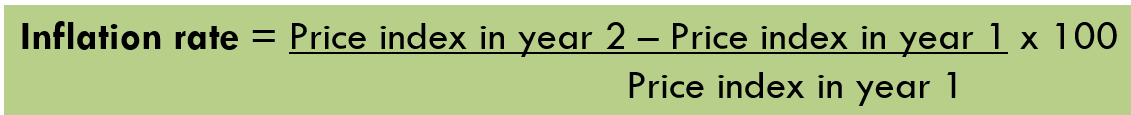
Price index
the cost of purchasing a given market basket in a given year, where that cost is normalized so that it is equal to 100 in the selected base year

Inflation rate
the yearly percentage change in a price index, typically based upon consumer price index, or CPI, the most common measure of the aggregate price level.
Consumer price index (CPI)
The consumer price index, or CPI, measures the cost of the market basket of a typical urban American family
Producer price index (PPI)
similar to the CPI but measures changes in the prices of goods purchased by producers.
GDP deflator
Measures the price level by calculating the ratio of nominal to real GDP
The GDP deflator for a given year is 100 times the ratio of nominal GDP to real GDP in that year.