mock exam
 Call Kai
 Learn
Learn Practice Test
 Spaced Repetition
 Match
Match Flashcards
 Knowt Play
1/109

Earn XP
Description and Tags
Micro Opportunity cost; PPFs; Factors influencing Demand and Supply Market Equilibrium Price and Output; changing equilibriums Consumer and Producer Surplus Price, Income and Cross Price Elasticity of Demand Price Elasticity of Supply -Market Failure (to be confirmed after next week's lessons - definitely all types of externalities; and, likely merit & demerit goods) Macro -The Circular Flow of Income Model -The Components of Aggregate Demand -The AD function -Aggregate Supply (AS) -Macroeconomic Equilibrium - AD/AS Analysis -Fiscal Policy
Name | Mastery | Learn | Test | Matching | Spaced | Call with Kai | Chat |
|---|
No analytics yet
Send a link to your students to track their progress
110 Terms
PED DEFINITION
measures the responsiveness of demand to a change in price
ped > 1
elastic demand - % change in quantity demand is more than the % change in price
ped< 1
inelastic demand - % change in quantity demanded is less than the % change in price
ped = 1
unitary elasticity - % change in quantity demanded= % change in price
revenue formulate
price x quantity supplied
impact of revenue on inelastic demand
an increase in price leads to an increase in revenue but other factors can influence revenue
impact of revenue on elastic demand
lower prices leads to an increase in revenue but other factors can influence revenue
factors influencing PED INELASTIC
Products which have few substitutes - petrol
products which are necessities
products which have brand loyalty
habit forming products
products which represent small proportion of income
factors influencing ped elastic
luxuries
non branded products
products with substitutes
time - the longer consumers have to adapt the more elastic
products which represent large proportion of income
cross elasticity XED
measures the responsiveness of demand for good a following a change in price for good b
when the XED is negative
this means that the goods are complements
when the XED is positives
this means the goods are substitutes
what the size of XED means
the bigger the number from 0 the closer the complement/substitute relationship
income elasticity YED definition
measure the responsivness of demand following a change in income
YED Meanings
positive = normal goods
>1 = normal luxuries
<1= normal necesscities
negative = inferior goods
influences of YED
pricing decisions
recessions/ booms change consumption patterns
trends in consumption
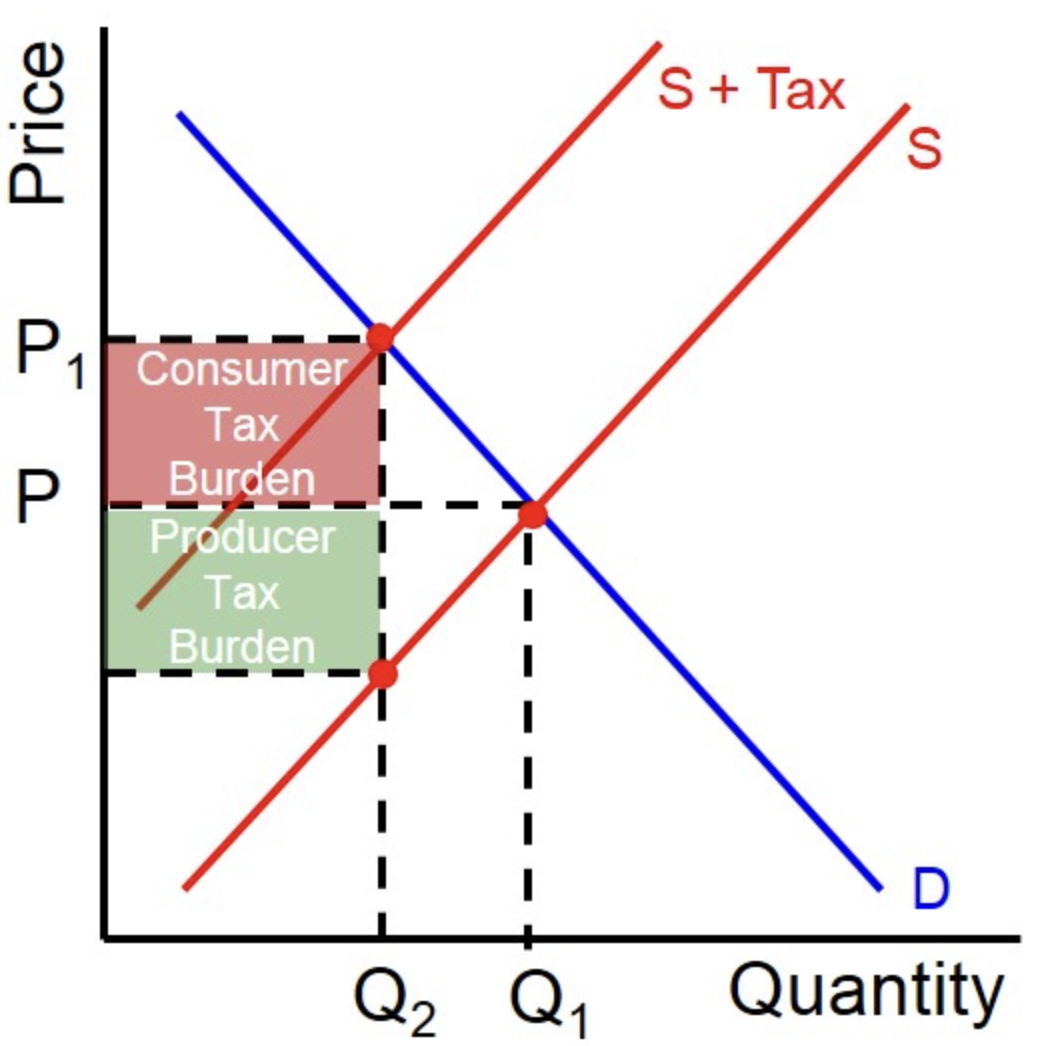
who incidence of tax passed on to
the consumer when demand is inelastic
PES definition
measures the responsiveness of a change in supply to a change in price
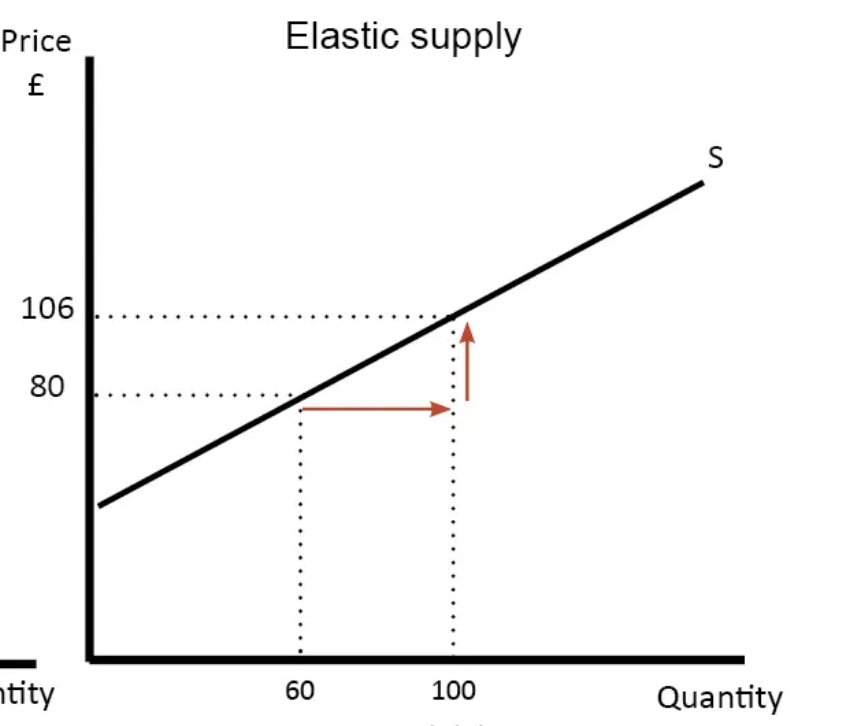
when PES>1 price elastic means
firms can increase output quite easily, without much of a time delay and a relatively small impact on overall costs
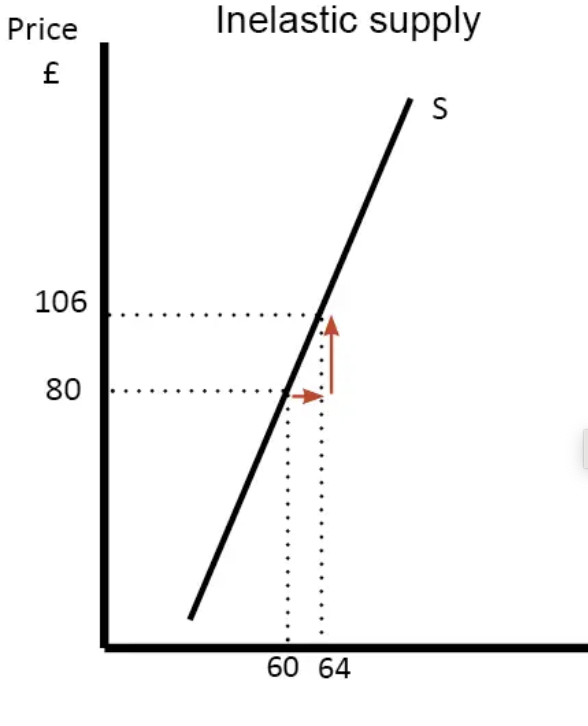
when PES<1 price inelastic means
firms find it hard to change production in a given time period and therefore find it difficult to respond to a change in demand
when PES=infinity, perfectly elastic means
firms able to increase supply to meet any changes in demand without an increase in price
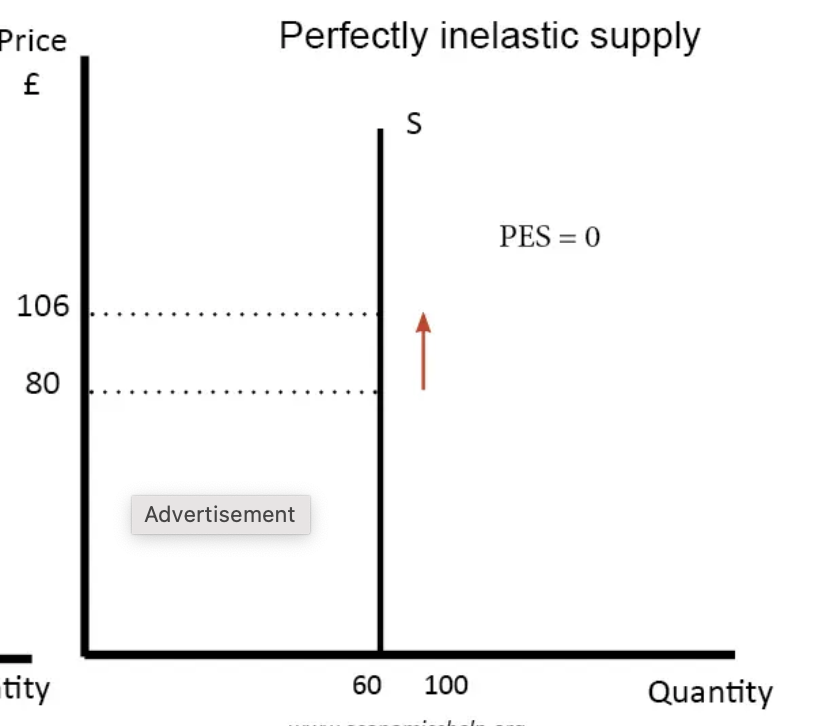
when PES= 0 perfectly inelastic means
firms unable to change supply
factors making pes elastic pes>1 (vice versa)
a supplier has plenty of spare capacity
has high stock levels available
can switch between labour and capital easily when producing goods
short production times
the longer the time period for a firm to adjust production levels
agriculture goods momentary period
pes may be perfectly inelastic PES=0
agriculture goods short run
the long growing/production period
perishability of most produce so inability to store makes it difficult for firms to respond quickly to a change in price PES <1 PRICE INELASTIC
agriculture goods long run
a farmer may commit additional land to production which will lead to a larger crop PES>1 Price elastic
but it may take years to bear fruit ripe for harvest
crops may be imported making supply more elastic
housing short run
supply is inelastic PES<1 in the short run
long production period
legal time delays
planning process
housing long run
supply is elastic PES>1 in the long run
technological advances to speed up production
government policies to train more trades people
government loan guarantees to property developers
OPPURTUNITY COST DEFINITION
this is the cost interns of the benefits of the next best or highest valued alternative forgone
production possibility frontier
a PPF shows the different combinations of economic goods which an economy is able to produce if all resources in the economy are fully and efficiently utilised
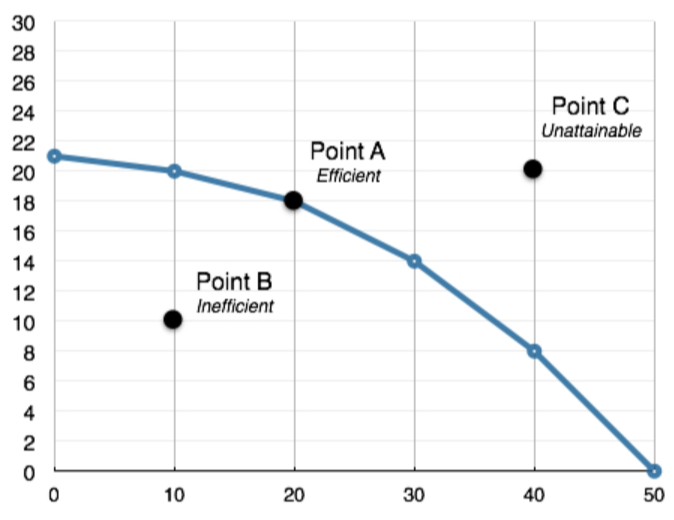
any point which lies within the ppf
represents the insufficient use of resources or resources that remain unemployed
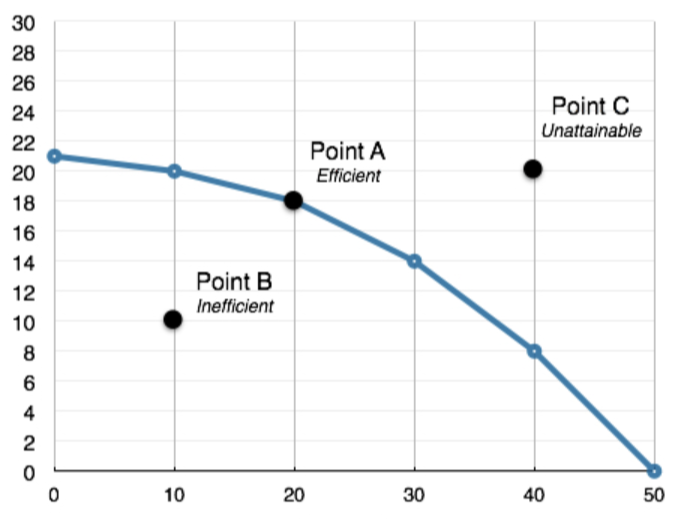
any point which lies outside of the ppf
represents a level of output that is currently beyond the maximum level of the economy. these production levels are attainable in the future only if there is economic growth
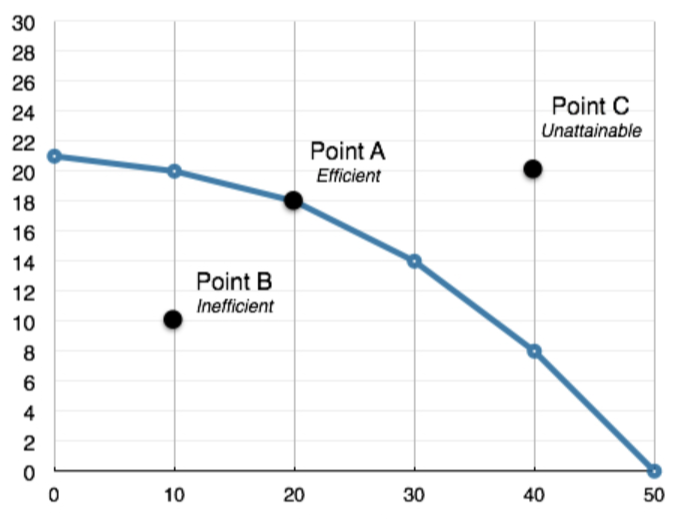
any point along the length of the ppf
pareto optimal which means its impossible to increase the production of one good without reducing production of the other n
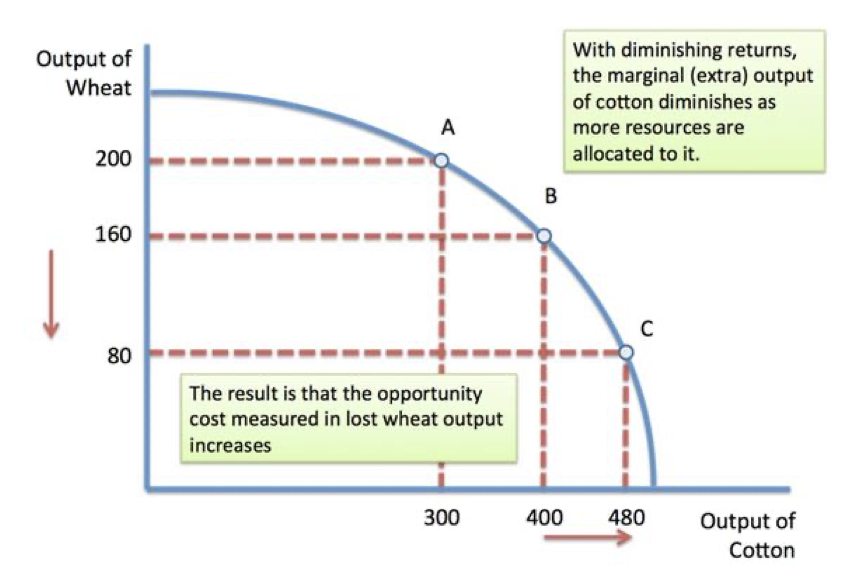
ppf with increasing oopitunity cost (diminishing returns)
as the economy produces more of a particular good less and less suitable resources devoted to the production of the other good
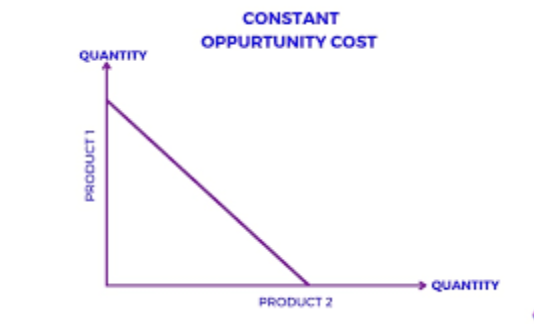
PPF with constant opportunity cost
in order to produce more of one the economy will need to reduce its production of the other this opportunity cost remains the same throughout the the whole length of the ppf
any ppf that is drawn as being a downward sloping straight line
follows the assumption that all resources in the economy are as productive in one use as they are in the other
what causes an outward parallel shift PPF
the introduction of new technology or advances in the techniques of production (division of labour) lead to improvements in productivity and efficiency
additional factors of production being made available to the economy (an increase in the size of the working population, new factories have been built)
what causes a non parrelleL shift PPF
changes in factor of production or in new technology benefit the production of one good/ industry only
skills tip for explaining the impact of a shift in a production possibility
must comment on how it affects the productive capacity and potential of an economy
an inward Parallel or non parallel shift is caused by PPF
natural disaster occurring
a war arises which destroys part of an economy’s productive base
a depletion of resources
impact of a deep prolonged economic recession - closure of businesses, scrapping of. capital equipment, unemployed workers skills becoming redundant
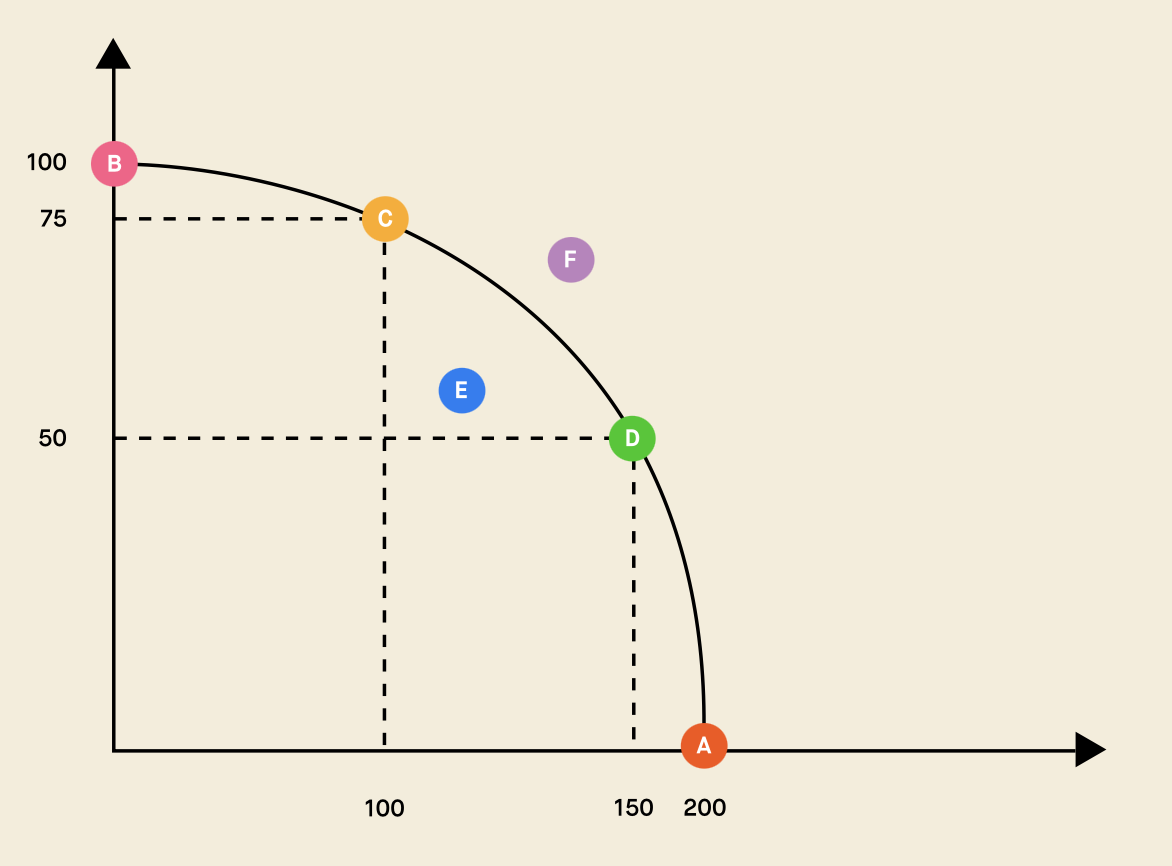
a recession shown as a point further away from the frontier
in the real world an economy is unlikely to operate on its frontier
at all times there will still be some resources such as labour not fully utilised
during a recession even less resources will be fully utilised and the economy would move even further away from the frontier
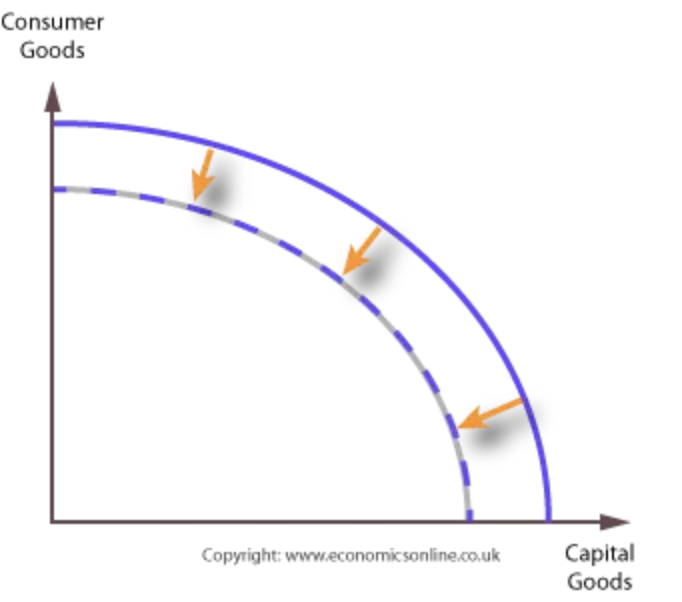
a recession shown as a inward shift of the PPF
a deep recession occurs in the economy could cause a shift in the ppf if
net investment is negative - the level of investment is insufficient to compensate for capital depreciation o that capital levels (factories, machinery) fall in the economy is able to produce less goods and services in the future as a result - the economies productive potential falls
the recession leads to unemployed workers who leave the labour market permanently or whose skills decline so that the productive capacity of the economy is lowered
what does economic growth look like on ppf
during an economic recovery higher demand and output means a fall in the amount of spare capacity which will produce closer to the PPF
macroeconomic policies from the government will shift a PPF outwards as they increase the productive capacity
demand curve may shift rightwards
a rise in the price of a substitutes (competitive demand) or a fall in the price of a complement (joint demand)
an increase in consumers’ income or their wealth
changing consumers taste and preferences in favour of their product
a fall in interest rates
a general rise in consumer confidence and optimism
demand and supply diagram explanations must have
state what has affected the market and the impact on demand and or supply
outline the impact on demand or supply (shift inwards or outwards) and state WHY the curve has shifted in detail
using annotation, explain the process to the new equilibrium and impact on price and quantity
writing about diagrams
reference to specific labels on the diagram
clear explanation as to why curves have shifted
clear explanation of how new equilibrium points are reached
clear explanation of how new equilibrium points are reached
exceptions to the law of demand
ostentatious consumption - some luxurious items satisfaction comes from knowing the price of the good and being able to flaunt consumption of it to other people
speculative demand - buyers are interested in the potential rise in market price leading to a capital gain or profit
reasons for a downward sloping demand curve
the income effect - when the price of a good falls because the consumer can maintain current consumption for less expenditure
the substitution effect - when the price of a good falls because the product is now relatively cheaper than alternative item
diminishing marginal utility - as consumers consume more a product their marginal utility diminishes - firms lower prices to encourage people to buy more
supply curve may sift outwards
a fall in the costs of production
a government subsidy to poroducers that reduces their costs per unit
favourable climatic conditions csusinhg higher than expected yields for agriculture commodities
a fall in price of a substitute in production
an improvement in production technology leading to a higher productivity and efficiency in the production process and lower business costs
reasons for an upward sloping supply curve
profit motive - when the market price increases it becomes more profitable for businesses to increase their output
marginal costs rise - when output expands the marginal cost of production increases therefore higher price is needed to cover the extra costs
new businesses decide to come into the market - higher prices create incentive for businesses to enter the market leading to an increase in supply
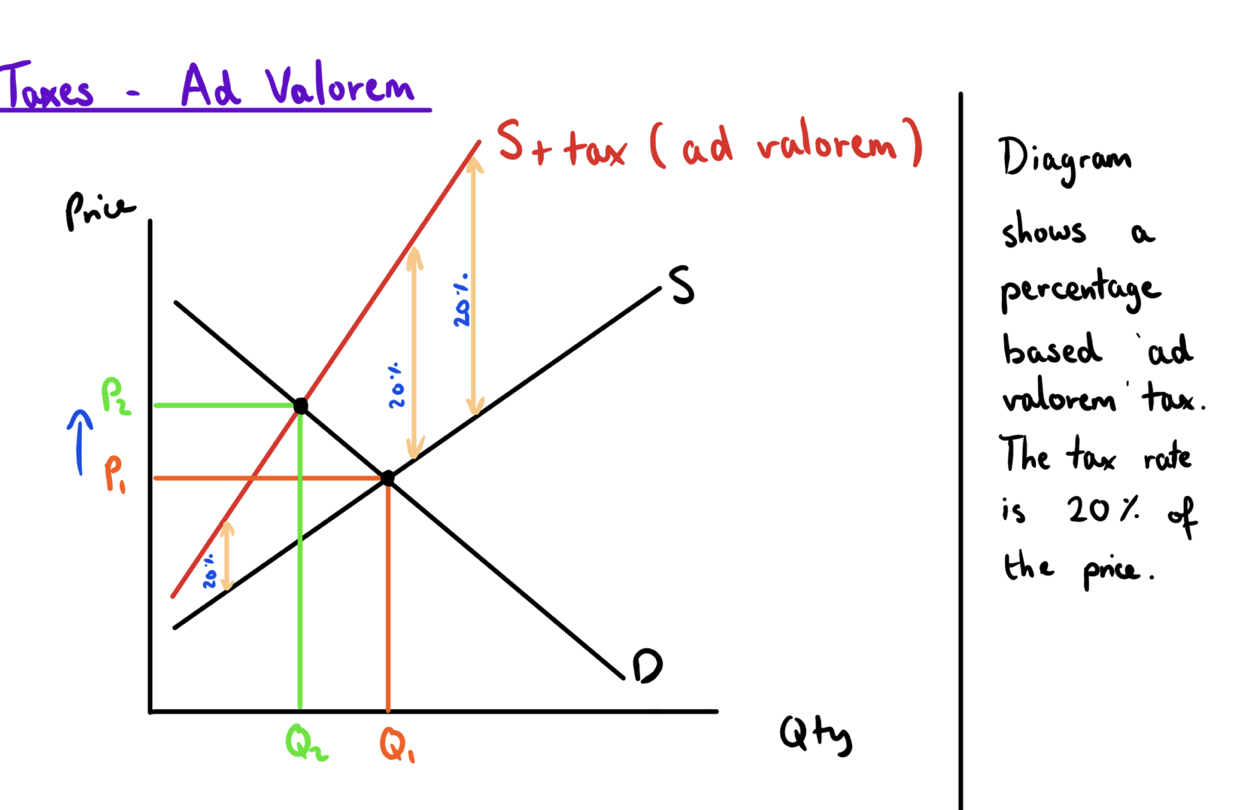
ad valorem tax - vat
described as “diverging shift”
the gap shows the more expensive the product the higher the tax
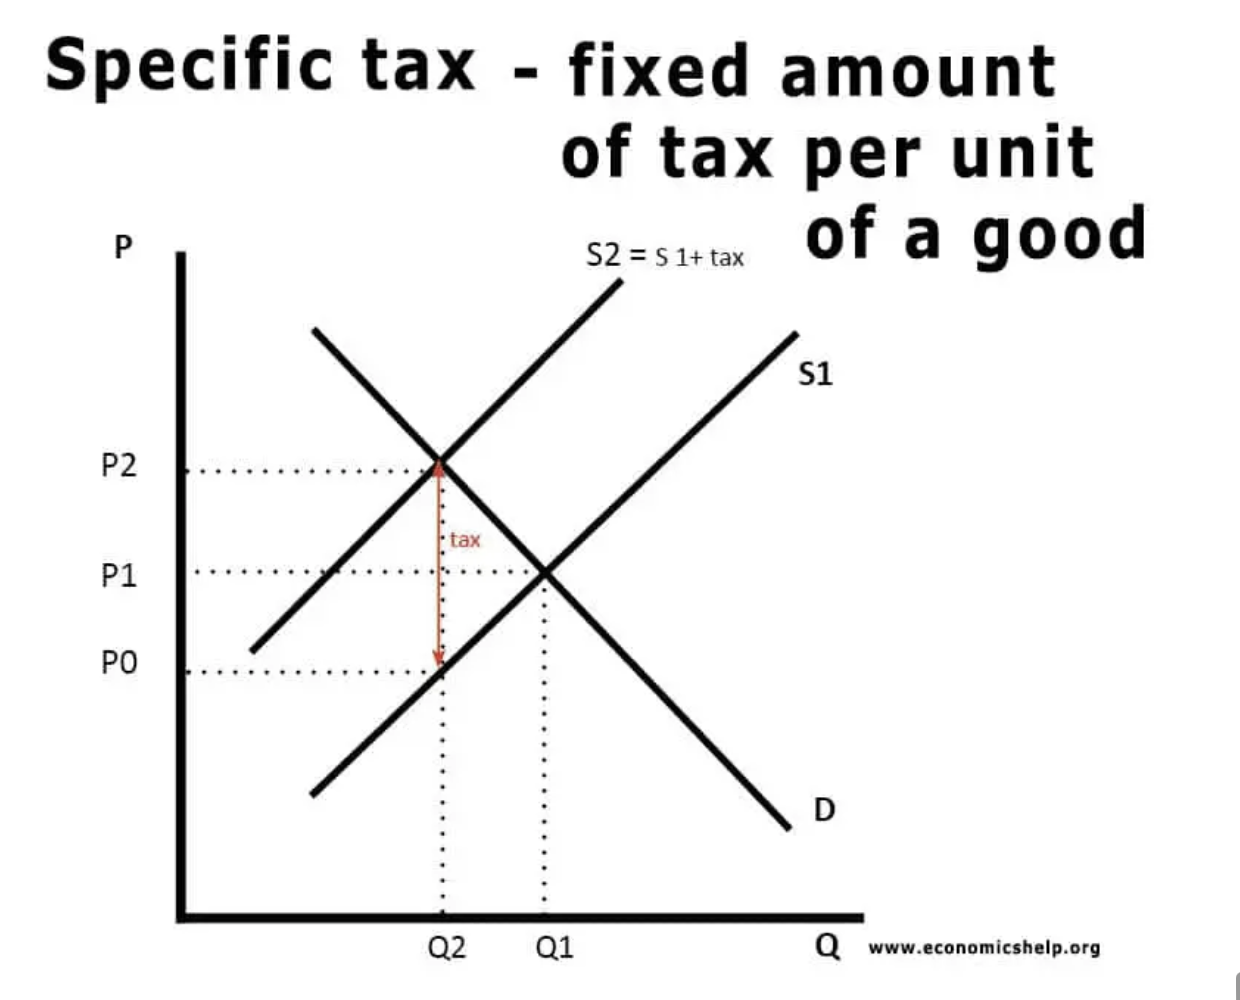
unit /specific tax
described as “parallel shift”
the gap is the size of the tax
increase in demand due to rises in income - changes in equilibrium prices
a cut in income tax leads to an increase in demand for coffee
this is shown as a shift to the right of the demand curve from MD1 TO MD2 ceteris paribus as this leads to an increase in disposable income for consumers who can afford to buy more coffee at each and every price, at the original price there is now excess demand and this puts upward pressure on price
over time there will be an expansion of supply as more coffee is grown imported or enter the market as a result of a rising price this process continues until anew equilibrium is reached at P2Q2 with an increase in both price and quantity traded
increase in supply due to fall in labour costs - change in equilibrium prices
a fall in labour costs leads to an increase in the supply for coffee
this is shown as a shift to the right of the supply curve from MS1 to MS2 ceteris paribus as firms have lower costs per unit and as a result are prepared to supply more at each price. at the original price at PE there is now excess supply and this puts downwards pressure on price
overtime there will be an expansion of demand as consumers purchase more coffee at lower prices. this continues until a new market price equilibrium is eventually reached at P2Q2 with a decrease in equilibrium price and an increase in quantity traded
market surplus
this is when supply exceeds demand therefore creating an excess supply. this will exert downwards pressure on price until market equilibrium is once again achieved
market shortage
this is when demand exceeds supply therefore creating an excess demand. this will exert upward pressure on price until market equilibrium is once again achieved
consumer surplus
is the difference between the total amount that consumers are willing and able to pay for a good or service (indicated by the demand curve) and the actual price paid (the market price for a product)
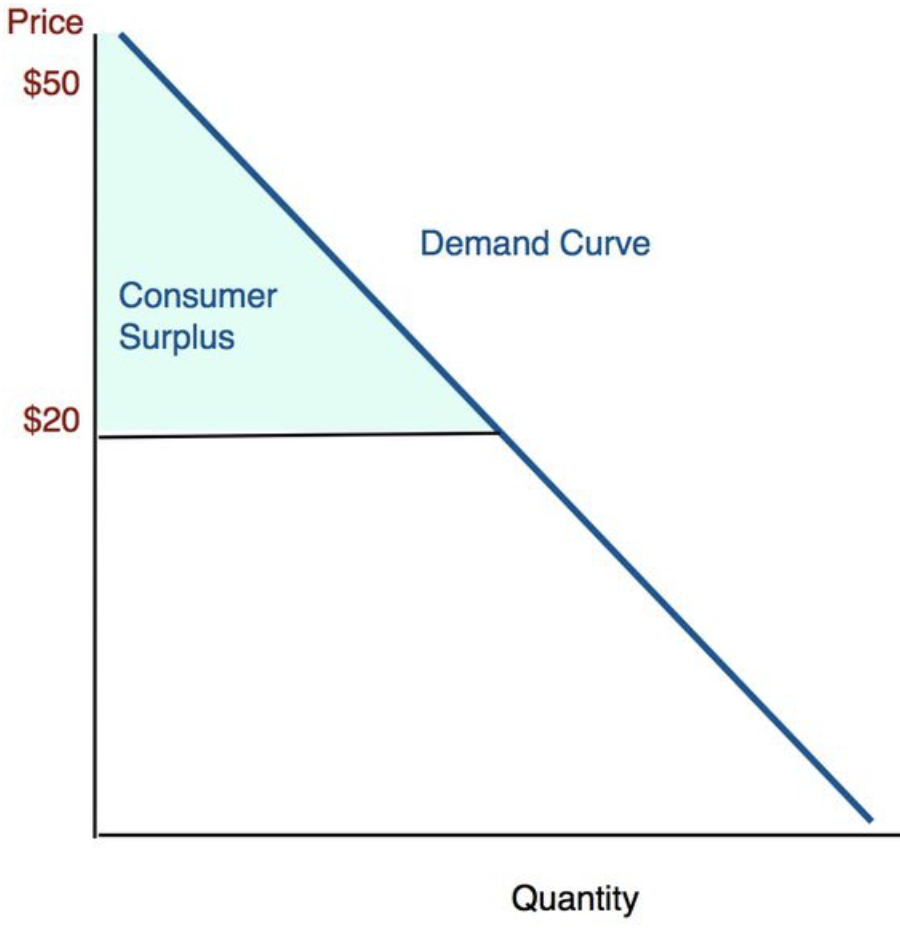
how to find the consumer surplus
shown by the area under the demand curve and above the ruling market price
regressive impact consumer surplus
when price increases consumer surplus falls but there will be a greater negative impact upon lower income houses
progressive impact - consumer surplus
when price decreases consumer surplus increases leading to a greater positive impact upon lower income households
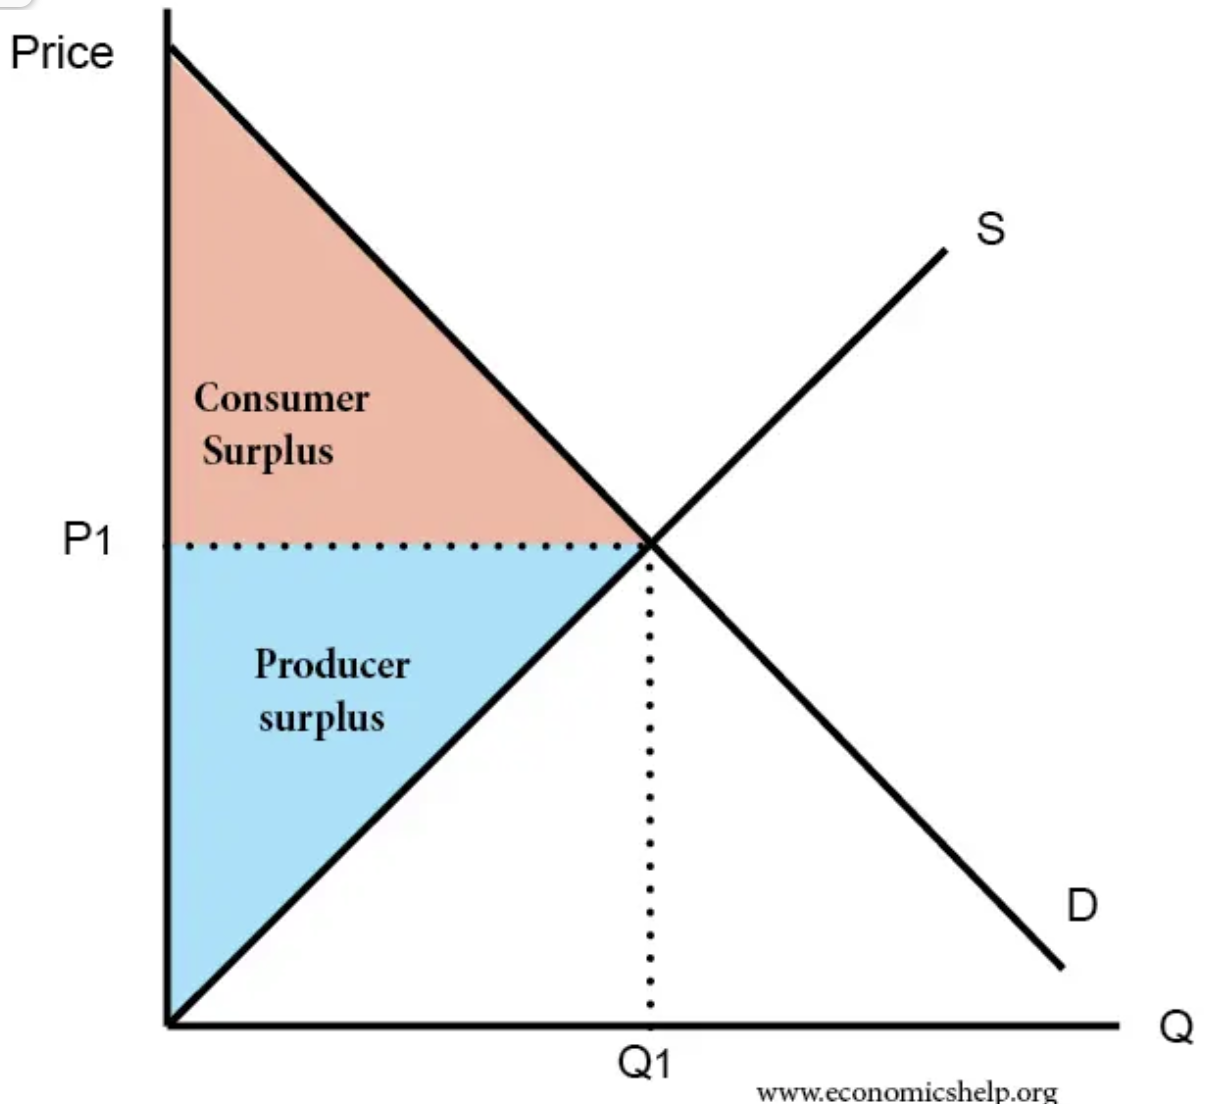
producer surplus
the difference between what producers are willing and able to supply a good for and the price they actually receive
market failure definition
the misallocation of resources caused by unrestricted operation of the free market and or it causes a net welfare loss to society
market failure overview - markets generally work well
price mechanism: competitive markets allocate resources efficiently through the forces of supply and demand and setting the relative prices of goods
market failure overview - sometimes markets fail
market fail ocurs when markets fail to produce desirable outcomes either because the allocation of resources is not efficient or because the outcome is unfair
market failure overview - this may justify government intervention
government may respond to market failure through intervention
market failure overview - government failure sometimes occurs
government failure may occur if there are negative consequences to their policies to address market failure
types of market failure - externalities
third party effects arising from the production of goods or services which no appropriate compensation is paid
costs - market failure
private cost- cost of an activity to a consumer or a firm
external cost - negative third party effect which can arise in production or consumption
social cost - the cost of an activity that includes all private costs and external costs
social costs = private costs + external cost
benefit - market failure
private benefit - pleasure or satisfaction gained from consumption to production
external benefit - a positive third party effect which can arise in production or consumption
social benefit - the benefit of an activity to society that includes all private benefit and external benefit
social benefit = private benefit + external benefit
social optimum level of production and consumption
marginal social costs = marginal social benefit
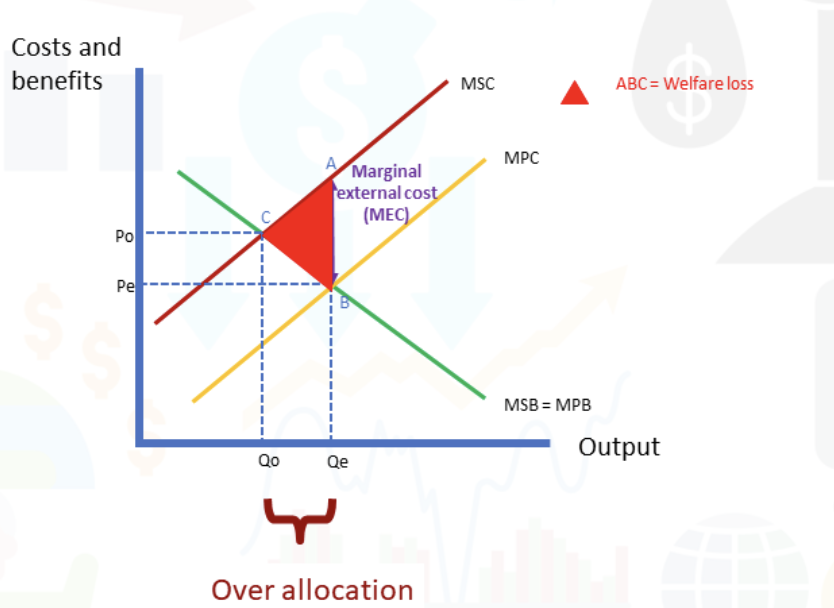
negative production externalities
if social costs are greater than private costs then a negative externality is said to exist this leads to the level of output being greater than the optimum point
the market fails as the individual consumer or producer does not take the effects of externalities into their calculations resulting in too many resources being allocated to the production of a good
air pollution from factories, noise pollution, methane emissions
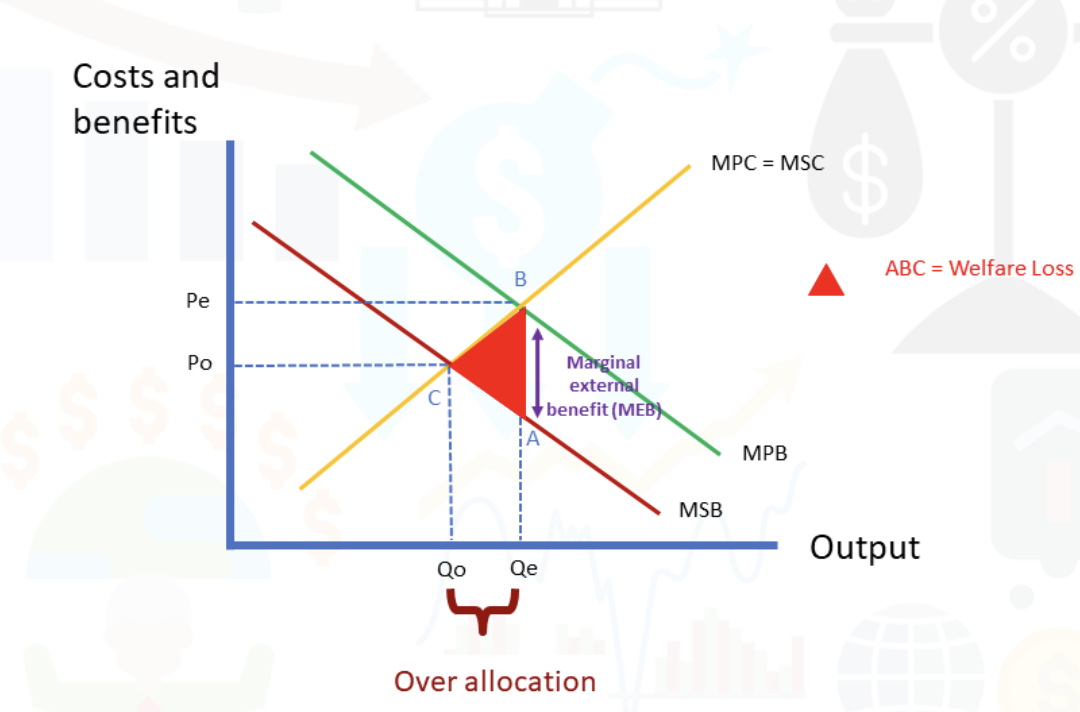
negative consumption externalities
negative consumption externalities lead to a situation where the social benefit of consumption is less than the private benefit
the market fails as consumers do not take into account the loss of benefits to others leading to overconsumption
vehicle pollution, litter, congestion, alcohol consumption
externalities and the absence of property rights
negative externalities may occur because of the absence of clearly defined property rights
if an asset is unowned no one has an economic incentive to protect it from abuse
market failure can occur as it can lead to the overuse of common land, fish stocks which can lead to long term permeant damage to stock of natural resources this is known as “tragedy of the commons”
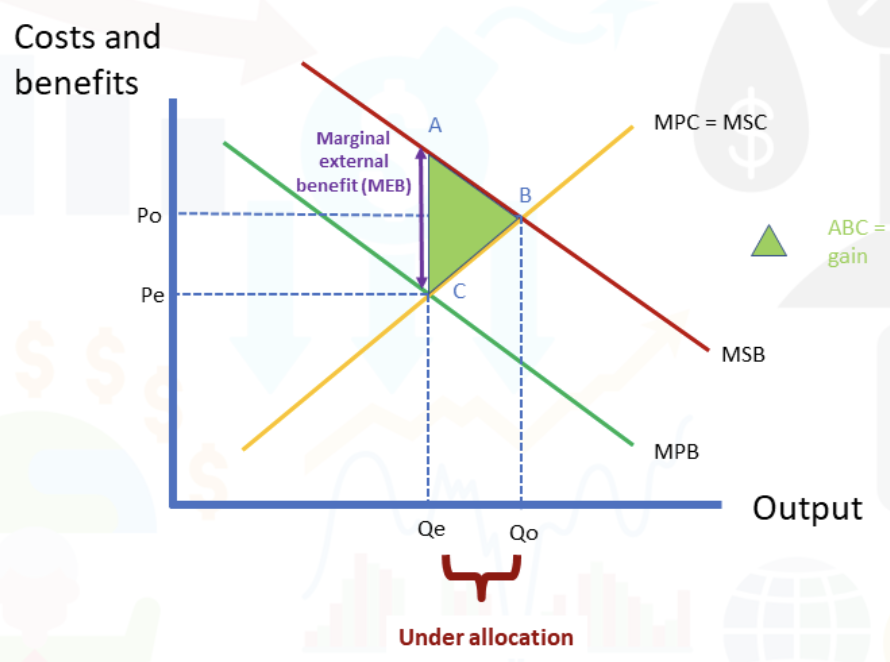
positive externalities in consumption
the total benefit to society may far exceed the benefit received by the individual hence if social benefit is greater than private benefit a external benefit is said to exist
merit goods
are goods which are socially desirable but are under provided in a market economy
merit goods which are associated with positive externalities are provided by the market where producers feel that they can charge and make profit for their provisions
education, healthcare, pensions
why are merit goods such as education under provided by the market
education would be under provided in a free Market economy because the social benefits are greater than the private benefits due to information failure and ignoring external benefits
the external benefits of education which is able to increase productivity and thus compete globally therefore increase living standards would not be taken into account by individuals when deciding whether to Pay for education
individuals might underestimate the private benefits of education -higher earnings potential an example of information failure
individuals may misjudge the private benefits of education because the benefits occur largely in the future
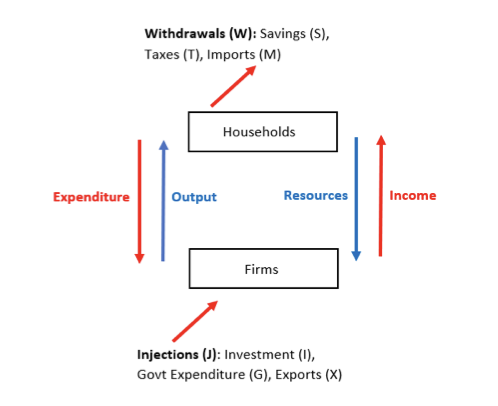
basic circular flow model
Resources: The factors of production that are used by firms to produce output. Labour, Land,Capital, Enterprise.
Income: The income that is received for using factors of production. Wages, Rent, Interest,Dividends, Profits.
Output: Goods and services that satisfy the wants and needs of households.
the multiplier process
an injection (J) into the economy, the multiplier process explains why national income will rise by more than that initial
injection.
the money from the injection helps to employ more factors of production (such as labour) and provide additional income for households. Households then spend a proportion of that additional income (depending on their MPC) on output. This drives demand for more goods and services and, consequently, more demand for labour. This leads to more income for households and more demand for output. The cycle continues.
if injections are greater than withdrawals than national income will increase
if withdrawals are greater than injections than national income will decrease
if injections and withdrawals are equal than national income is in equilibrium
GDP (national income) - can be calculated using circular flow model
the value of all output in a country in a year
measuring national income - GDP (EXPENDITURE)
the sum of aggregate demand (expenditure) for uk produced goods and services
AD= C+I+G+(X-M)
measuring national income - GDP (INCOME)
sum of the final incomes earned through production of goods and services
included - income from jobs, profits from public and private sector
not included - transfer payments, black economy
measuring national income - GDP (OUTPUT)
value of output produced by each of the industrial sectors in the economy
primary - farming, fishing
secondary - manufacturing and construction
tertiary - services, retail, tourism
gross national product GNP
measures the final value of output produced by uk owned factors of production whether they are located in the uk or overseas
gross domestic product GDP
measures the output produced by all firms in the uk including foreign based firms
the multiplier ratio
total change in GDP = injection x multiplier
components of aggregate demand
AD = C+I+G+(X-M)
c- consumers expenditure on goods and services
I- investment spending by companies on capital goods
g- government spending on publicly provided goods and services including public and merit goods
x- exports sold overseas are an inflow of demand into the circular flow of income
m - imports are a withdrawal from the circular flow of income
why the AD curve slopes downwards
real income effect - as the price levels fall the real value of incomes and consumers are able to buy mote of what they want or need
balance of trade - a fall in the relative price of country x could make foreign produced goods and services more expensive causing a rise in uk exports and a fall in imports
interest rate effect - if price inflation is low and this lads to reduction in interest rates - there is a lower reward to save this may lead to a rise in consumption and a rise in investment as the cost of borrowing is cheaper
shifts in AD
Anything that will shift a component of AD
income inflation, taxation, interest rates
aggregate supply
measures the volume of goods and services produced each year. AS represents the ability of an economy to deliver goods and services to meet demand
neo-classical sras (cost of production) curve analysis
a rise in the price level causes an expansion of SRAS
a fall in the price level causes a contraction of SRAS
the short run AS curve is upward sloping because newer firms want to invest as its now profitable and incumbunt firms ramp up production
shifts in short run aggregate supply SRAS
Changes in unit labour costs - unit labour costs are wage costs adjusted for productivity. a rise in unit labour costs might be due to higher wages or a fall in the level of labour
changes in other production costs- the cost of fertiliser
commodity prices - changes to raw material costs and other components
exchange rates - change in exchange rates cause fluctuations in the price of imported products
government taxation and subsidy- changes to the business taxes and subsidies levied by the government as part of their fiscal policy have effects on the costs of nearly every producer
external factors affecting SRAS
world oil/ gas price/ energy prices/ cost - uk is a net importer of oil and energy
minerals/ metal prices- rubber, iron ore
food prices - international prices of fresh foods
import tariffs / quotas
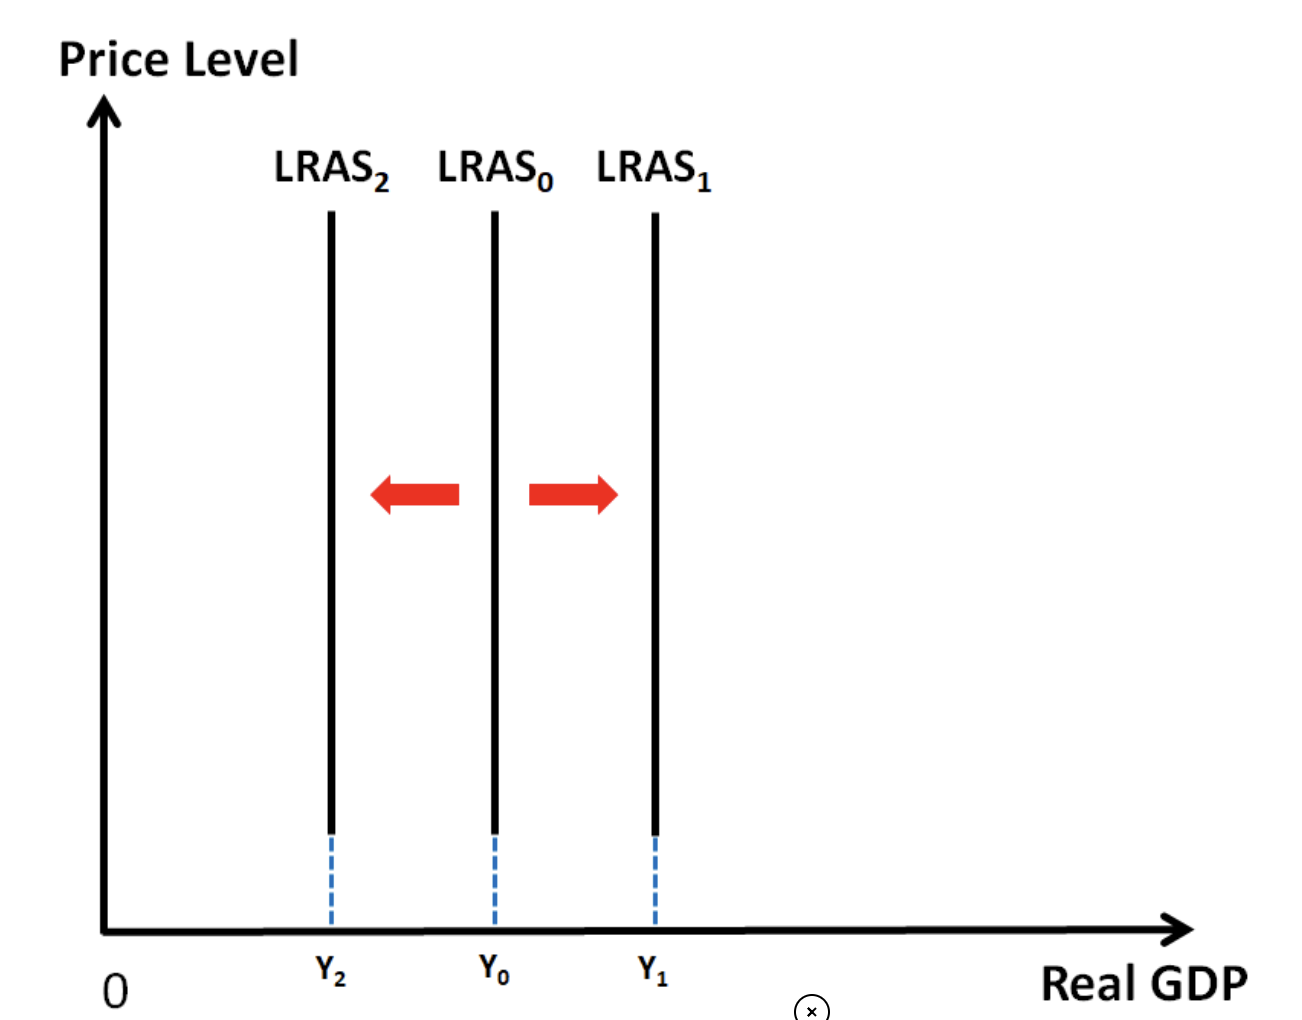
Long run aggregate supply (LRAS - Q2CELL)
SHAPE - yfe is the estimated potential level of real national output in the long run
shift - an outward shift of LRAS shows a rise in productive potential
the LRAS is vertical (perfectly inelastic) as there is a maximum level of physical output that the economy can produces
why there will be unemployment
structural unemployment - skills mismatched - coal miners
voluntary unemployment - benefits
frictional unemployment - people between jobs
factors affecting LRAS(Q2CELL)
high productivity of labour and capital
increased labour market participation
gains from innovation and enterprise
capital investment
what causes a shift in LRAS (Q2CELL)
Changes in labour supply - more people joining the work force - changes to retirement, migrant labour
changes in capital stock - tax incentives and subsidies
improve occupational and geographical mobility - reduce structural unemployment snd occupational mobility caused by decline of specific industries
increase business efficiency - promote greater competition within markets through privatisation
faster pace of invention and innovation - in the long term it can promote Lower production costs and improve competitive position of uk companies
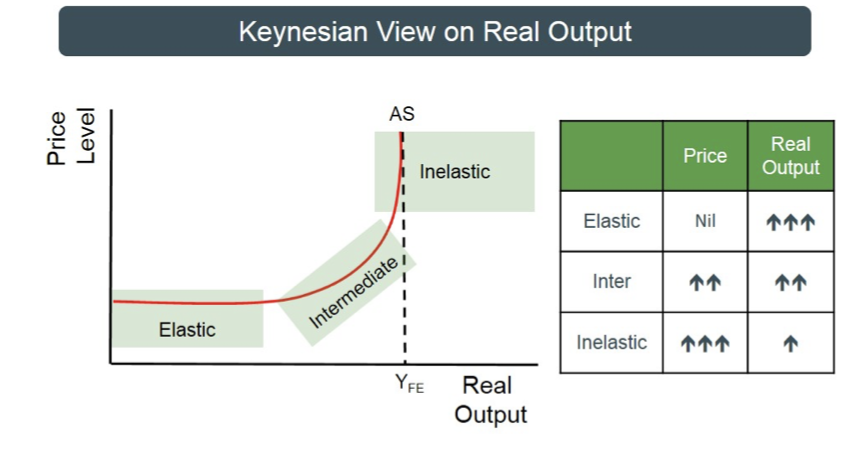
keynesian aggregate supply curve
when spare capacity exists in the economy aggregate supply will be elastic as output can be increased in response to a rise in aggregate demand without a significant change in price level
as output increases the AS curve will become more inelastic as the amount of spare capacity declines, resource shortages. an outward shift in ad causes a sharp rise in general price level
when AS is perfectly inelastic the economy is at full capacity - further increases in AD above yfe are purely inflationary in the short run with little extra real output
fiscal policy
the use of government expenditure and taxation to try and influence the level of economic activity to achieve the main economic objectives of
low and stable inflation
high employment
sustainable economic growth
sustainable balance of payments
key roles of fiscal policy
redistribution of income and wealth
instrument of microeconomic government intervention to correct market failure
respond to economic shocks
financing govt spending