A&A SL: Core Topics: Statistics Vocab
1/32
Earn XP
Description and Tags
Lessons 11A - 11E Vocab
Name | Mastery | Learn | Test | Matching | Spaced |
|---|
No study sessions yet.
33 Terms
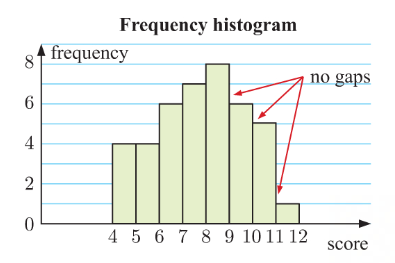
frequency histogram
AKA: histogram
similar to a column graph but the “columns“ are touching
values at the edges of each column indicates class interval boundary
used to represent continuous data
modal class
the class with the highest frequency
seen in both column graphs and histograms

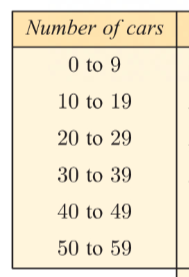
class intervals
when data has many different values with low frequencies it is useful to group the data
then compare the frequencies of each class
EX: *image is a way to group the frequencies*
group
a way to categorize and organize data
outliers
values that are much larger or smaller than the general data body
appears separated on a column graph
retained for analysis
could be a data collection error and if so remove it from the data
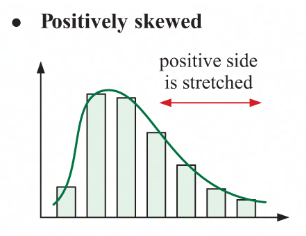
positively skewed
positive side is stretched
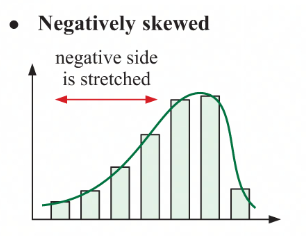
negatively skewed
negative side is stretched
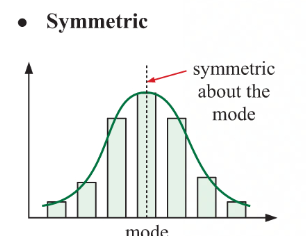
systemic
systemic about the mode
mode
most frequently occurring value
highest column on a column graph
column graph
displays simple data
displays discrete data
possible data on horizontal axis
frequency of data on vertical axis
column widths are equal
height represents frequency
gaps between data indicates discrete

relative frequency
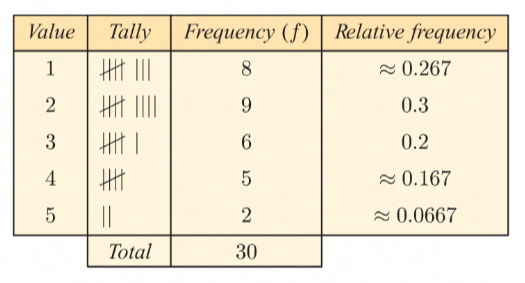
frequency divided by the total number of recorded values
indicates proportion / population of results that take value
frequency
column that summarizes the number of occurrences in each data value
tally
used to count the number of 1s 2s 3s and so on
read data left to right
vertical stroke tally column
represents 5 occurrences
quantitative continuous variable
any numerical value in a certain range
result of measuring
quantitative discrete variable
exact numerical
result of counting
numerical data
all information collected
quantitative variable
has numerical value
categorical data
all collected information
categories
what data is divided into
categorical value
specific quality or characteristic
variable
a part of data collection that is associated with the population
will either be categorical or numerical
stratified / quota sampling
when a population can be divided into subgroups
when subgroups can be equally represented
EX: a high school divided into grades
stratified sample: individuals from each strata are selected
quota sample: individuals specifically chosen by the interviewer
convenience sampling
selecting a sample based on who is more accessible or more likely to respond
systematic sampling
selecting members of a population at regular intervals
useful when not all population members are available at the same time
simple random sampling
each member of the population has the same chance of being selected for the sample
each set of n members has the same chance of being selected as any other set of n members
practical to number the members and randomly generate to select the sample
randomly select
helps to prevent bias
everyone has an equal chance at being selected
non-responded error
lack of a response
could be due to a variety of factors
coverage error
sample does not reflect population
proves that the sample needs to be large and unbiased
measurement error
inaccuracies in measurement regarding data collection
slight differences from actuality
could be due to bad questions
census
accurate way to study a population of interest
understand that it is impossible to study the total population
sample
the select group from a population
error
when estimation is incorrect
sampling error
characteristic of sample differs from total population
random