2.5.2 Output gaps (copy)
1/13
Earn XP
Description and Tags
Name | Mastery | Learn | Test | Matching | Spaced |
|---|
No study sessions yet.
14 Terms
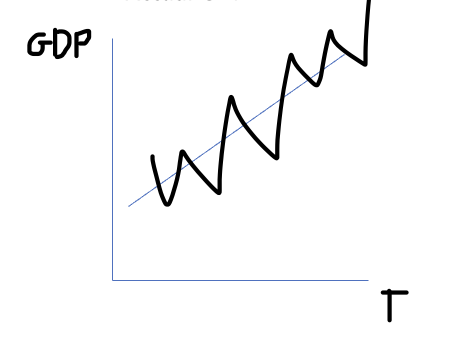
Actual growth
the percentage increase in a country’s real GDP and it is usually measured annually. It is caused by increases in AD
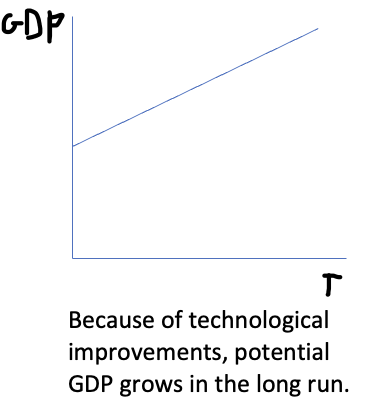
Potential trend of GDP
the long run expansion of the productive potential of an economy
Positive and negative output graph
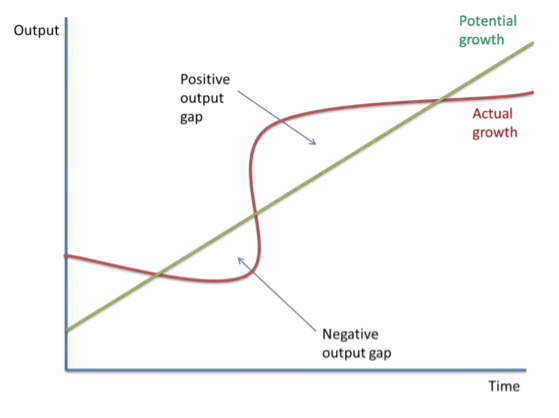
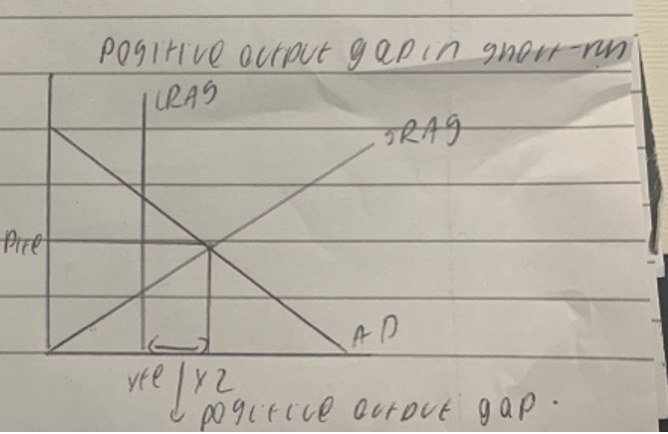
Positive output gap
the economy is performing over its potential overusing its resources
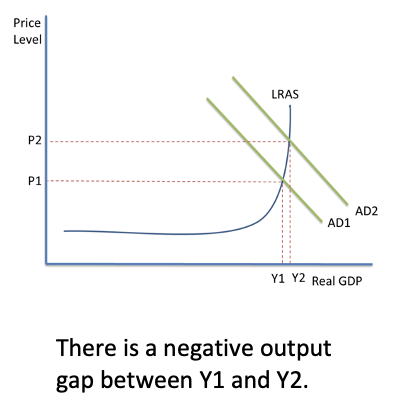
Negative output gap
the economy is not using its resources effectively enough
Output gap
difference between actual GDP and potential GDP, measured as a percentage of national output
When does negative output gap occur?
when the actual level of output is less than the potential output. Downward pressure on inflation means the unemployment of resources in an economy, so labour and capital are not used to their full productive potential. This means there is a lot of spare capacity in the economy
When does positive output gap occur?
gap occurs when the actual level of output is greater than the potential level of output. It could be due to resources being used beyond normal capacity. If productivity is growing, the output gap becomes positive.
Potential trend GDP graph
Actual GDP graph
Difficulties of measuring the output gap
It is difficult to estimate the trend in a series of data.
The structure of the economy often changes which means estimates may not always be accurate.
Changes in the exchange rate might offset some inflationary effects of a positive output gap.
Data is not always reliable, and extrapolating data from past trends might lead to uncertainties.
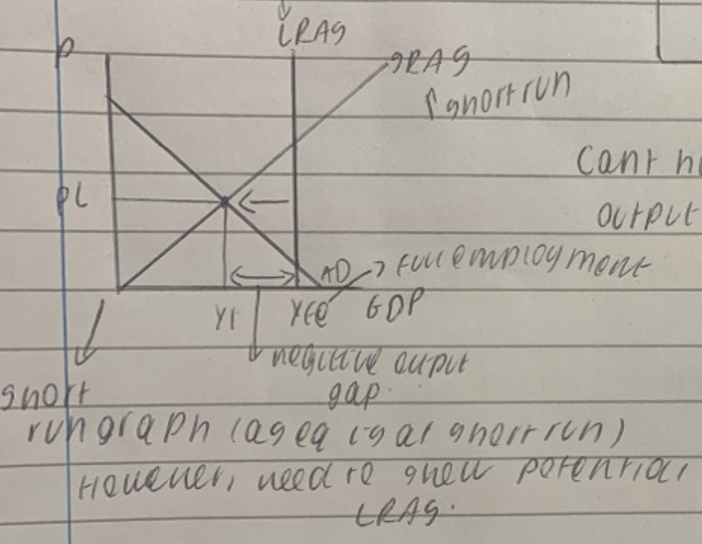
Negative output gap in long run graph
Positive output gap in short run
Negative output gap in the SR