6. Forces affecting genetic diversity
1/36
Earn XP
Description and Tags
Lectures: 16-19
Name | Mastery | Learn | Test | Matching | Spaced |
|---|
No study sessions yet.
37 Terms
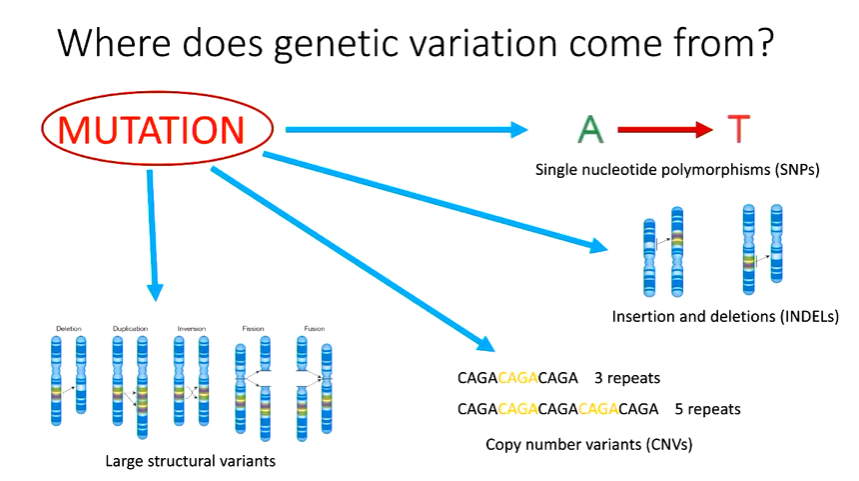
Types of genetic variation?
•Single nucleotide polymorphisms (SNPs)
•Insertion and deletions (INDELs)
•Copy number variants (CNVs)
•Large structural variants (rearrangements)
These occur at locus. A locus is any region in a genome of specific interest. For example, a quantitative trait locus (QTL) is a region in a genome that has an association a quantitative or continuous trait. In other words, any of these types of genetic variation could be considered a region of interest and be referred to generally as a locus. The plural of locus is loci.
What is Single nucleotide polymorphisms (SNPs)?
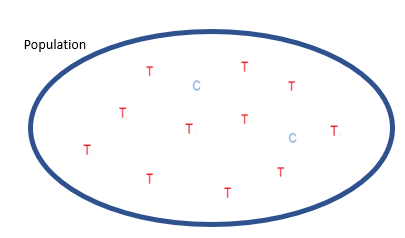
Simplest form of genetic variation is single nucleotide polymorphisms, which are single nucleotide base differences in a population.
We often refer to these differences as alleles.
Example: In this population, almost all individuals have the T allele, with a couple individuals that have the C allele. The T and C alleles represent two single nucleotides at a particular locus (or site) in the genome.
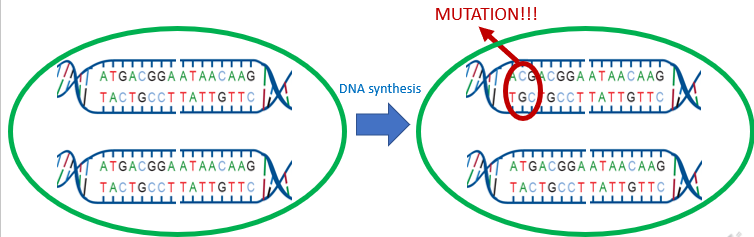
How do SNPs arise from?
SNPs arise by point mutations. In this example, during DNA synthesis (in mitosis or meiosis), a mutation occurs at a locus where a T nucleotide changes into a C nucleotide.
Example of single nucleotide polymorphisms?
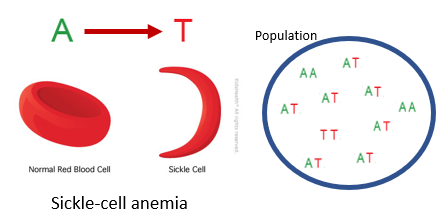
One of the most famous examples of a SNP that persists as genetic variation in human populations is a single nucleotide change from an A to a T at a locus on chromosome 11.
People with two T alleles develop sickle-shaped red blood cells that carry oxygen poorly, causing sickle-cell anemia.
However, in regions with high malaria rates, the T allele is more common because both homozygous and especially heterozygous individuals (with one T and one A allele) are more resistant to malaria. This protective effect explains why the T allele remains prevalent despite its harmful effects.
What is INDELs?
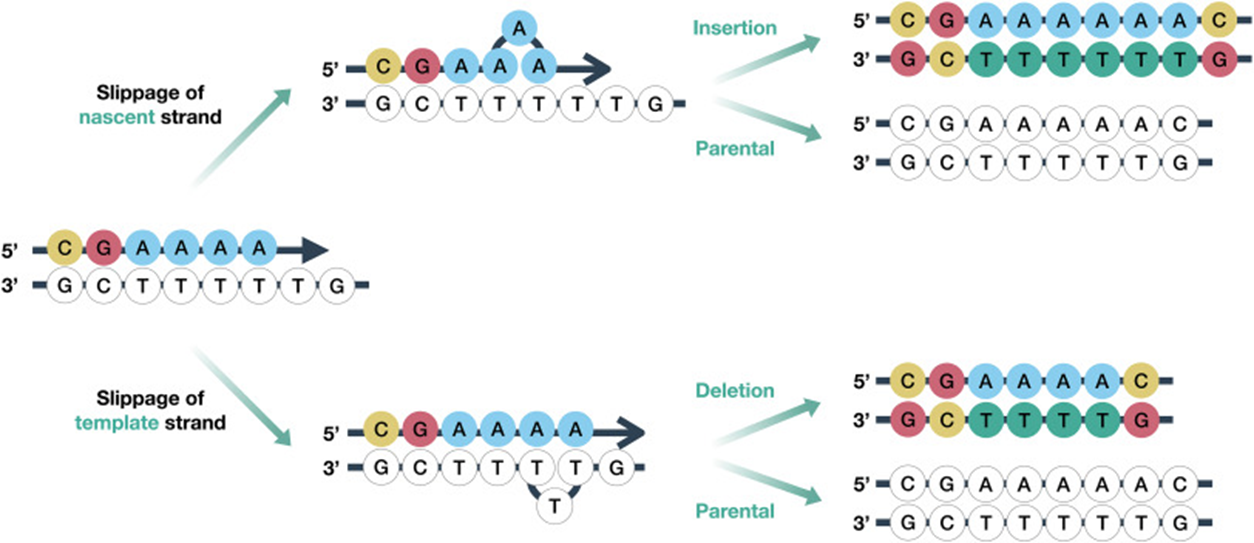
Another type of genetic variation is indels, where one allele is shorter or longer than the other at a locus.
Insertions and deletions can arise by replication error, where slippage of one of the strands being synthesized leads to extra nucleotides being inserted or removed after synthesis.
Insertions and deletions tend to be more deleterious as mutations compared to point mutations because they often result in frameshifts in coding regions.
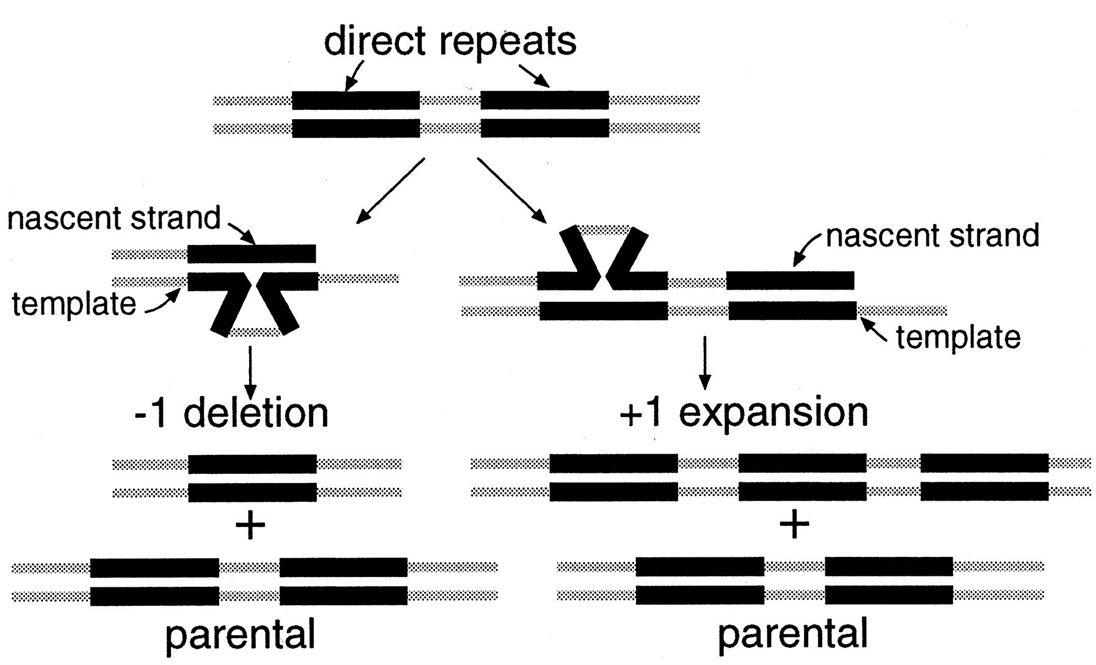
How many nucleotides have to be different for this to happen?
An indel does not have to be a single or a few nucleotide difference.
Deletions and insertions (which are sometimes called expansions in repeat regions) of longer DNA sequences can occur through replication error in a similar way.
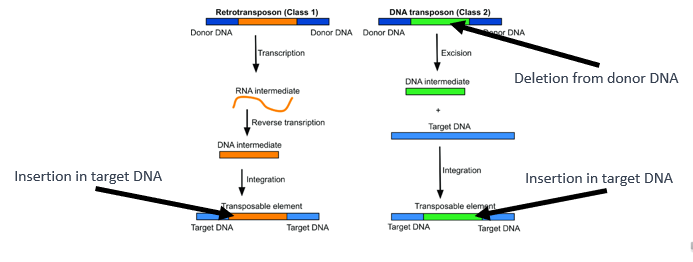
How do transposable elements lead to insertions/deletions?
We have also seen that transposable elements (or TEs) can lead to insertions or deletions.
In the case of class 1 TEs, an insertion occurs in the target DNA, whereas in the case of class 2 TEs a deletion occurs in the donor DNA and an insertion occurs in the target DNA.
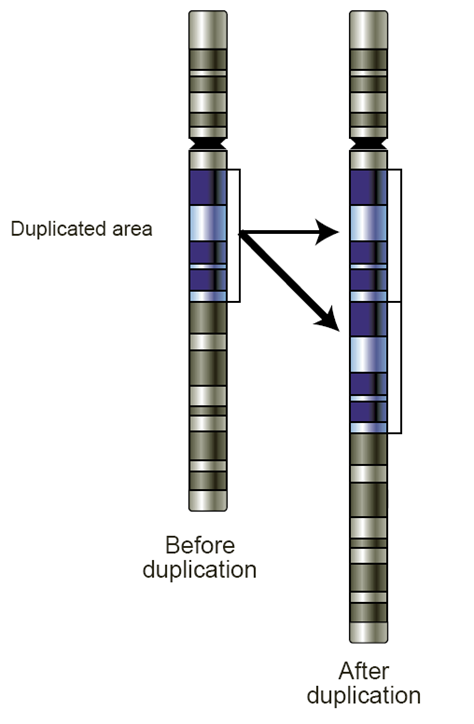
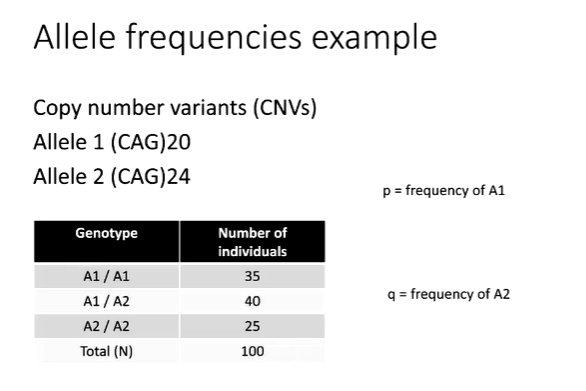
What is copy number variants (CNVs)?
Insertions and deletions in repeats can lead to a specific kind of genetic variant called a copy number variants.
Alleles in CNVs differ in the number of replicates they have.
In the simplest example, a duplication causes a region to have two copies of the same region. This could be considered an insertion compared to the original variant or the two variants (before and after duplication) could be considered copy number variants, with either 1 or 2 copies of the repeat sequence.
Real life example of CNVs?
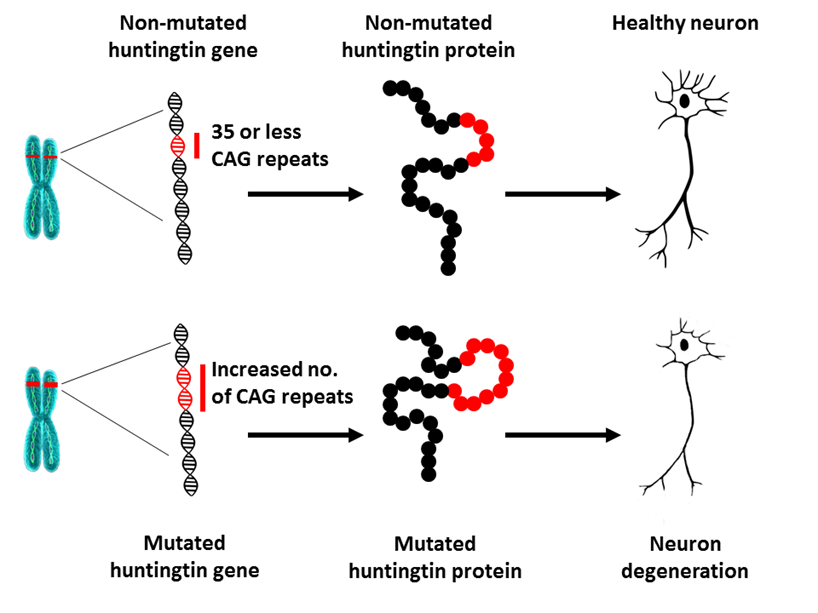
A real example of copy number variance in humans is that of Huntington’s disease.
On chromosome 4, there is a specific locus which consists of a number of repeats of the nucleotide sequence: C A G.
In humans that do not have Huntington’s disease, the copy number of C A Gs is 35 or less, but if a mutation increases the copy number to over 35 repeats of C A G, then the resulting protein from the huntingtin gene causes neuronal degeneration.
What is large structural variants?
There are also many kinds of larger variants (often called structural variants) that can be found in genomes.
Some types of structural variants are just insertions and deletions but on a larger scale.
Often if an indel is longer than 1000 bases, it is considered a structural variant.
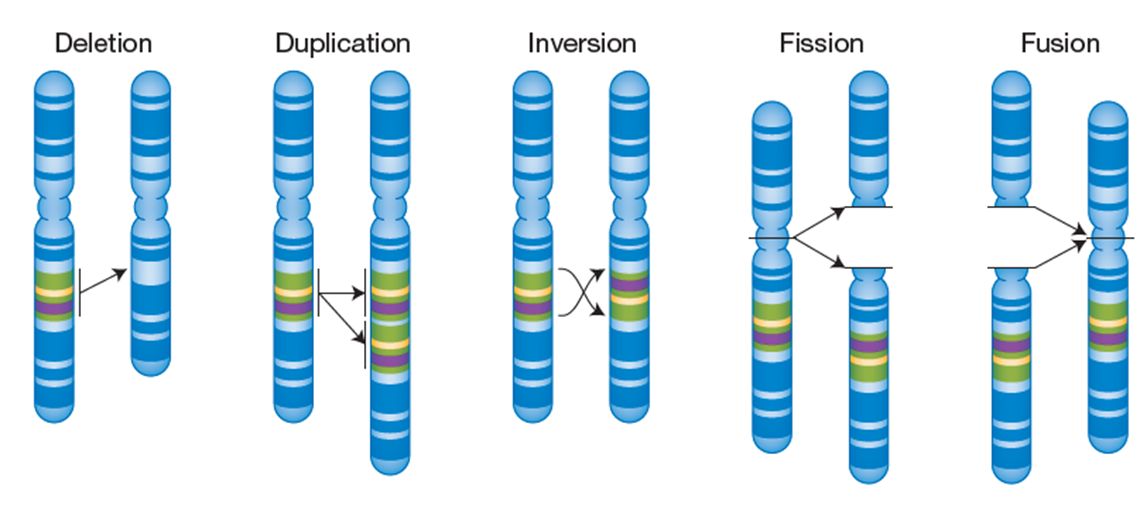
How do large structural variants arise?
Inversions can arise when a chromosome breaks in two places and is repaired in the opposite direction.
This interferes with recombination during meiosis if homologous chromosomes fail to synapse due to lack of homologous sequence in the region of the inversion.
A lack of recombination within the inverted region means that DNA in that region always get passed on as one unit. Depending on what the inverted region contains this can be adaptive or maladaptive.
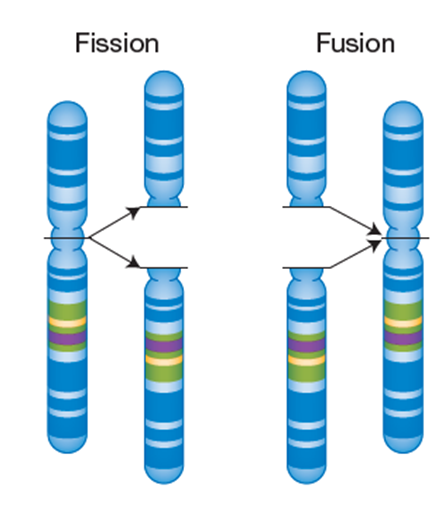
What is fission and fusion?
Fissions are structural variants created when a single chromosome breaks into two separate chromosomes. This is often repaired but not always.
Fusion is when two non-homologous are joined together into one chromosome. The resulting fused or separate chromosomal variant often does not impair function and in some organisms fission and fusions events are quite common.
What are methods for describing genetic variation?
Measures of diversity
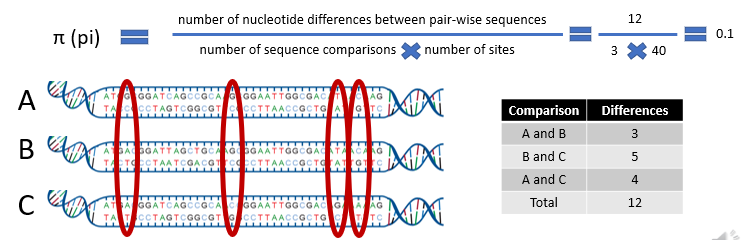
•π (pi)
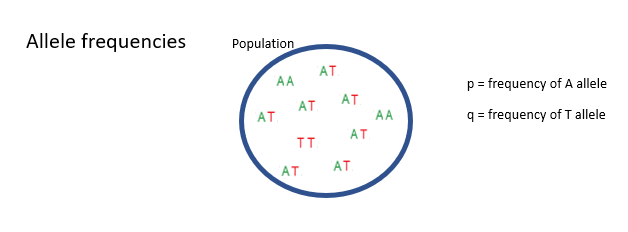
•Allele frequencies
How to measure pi?
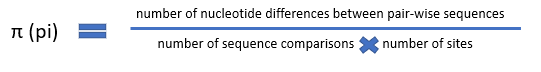
Example of how this works?
We put those 12 differences in the numerator of the formula, and divide by the number of comparisons we did, 3, and the number of sites we looked at.
Here there are 40 nucleotides in each sequence. This gives us a pi of 0.1 or 10% nucleotide diversity.
This may be considered very high compared to humans and other primates that have an estimated pi of 0.001 or 0.1%.
How are allele frequencies measured pt.1?
Here we have a population of diploid individuals with two alleles at a locus of interest. The A allele and the T allele. Some individuals are homozygous for the A allele, some are homozygous for the T allele and some are heterozygous at this locus.
p to mean the frequency of the A allele in the population and q to mean the frequency of the T allele in the population.
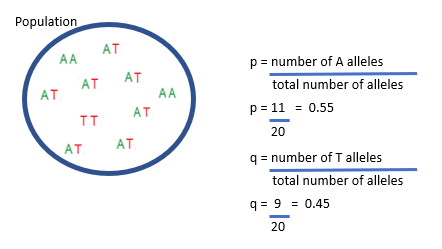
How are allele frequencies measured pt.2?
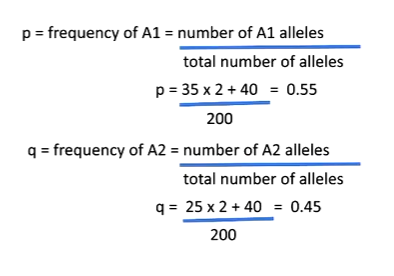
p, the frequency of the A allele, is the number of A alleles divided by the total number of alleles in the population. In this case, there are 11 A alleles in the ten diploid individuals in this population.
The total number of alleles is 20, so p is 11 divided by 20, which equals 0.55. q, the frequency of the T allele, is the number of T alleles divided by the total number of alleles in the population.
In this case, there are 9 T alleles in the ten diploid individuals in this population. The total number of alleles is 20, so q is 9 divided by 20, which equals 0.45.
If there are only two alleles at this locus in the population then q can also be calculated as 1 – p.
What are the expected genotypic frequencies?
Why might there be deviations from expectations?
•Non-random mating
Assortative/Disassortative mating
Inbreeding
•Mutation
•Selection
•Drift
•Migration
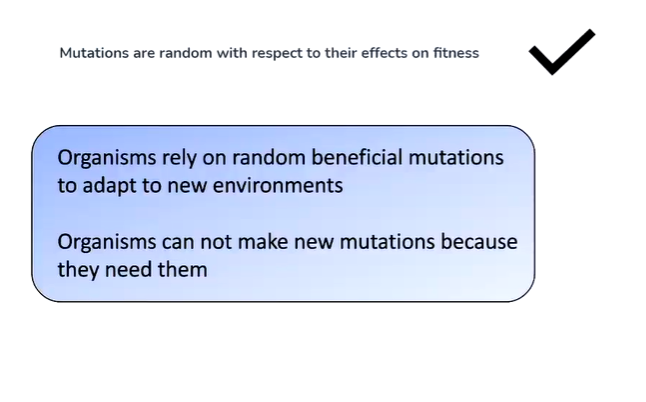
What do geneticists mean when they say that mutations are random?
But bacteria have mutators strains.
Where does genetic variation come from?
What are the frequencies?
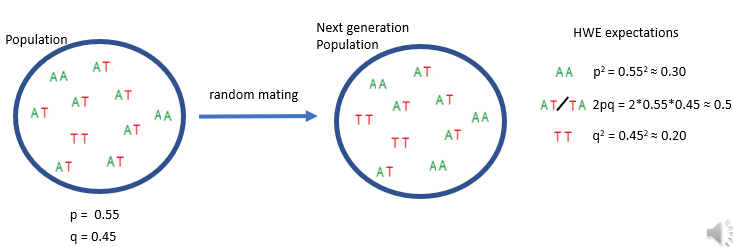
p = 0.55 and q = 0.45
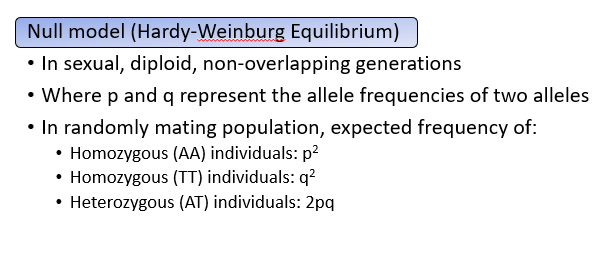
What are the assumptions in the HWE?
The expected genotypic frequencies occur when the alleles in a population are in Hardy-Weinburg equilibrium:
•Random mating
•No assortative/disassortative mating
•No inbreeding
•No mutation
•No selection
•No drift
•No migration
What is random mating?
The alleles A and T are used as example variants at a locus, though any SNP or structural variant could be substituted. In the population, the A allele frequency is p = 0.55 and the T allele frequency is q = 0.45. Under Hardy–Weinberg equilibrium and random mating, the expected genotype frequencies depend solely on allele frequencies:
AA: p2p^2p2
TT: q2q^2q2
AT: 2pq2pq2pq, reflecting the two possible ways to inherit one A and one T.
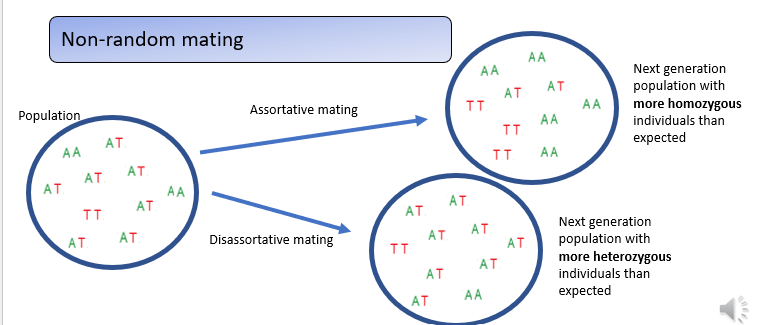
What is non-random mating?
Real populations often violate Hardy–Weinberg assumptions such as random mating.
When assortative mating occurs—individuals choosing genetically similar partners—the result is an excess of homozygotes compared to Hardy–Weinberg expectations.
In contrast, disassortative mating, where individuals prefer genetically dissimilar partners, produces an excess of heterozygotes in the next generation.
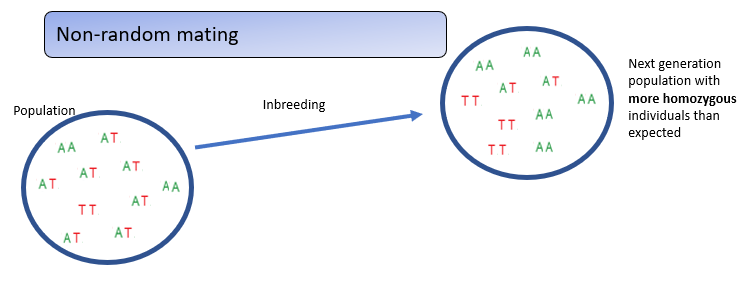
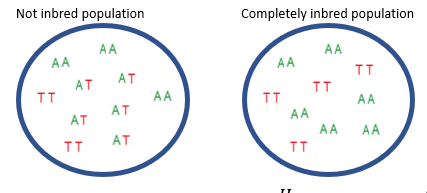
What is inbreeding in non-random mating?
Inbreeding—mating between close relatives—increases homozygosity across all loci, unlike assortative mating, which increases homozygosity only for traits involved in mate choice.
This genome-wide rise in homozygosity can expose harmful recessive alleles, leading to inbreeding depression.
What is the inbreeding coefficient?

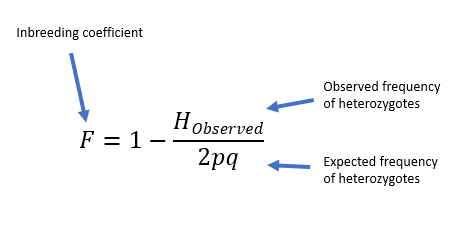
What does this tell us?
If the observed heterozygote frequency matches the expected Hardy–Weinberg frequency, the inbreeding coefficient F = 0, indicating no inbreeding. If a population has no heterozygotes, the inbreeding coefficient F = 1, indicating complete inbreeding. Thus, an example population with F = 0.583 is substantially—but not fully—inbred.


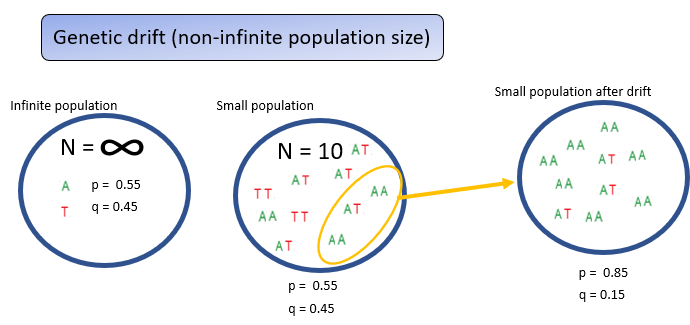
What is genetic drift?
Using a small visual example of 10 individuals to represent an idealized infinite, randomly mating population, where allele frequencies reliably match p = 0.55 and q = 0.45.
In real finite populations, chance events—such as random deaths, disasters, pathogens, or the founder effect—can cause only some individuals to contribute to the next generation.
This random sampling alters allele and genotype frequencies, producing deviations from Hardy–Weinberg expectations. Such random, generation-to-generation changes in allele frequencies are known as genetic drift.
What does genetic drift cause?
Smaller populations lead to more genetic drift
Can lead to fixation / loss of alleles (unbiased)
Divergence between populations
What does selection lead to?
Heritable genetic differences in a population
Those genetic differences lead to phenotypic differences
Those phenotypic differences have differential effects on survival/reproduction
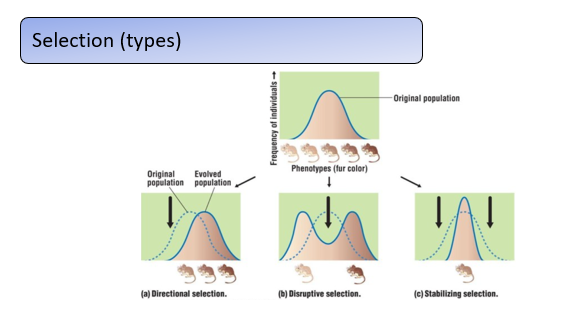
What are different types of selection?
Selection can change allele and genotype frequencies in different ways. Using fur colour in mice as an example of a continuous trait:
Directional selection favors one extreme phenotype, shifting the trait distribution (e.g., selecting for darker fur increases the frequency of alleles for dark coloration). It commonly occurs in artificial selection or changing environments.
Disruptive selection favors both extremes while selecting against intermediate phenotypes, producing a bimodal distribution (e.g., very light and very dark fur are advantageous, but intermediate shades are not). This is the rarest form of selection.
Stabilizing selection favors intermediate phenotypes and removes extremes, reducing variability (e.g., both very light and very dark fur being selected against). This is thought to be the most common type, maintaining traits within optimal functional ranges.
How does selection work on the genotype level?
Selection acts on genotypes through fitness, which measures how well organisms survive and reproduce. Relative fitness compares how successful different genotypes are. Fitness is denoted by W.

Also, by convention, we assign one to the genotype with the highest fitness. In this example, the genotype that is homozygous for the A1 allele has the highest fitness and therefore W one one is set to one. Then the fitness values of the other two genotypes will be relative to W one one.

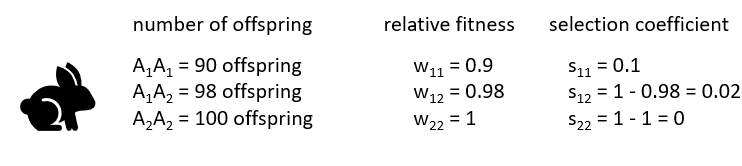
How do we calculate this?
In an example with rabbits, fitness is measured by comparing the number of offspring produced by each genotype. The most successful genotype (A₂A₂, producing 100 offspring) is assigned a relative fitness of 1. Other genotypes are scaled relative to it: A₁A₁ has fitness 0.9 (90/100) and A₁A₂ has fitness 0.98 (98/100).
The selection coefficient shows how strongly each genotype is selected against: 0.1 for A₁A₁, 0.02 for A₁A₂, and 0 for A₂A₂. Since selection acts more strongly against genotypes carrying the A₁ allele, the A₂ allele is expected to increase in frequency over time.
What can selection lead to?
Can lead to fixation / loss of alleles (biased)
Divergence between populations (disruptive) or increased similarity (stabilising) within a population depending on type of selection
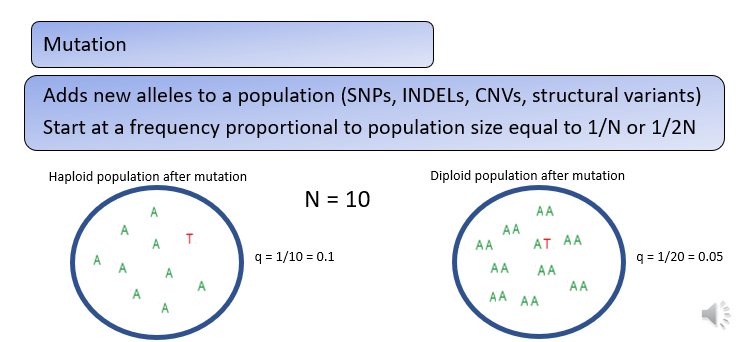
How do mutations change allele frequencies?
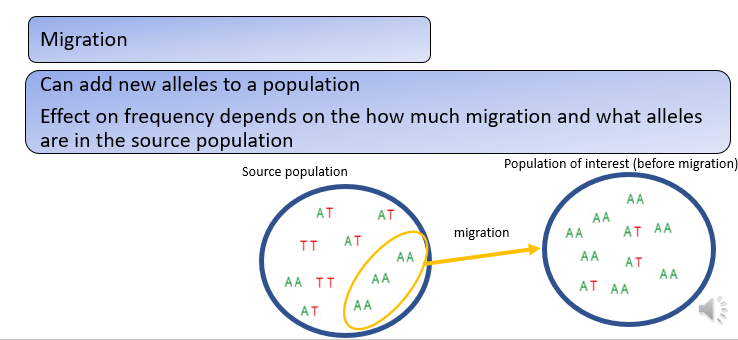
Mutation will also cause changes in allele frequencies, often by adding a new genetic variant, or allele to a population.
The frequency of new alleles in a population is determined by the number of individuals in a population and the ploidy of the organism.
In haploids the frequency of a new allele is 1 divided by N and in diploids the frequency of a new allele is 1 divided by 2 times N, where N is the number of individuals in the population
How can migration change allele frequencies?