AP Precalculus Unit 1
1/47
There's no tags or description
Looks like no tags are added yet.
Name | Mastery | Learn | Test | Matching | Spaced |
|---|
No study sessions yet.
48 Terms
Function
describes the relationship between variables
Inputs
what goes into the function
Outputs
what comes out of the function
Domain
collection of all inputs
Range
collection of all outputs
Independent Variable
a variable that does not depend on any other variable for its value
Dependent Variable
a variable that depends on another variable for its value
Changes in tandem
Graphical model
Numeric Model
Solution is represented in a table/graph
Analytic model
Verbal model
describes a real-life situation using words as labels and using math symbols to relate the words
Interval
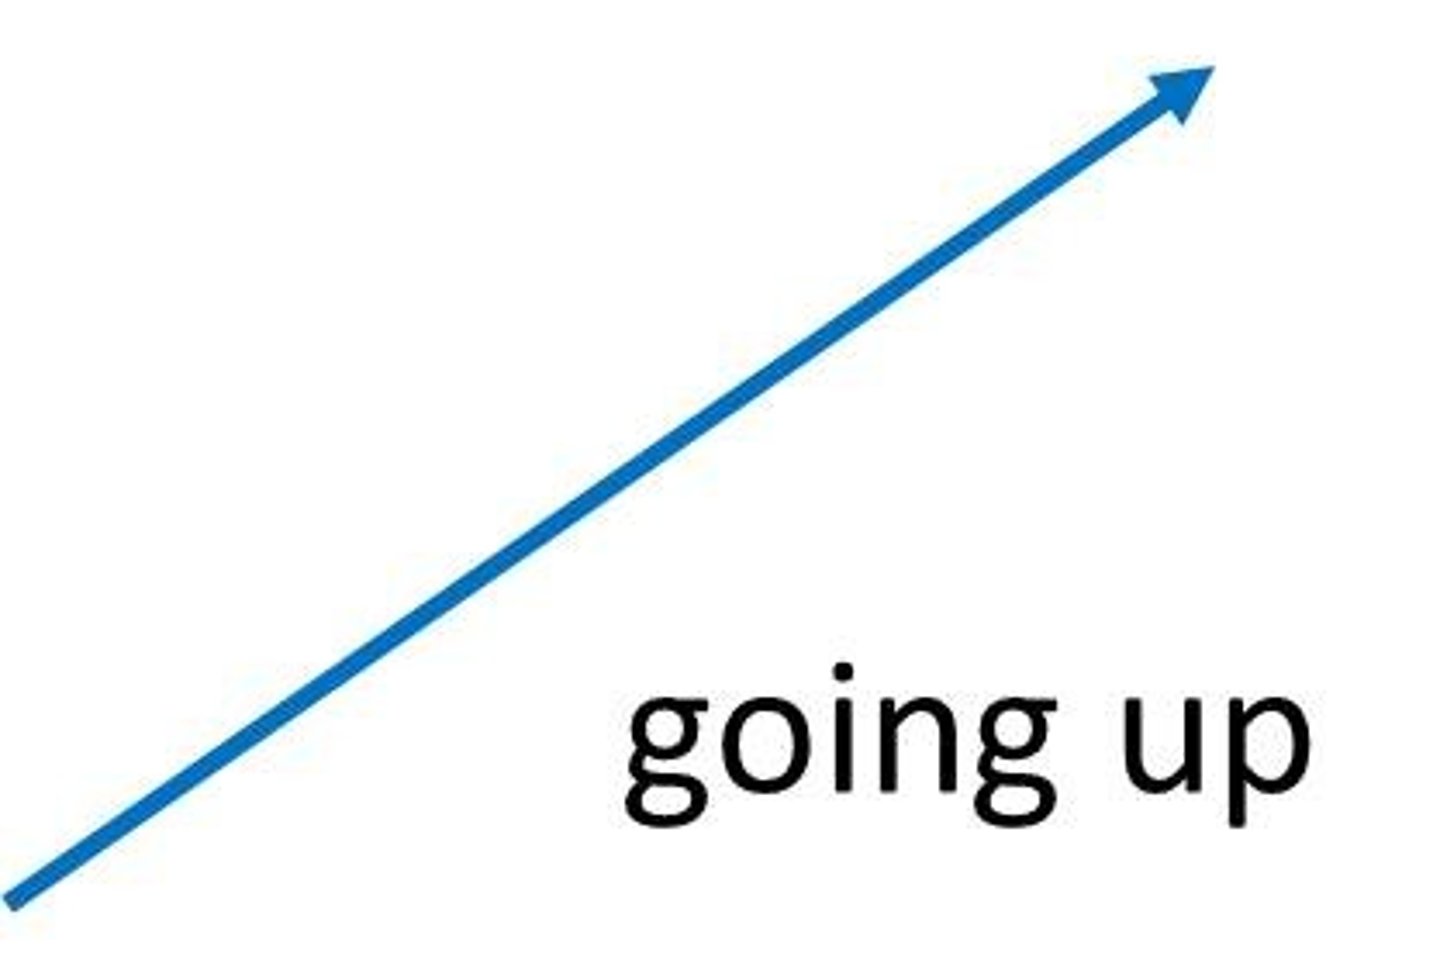
Increasing function
when the value of y increases on increasing the value of x
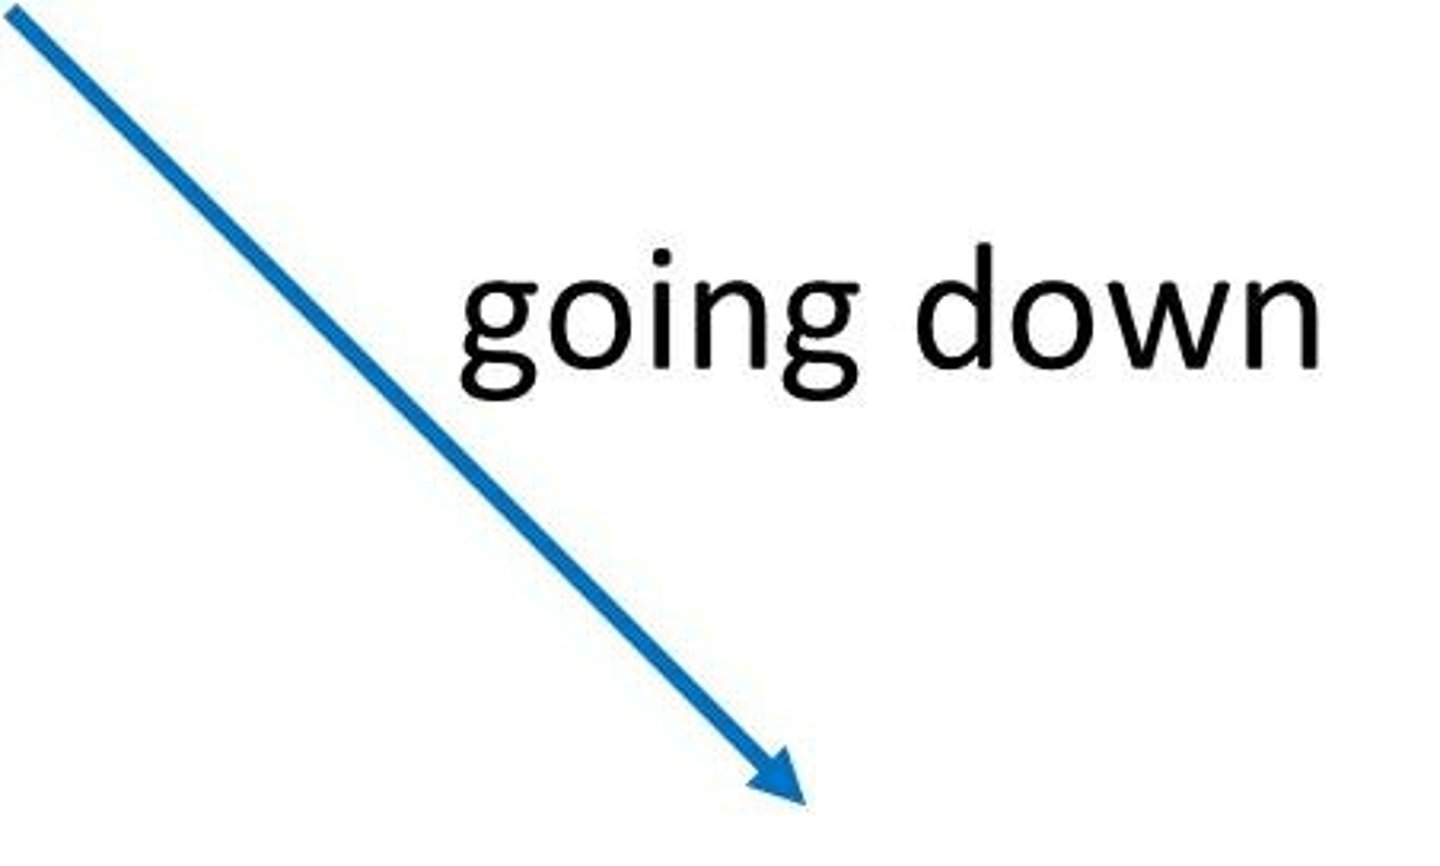
Decreasing function
the y-value decreases as the x-value increases
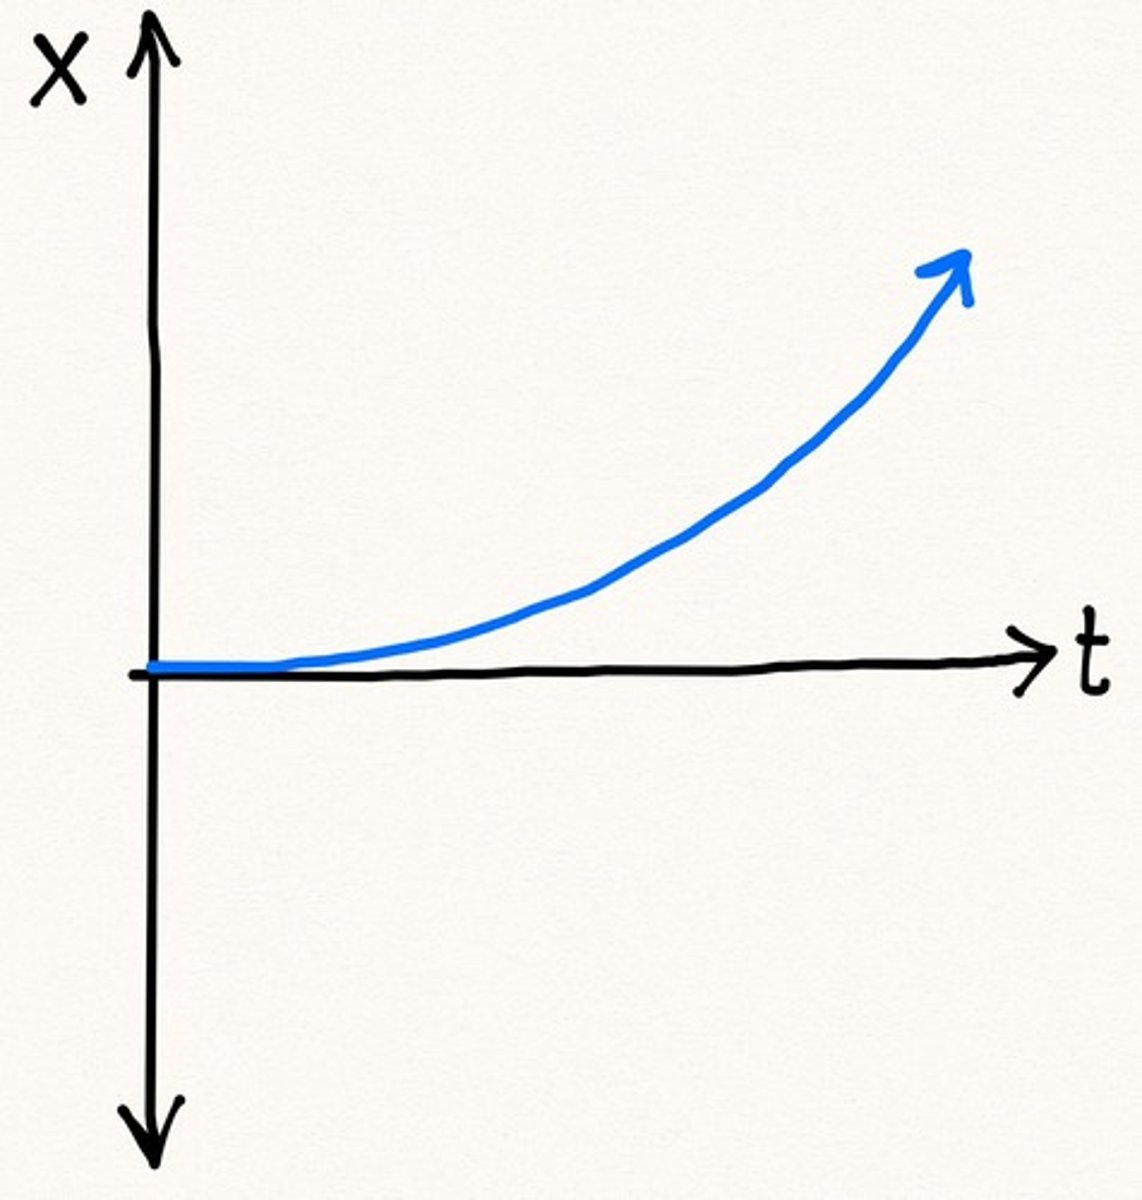
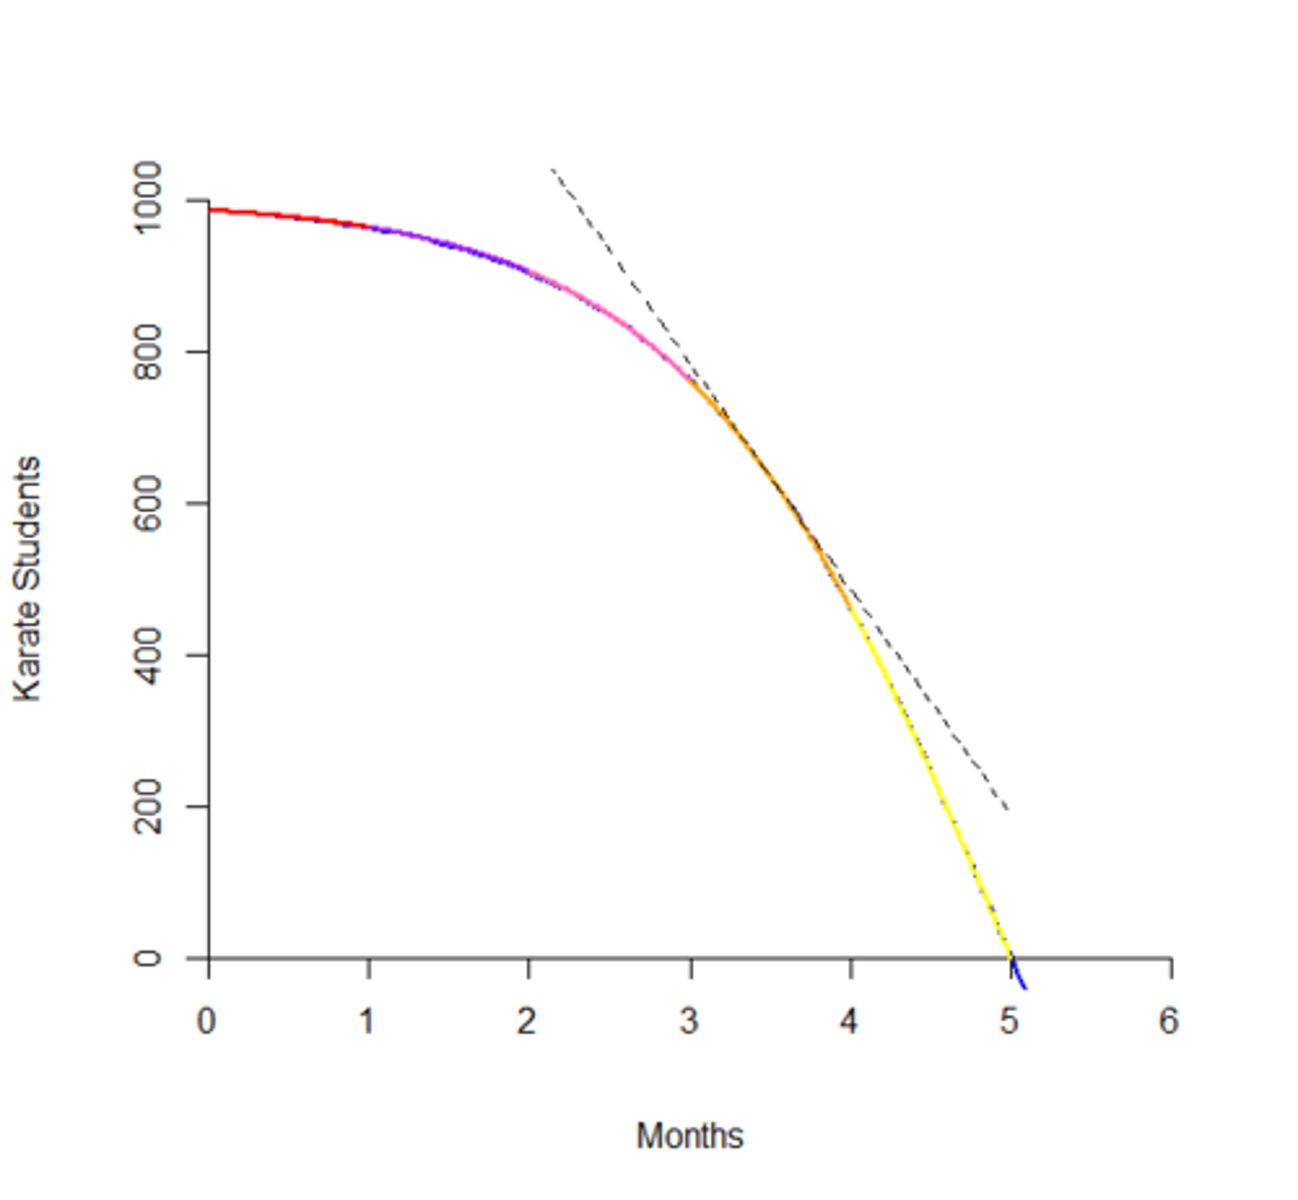
Concave up
the rate of change is increasing
Concave down
The rate of change is decreasing
Zeros of a function
Same as x- intercepts, roots, solutions to equations
x-axis
the horizontal axis on a coordinate plane
y-axis
the vertical axis on a coordinate plane
Average rate of change
slope
Constant rate of change
the rate of change in a linear relationship
Positive rate of change
as x increases, y increases
Negative rate of change
As X increases, Y decreases (falling line)
Local (relative) maximum
highest y-value in a certain interval
Local (relative) minimum
lowest y-value in a certain interval
global (absolute) maximum
the highest y-value reached on a graph
global (absolute) minimum
the lowest y-value reached on a graph
Even degree function
a function with a degree of 2, 4, 6, etc. (such as y=x^4)
Odd degree function
a function with a degree of 1, 3, 5, etc. (such as y=x^3)
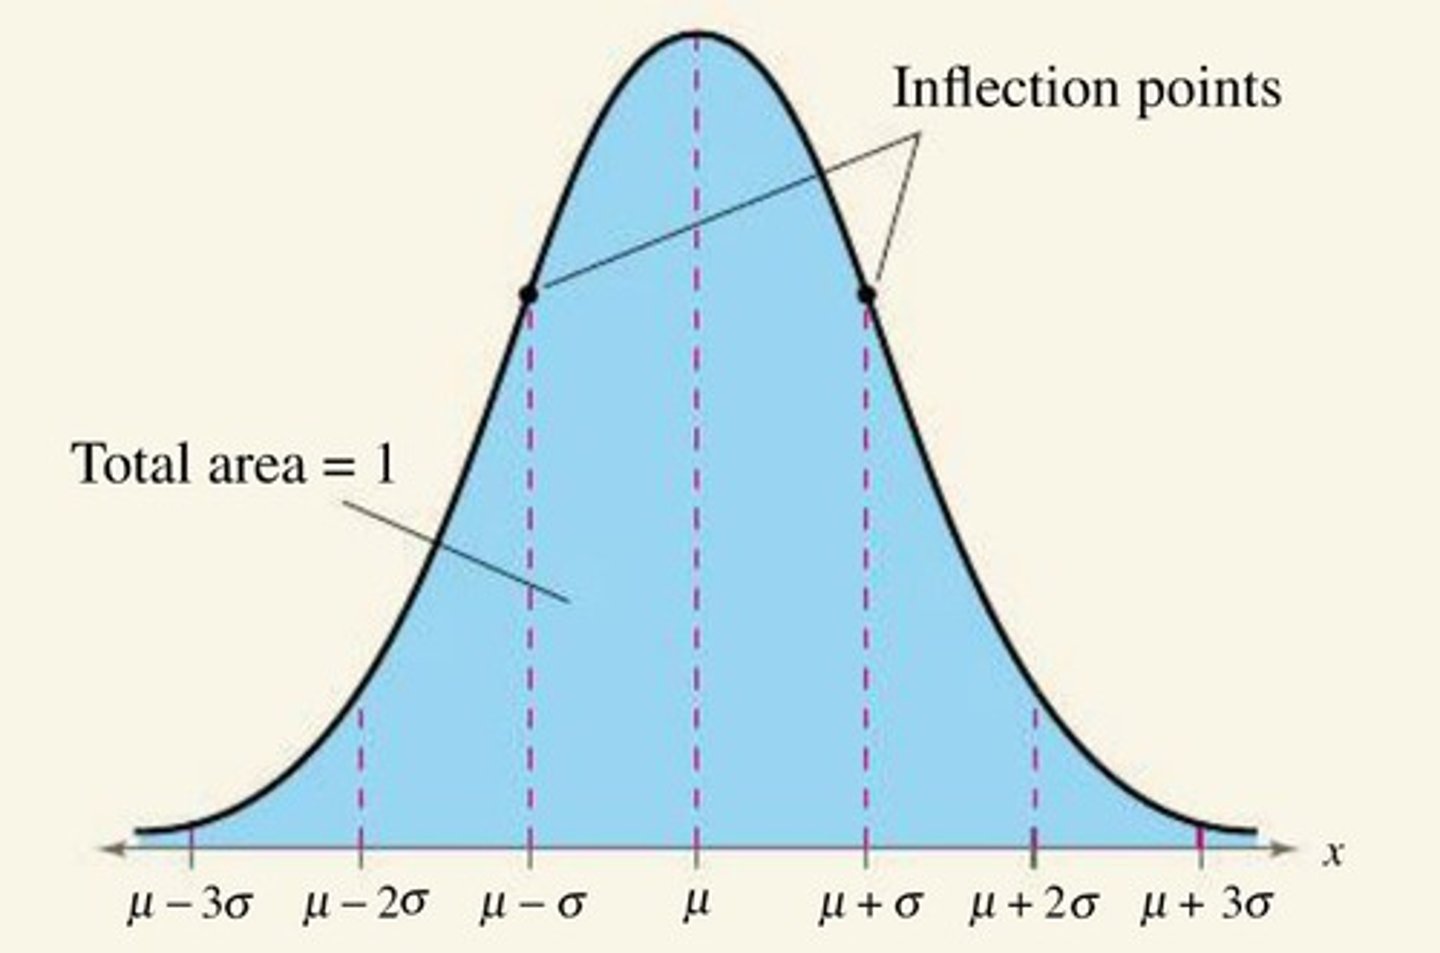
Points of Inflection
Where concavity changes from up or down or vice versa
vertical translation
An up or down slide; the y-coordinate changes.
horizontal translation
A slide to the right or left; the x-coordinate changes.
multiplicative transformation
vertical dilation
horizontal dilation
reflection
A transformation that "flips" a figure over a mirror or reflection line.
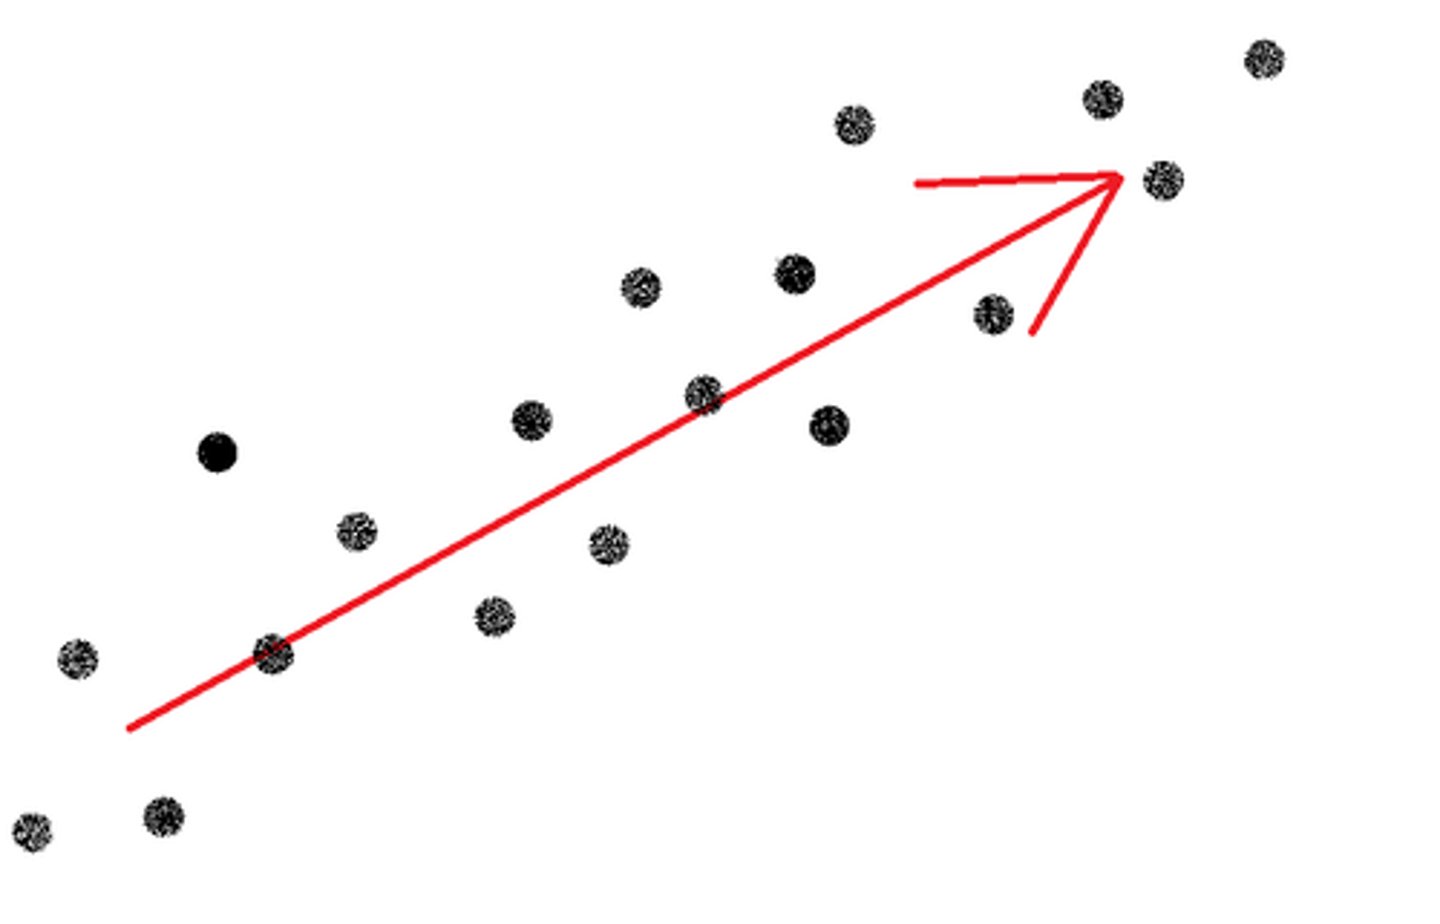
linear regression
a statistical method used to fit a linear model to a given data set
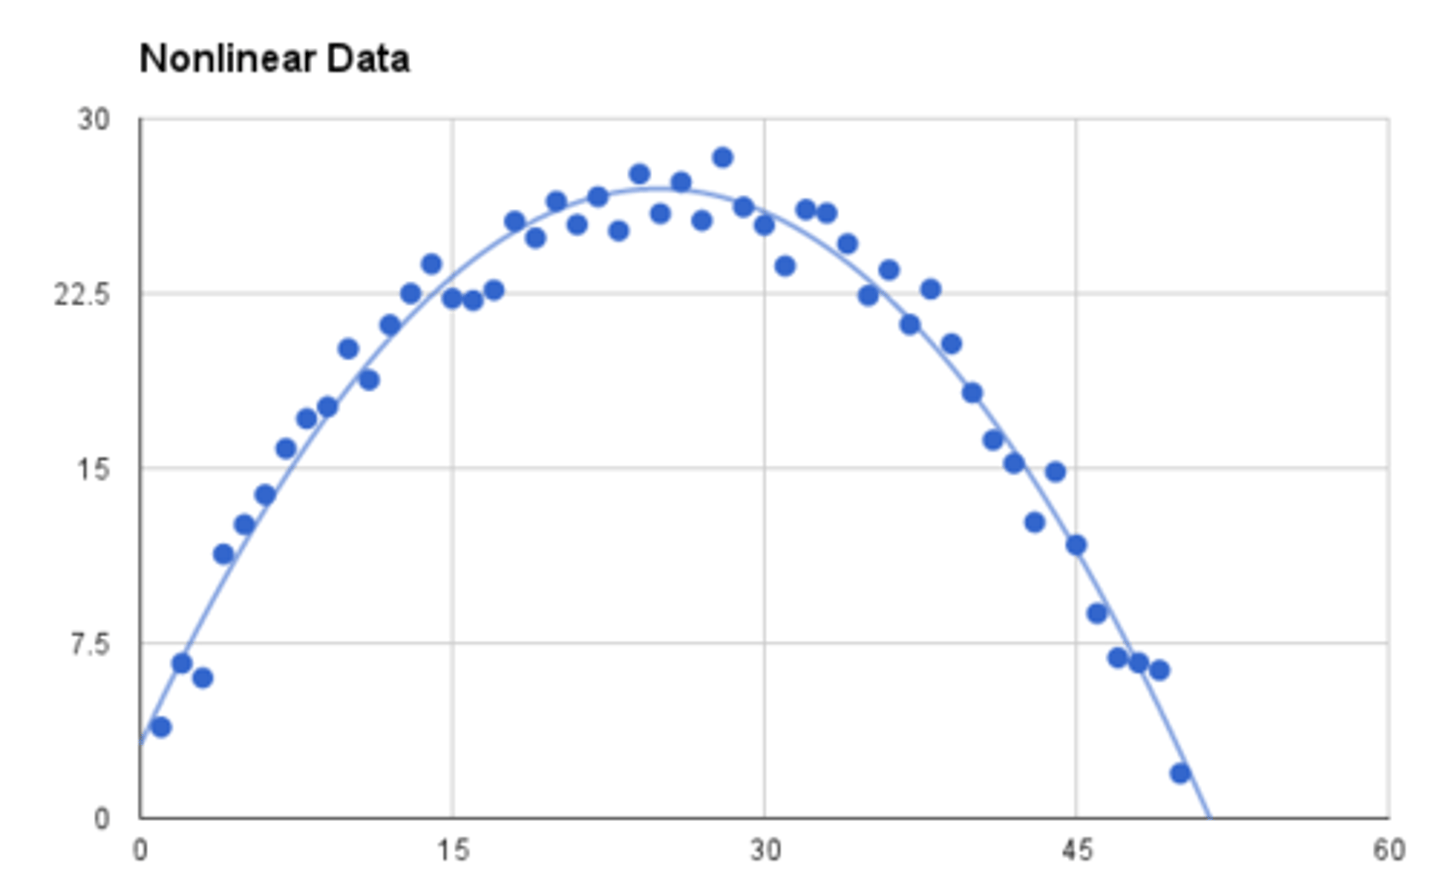
quadratic regression
A statistical method used to fit a quadratic model to a given data set.
Limit Notation
composite function
identify function
inverse function
a function that "undoes" what the original function does
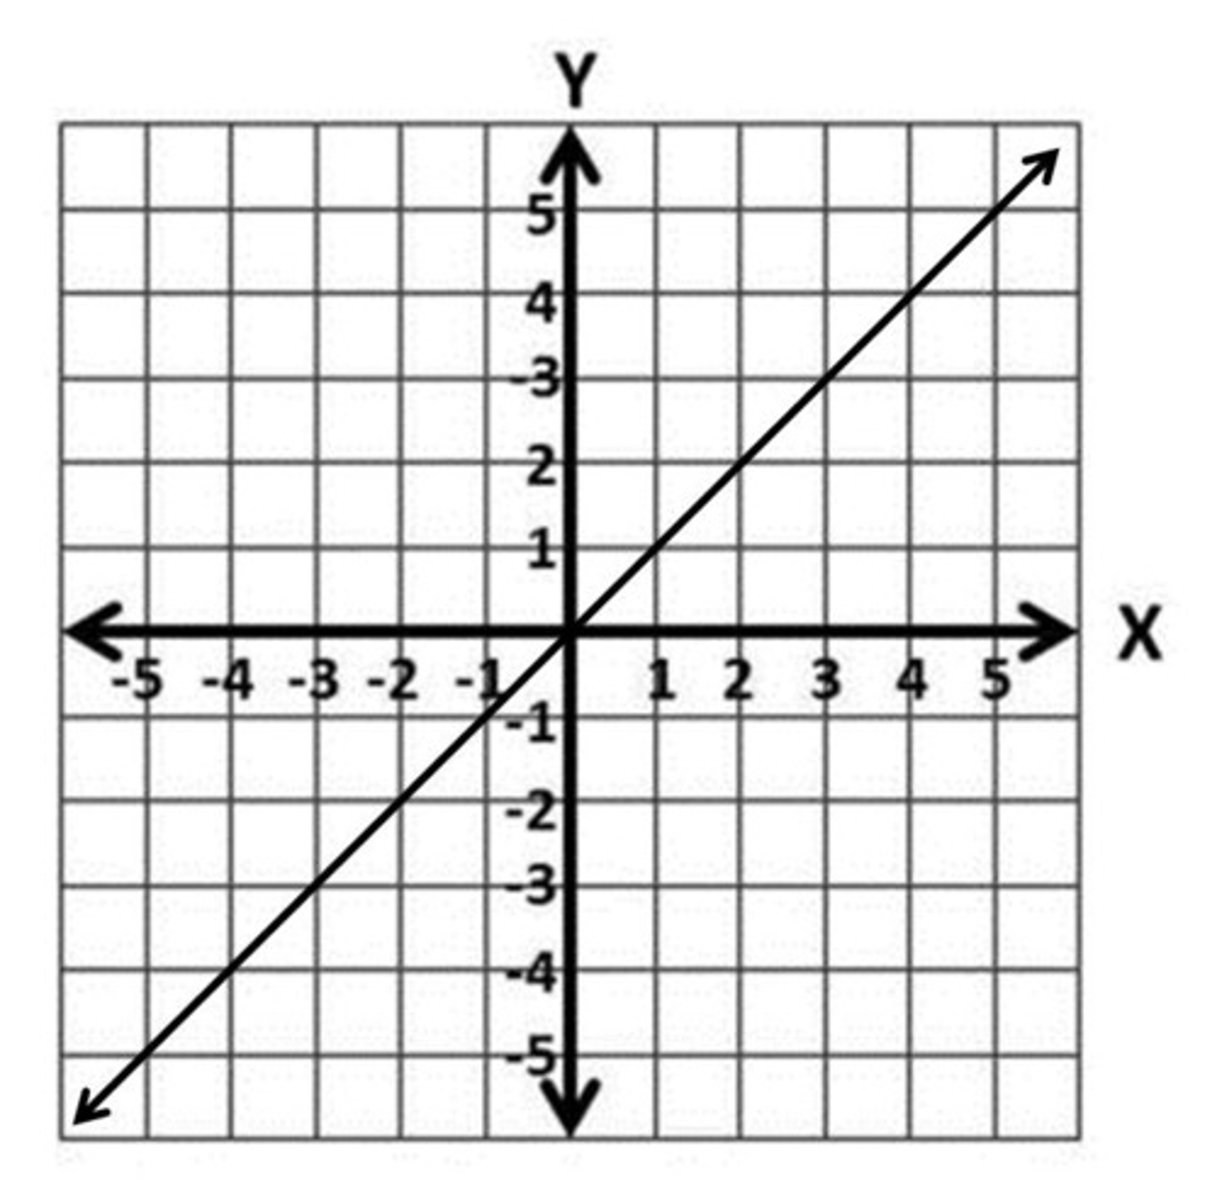
linear function
A function whose graph is a straight line.
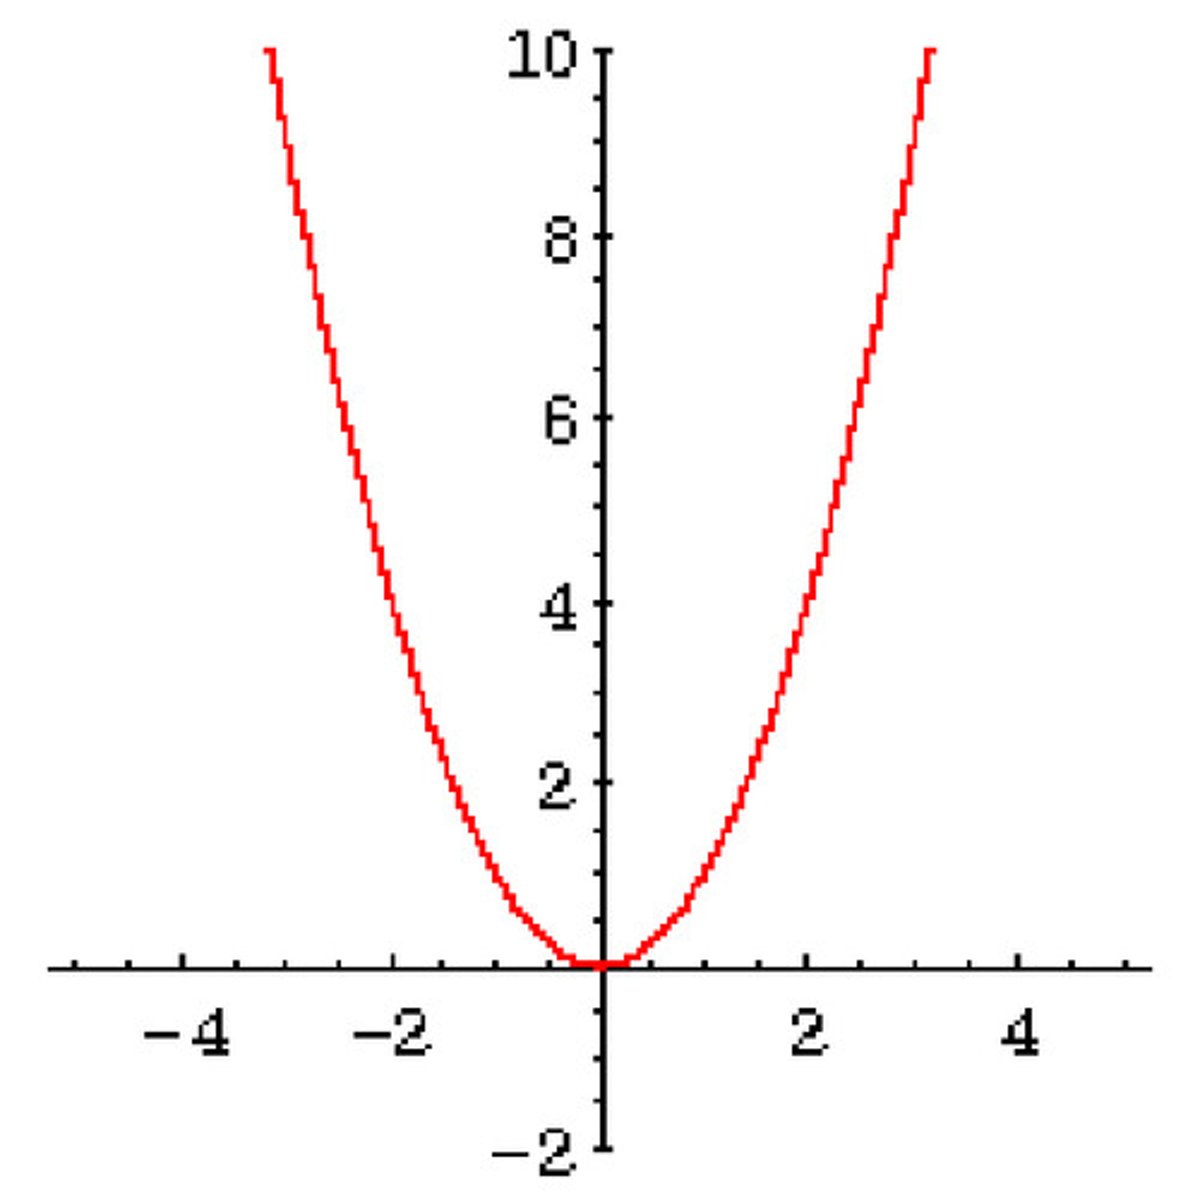
quadratic function
A function in which the greatest power of the variable is 2.
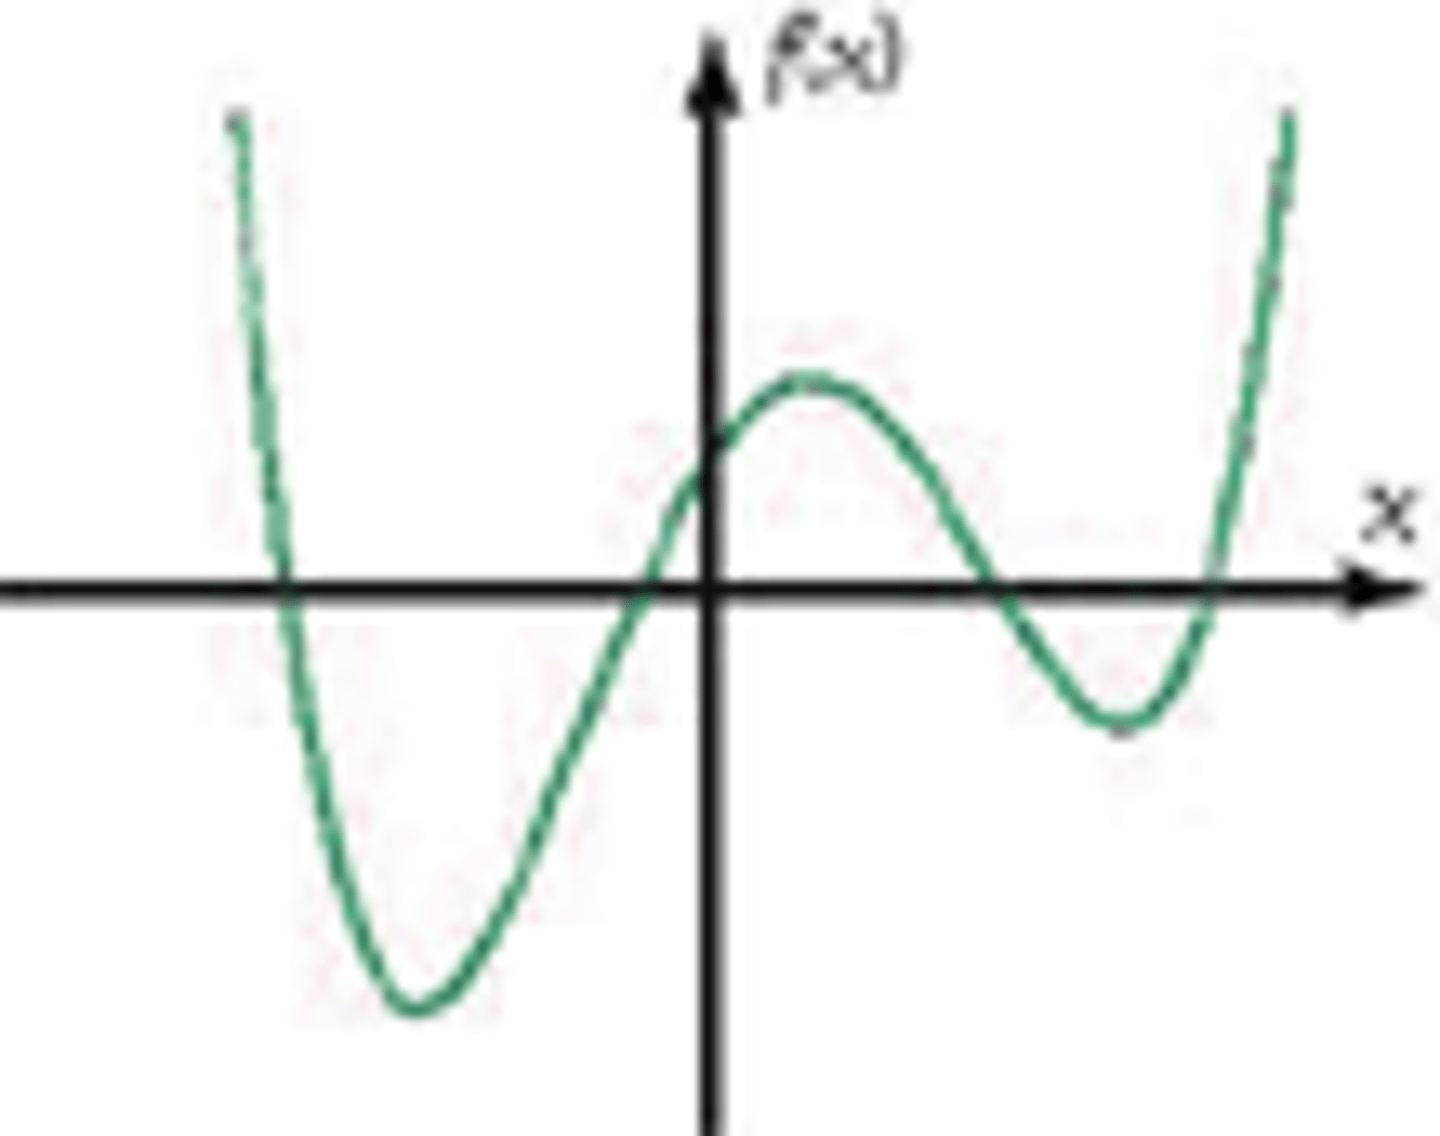
Polynomial function
a continuous function that can be described by a polynomial equation in one variable
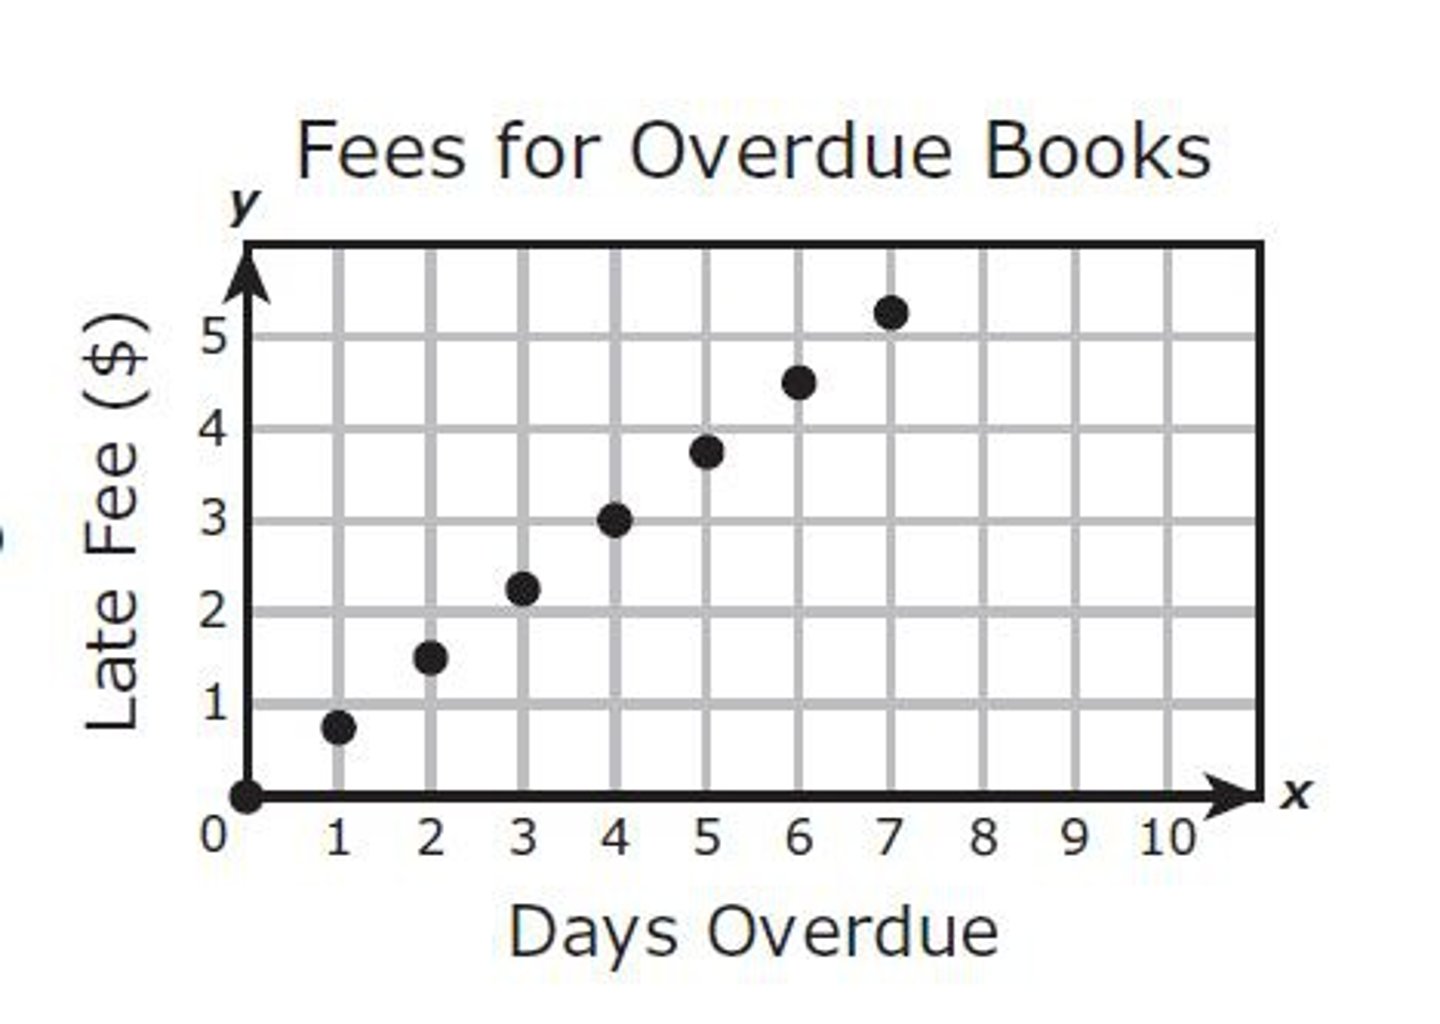
discrete function
a function of points that are not connected
continuous function
a function that can be graphed with a line or a smooth curve
