Cancer final
1/38
There's no tags or description
Looks like no tags are added yet.
Name | Mastery | Learn | Test | Matching | Spaced |
|---|
No study sessions yet.
39 Terms
Senescence/crisis/telomeres
Senescence and crisis (covered in chap. 10)
Senescence = cell in non-growing state, but viable
Crisis = apoptotic death of cells
Erosion of telomeres leads to chromosomal fusions, karyotype chaos and cell death
Cancer cells escape crisis by finding ways to regenerate their telomeres --- this leads to immortalization, prerequisite for the development of cancer
Cancer incidence/development
Cancer incidence at various ages
Epidemiological data indicating that the process of tumor formation generally requires decades to reach completion
Autopsies reveal that at life’s end 60-70% of individuals carry undiagnosed tumors, independent of the cause of death
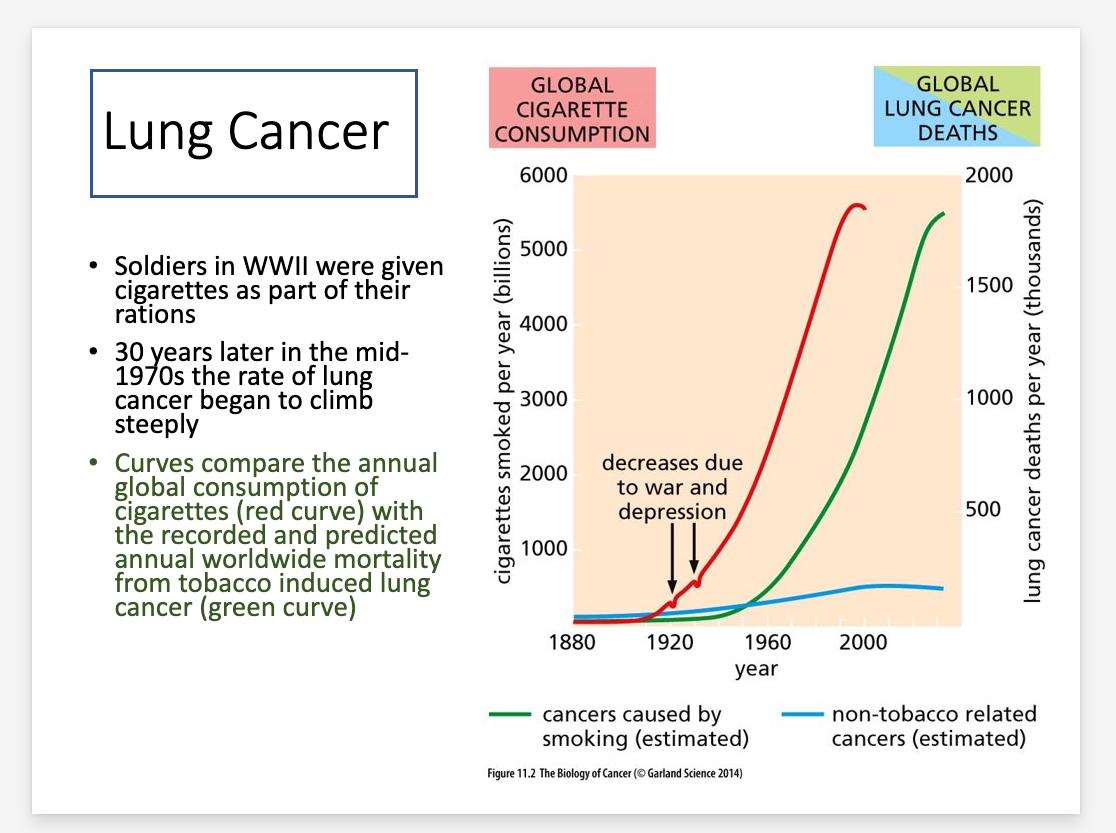
Lung cancer development
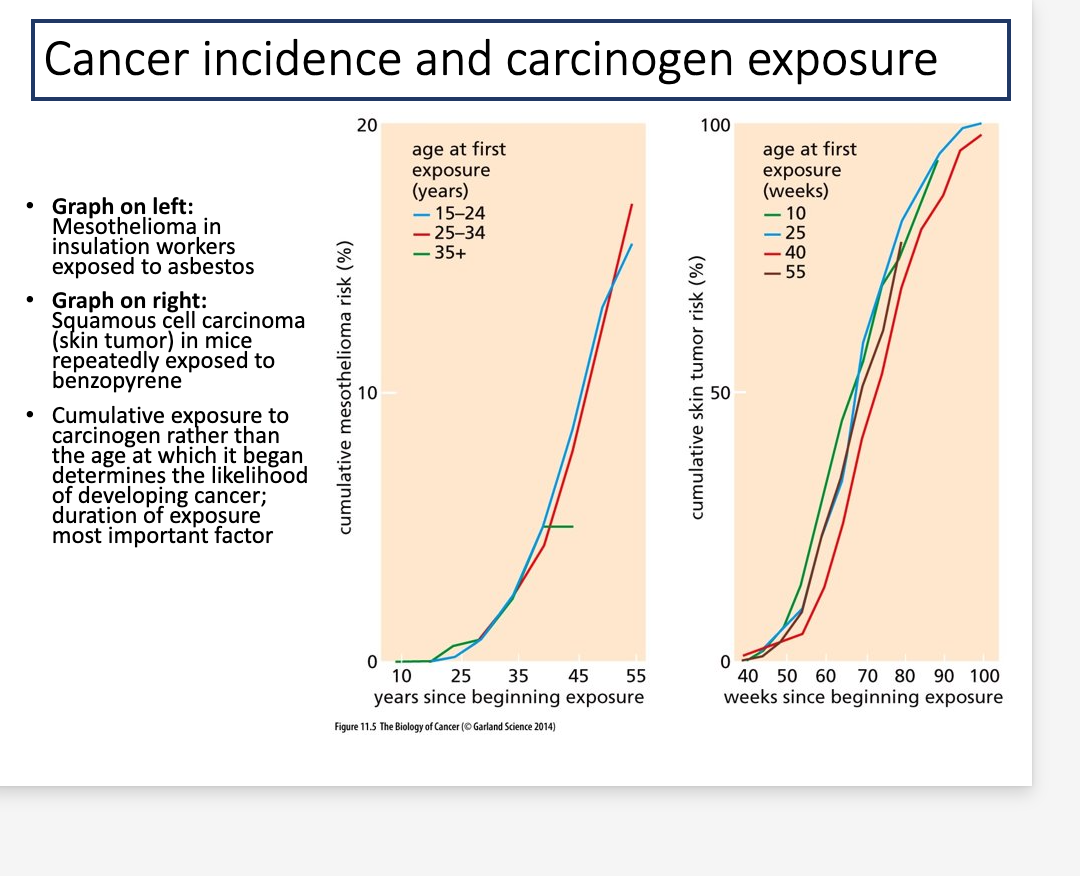
Cancer incidence and carcinogenic exposure
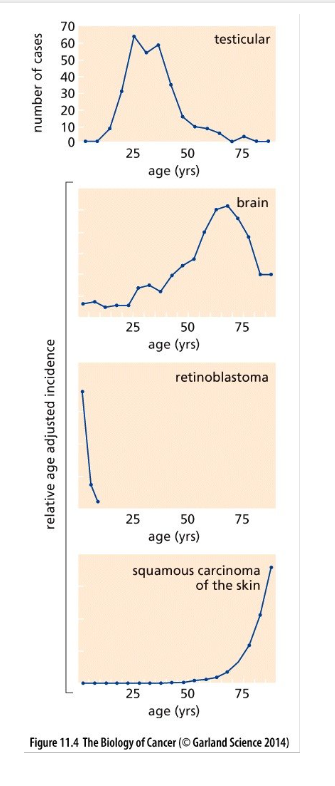
Cancer incidence-age
The age-dependent incidence rates of certain cancers differ dramatically from typical adult cancers
Certain cancers clearly violate the trend shown in the previous figure
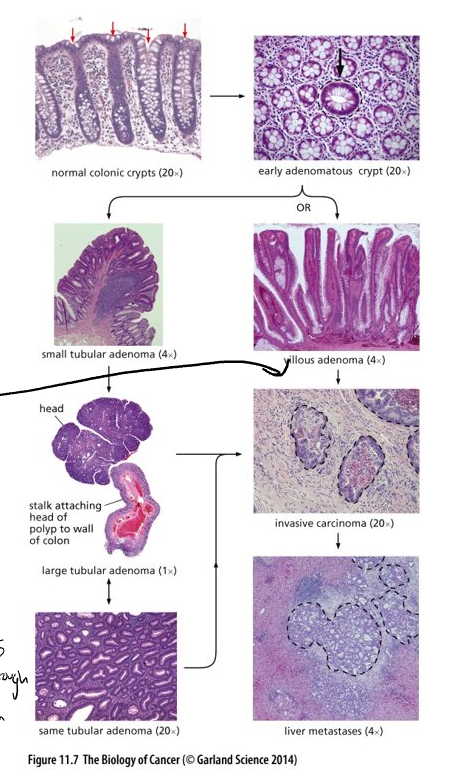
Histopathological evidence in multi-step tumor formation
Tumor development as a multi-step process has been clearly documented in the epithelia of the intestine
Epithelial cells are anchored by a basement membrane; beneath the membrane, stroma
Stroma consists of mesenchymal cells – mostly fibroblast cells
Histopathological alterations of human coma
Top right – cross section through crypts – arrow marks an adenomatous crypt; others normal
Cells of the abnormal crypt can develop into two distinct types of adenomas, tubular and villous
Adenomas have the potential to develop into a locally invasive carcinoma (circled with black dotted line)
Tumor considered benign if it hasn’t broken through the basement membrane and invaded the stroma
Dissemination of these cells, usually to the liver, can lead to metastases (circled)
Hyperplastic
increase in number of cells in tissue
Dysplastic
abnormal cell presence
Polyp
benign growths in colon
Adenoma
growth that is not cancer that starts in gland cells of epithelial tissue-polyps
Carcinoma
Severe proliferation of cells of a cancer phenotype
Tumorigenesis in various organ sites
Succession depicted in previous figure is not always followed; i.e. some tumors skip steps or tumors never develop from intermediates like adenomas
Panel (A): tumorigenesis similar in other tumors; nomenclature is different
Panel (B): On rare occasions a tissue displaying multiple stages of cancer progression co-existing can be found
CIS- carcinoma in situ
DCIS- ductal carcinoma in situ
In situ- in the same place where the tumor first formed
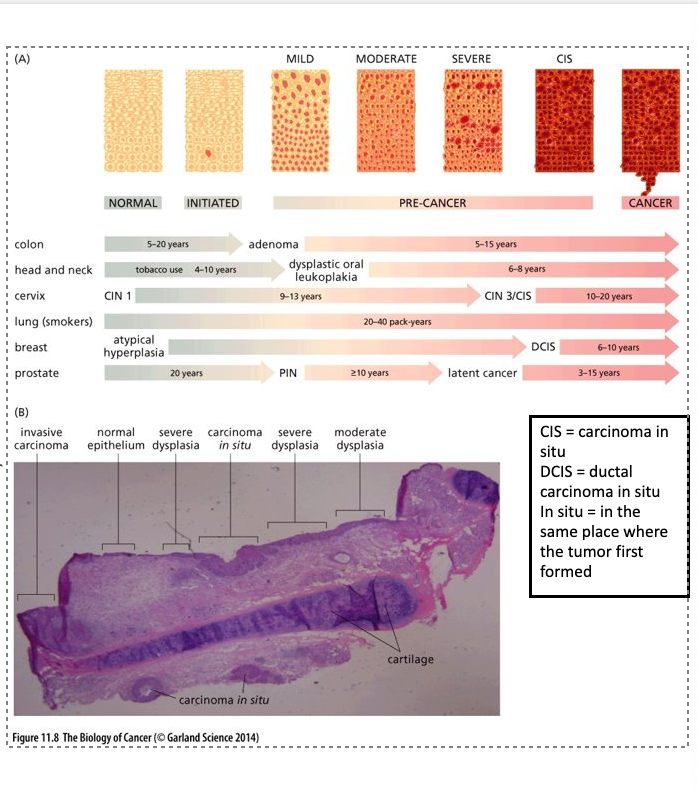
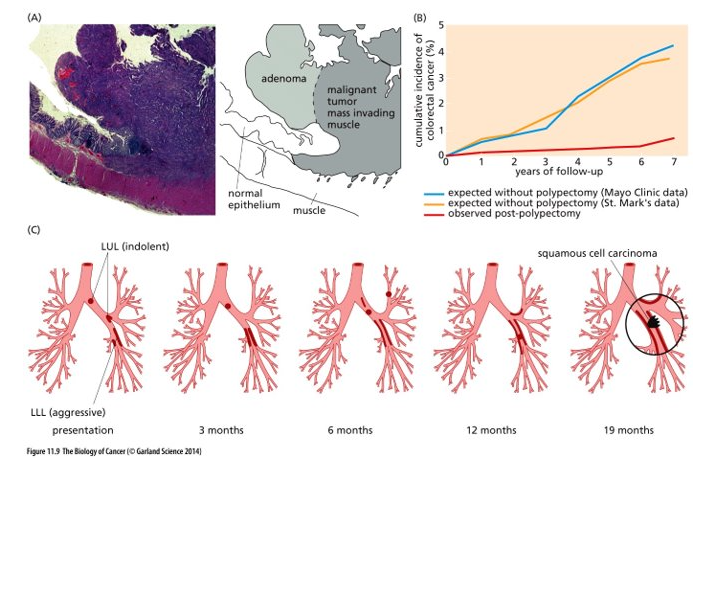
Evidence for adenoma to carcinoma progression
(A) carcinoma growing directly out of an adenoma
(B) Patients who had polyps removed (polypectomy), significant decrease in the diagnosis of colorectal cancers
(C) Longitudinal studies in the same patient are possible and easier in certain organs
3 pre-malignant carcinomas (in situ)were detected
By 19 months the lesion on the left lower lobe (LLL) developed into a squamous cell carcinoma; others were no longer detected
3 initial lesions had the same rare p53 mutation; this was also detected in the carcinoma
In situ
causing little to no pain
Aggressive
tumor that grows/forms quickly
Genetic and epignetic changes during tumor progression
Genetic alterations drive phenotypic changes observed histologically (genetic evolution and phenotypic progression)
Colon Carcinomas easy to study and high incidence – know most about them
q= long arm; p=short arm
Fig. 11.11
LOH Chr. 5q = loss of APC
LOH Chr. 17p = loss of p53
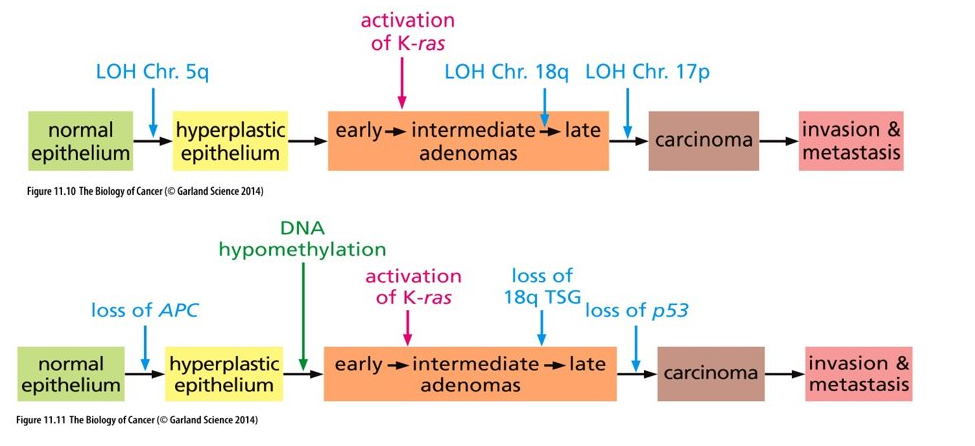
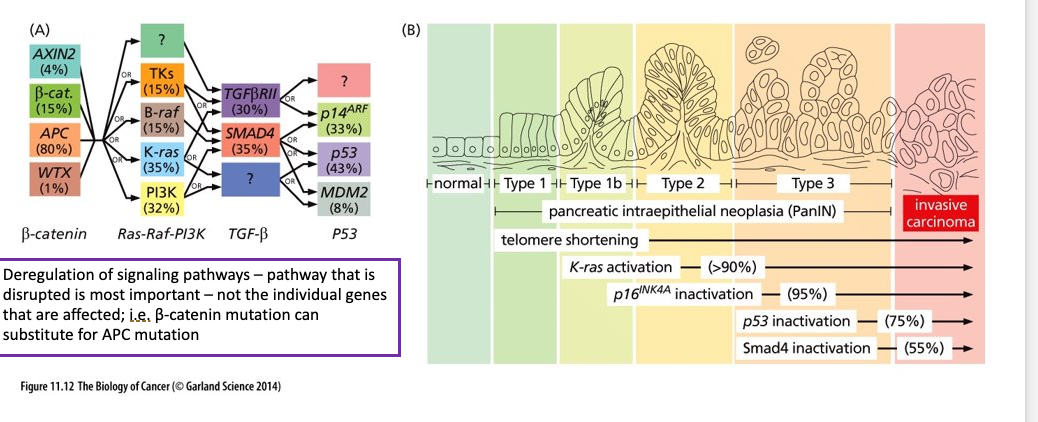
More realistic view of genetic alterations acquired as tumor formation
(A) In reality, not all colorectal cancers follow the straight path depicted in Fig. 11.11
Greater than 80% of colon carcinomas show inactivation of APC early on
Only about 35% of colon carcinomas acquire a K-Ras mutation
Tumors with K-Ras mutations rarely have p53 mutations
(B) Pancreas Adenocarcinoma - orderly succession of genetic and epigenetic changes
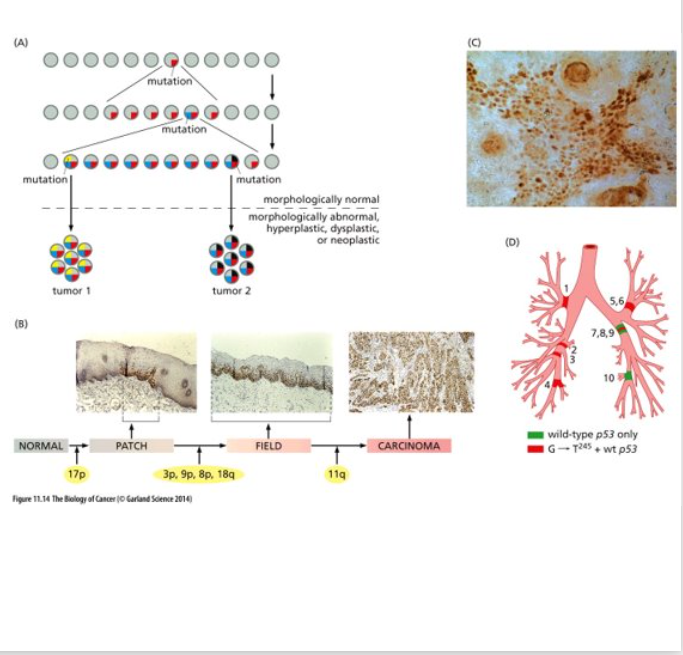
Field Characterization
Large area of histologically normal but genetically altered epithelium can sprout multiple, seemingly independent foci of neoplastic cells all of which carry the mutations common to this area as well as subsequently acquired mutants that are unique to each focus
(A) represents one model of field cancerization = occurrence of genetic and epigenetic alterations in histologically normal- appearing tissues -- leads to an increased risk for the development of tumors; the presence of cells with genetic mutations adjacent to the tumor
(B) p53 mutant cells are detected in normal patches of the oral epithelium, as tumor progression continues larger fields can be found (still histologically normal) (yellow indicates LOH); several fields progress into carcinomas (last panel)
(C) p53 mutated keratinocytes found in sun exposed human skin – histologically normal
(D) Post-mortem analysis of presence of p53 mutations (same rare somatic mutation); widespread in the lung, carcinoma did not develop in this case
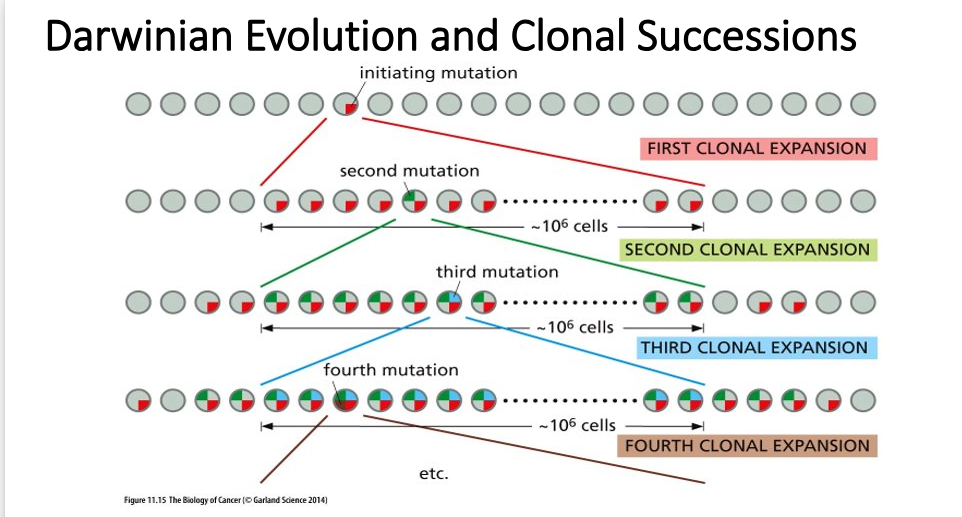
Darwinian Evolution
This is a simplistic view based on Natural Selection and Darwin’s theory of evolution – evolving units = individual cells
doesn’t include epigenetic changes like DNA methylation
As tumor progression proceeds the genomes of tumor cells become increasingly unstable; the rate at which mutant alleles are generated exceeds the rate of natural selection
Different clonal populations from the same tumor differ markedly in their rates of proliferation, susceptibility to apoptosis, tendency to metastasize, etc.
Experiments demonstrate that tumors are heterogenous – some experiments demonstrate that the tumorigenic cell population only accounts for 2% of the total neoplastic cell population
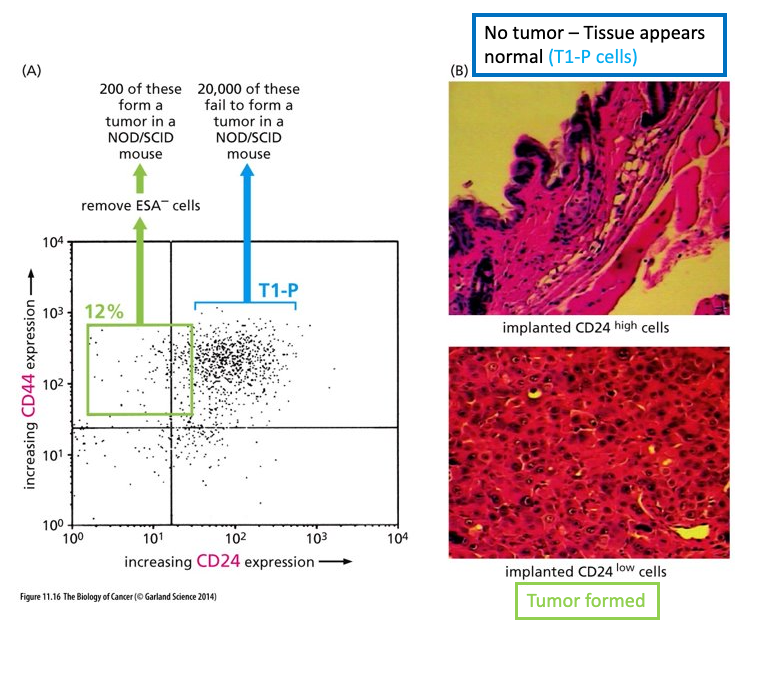
Enrichment of breast cancer stem cells
Cells derived from a breast cancer carcinoma and sorted using Flow Cytometry (FACS)
Note 2 separate sub populations marked in green and in blue
When 200 of cells from the green box were implanted into a mouse – tumor formed -- Call these Cancer Stem Cells (CSCs); resistant to chemotherapy treatments
When 20,000 of cells in blue box were implanted into a mouse – tumor did not form
Majority of cells in tumor display a more normal cell phenotype
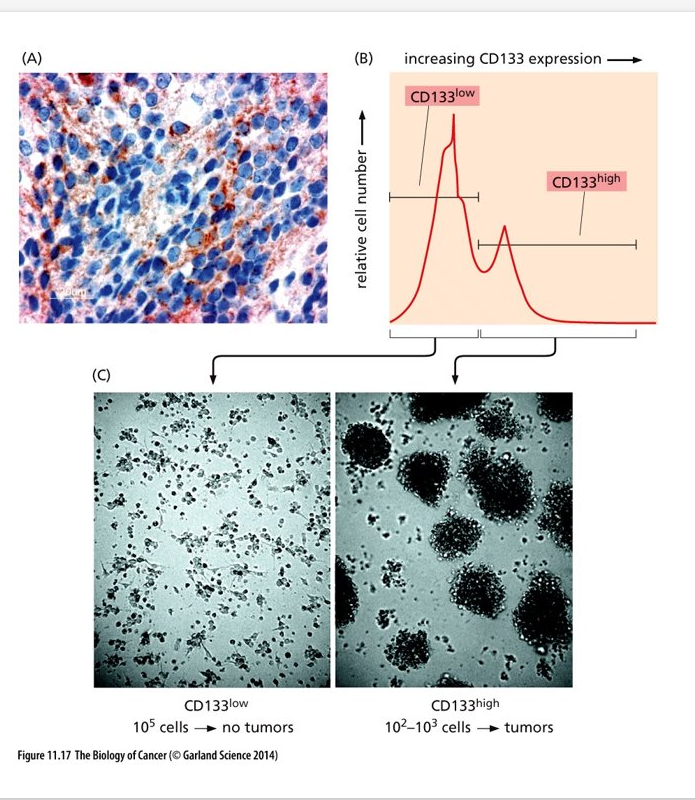
Enrichmnet if brain tumor stem cells
(A) Medulloblastoma cells showing areas of high level of CD133 (dark red) expression and areas of low levels of expression
(B) Cells derived from a human medulloblastoma sorted by FACS; shows 2 different subpopulations
(C) one population forms tumors in culture, the other does not
CD 133 – marker used to identify neural stem cells
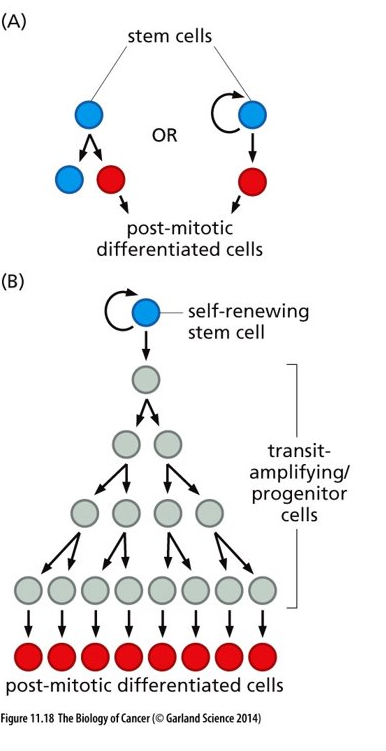
Stem Cells and progeny
Tumors seem to have a similar organization as what is shown in this figure
Blue stem cells shown here are similar to cancer stem cells (CSCs) in a tumor
Transit amplifying/progenitor cells will divide a finite amount of times and then differentiate and become post-mitotic – cells similar to these exist in a tumor
Cells similar to transit amplifying/progenitor cells respond to chemotherapies while cancer stem cells do not respond well
Metastasis
malignant tumor derived from a priamry tumor, located at second site from the primary tumor cite. Cancer cells leave primary mass and enter blood and lymphatic vessels
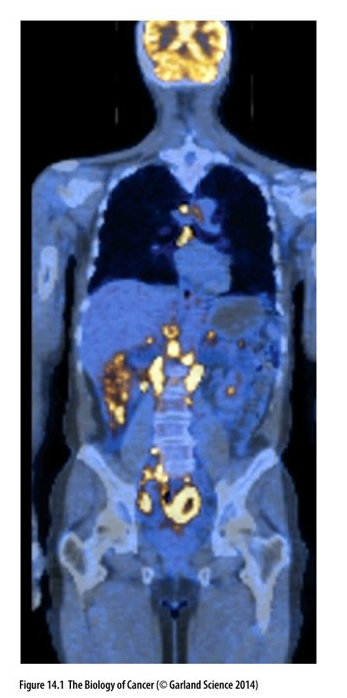
PET scan
Whole body scan of patient with non-Hodgkin’s lymphoma (NHL)
CT scan – Blue and PET scan
(fluorodeoxyglucose, FDG) - yellow indicates areas of the body where the uptake of glucose is significantly increased; indicate metastases
Increased activity in the brain is normal
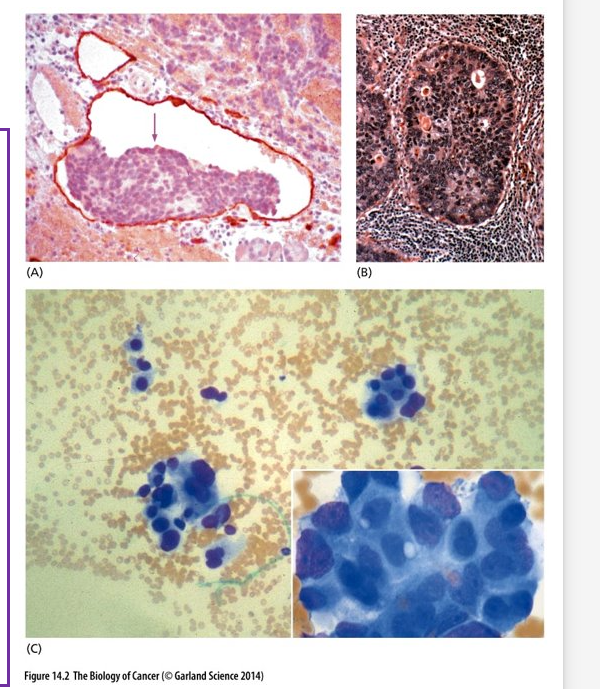
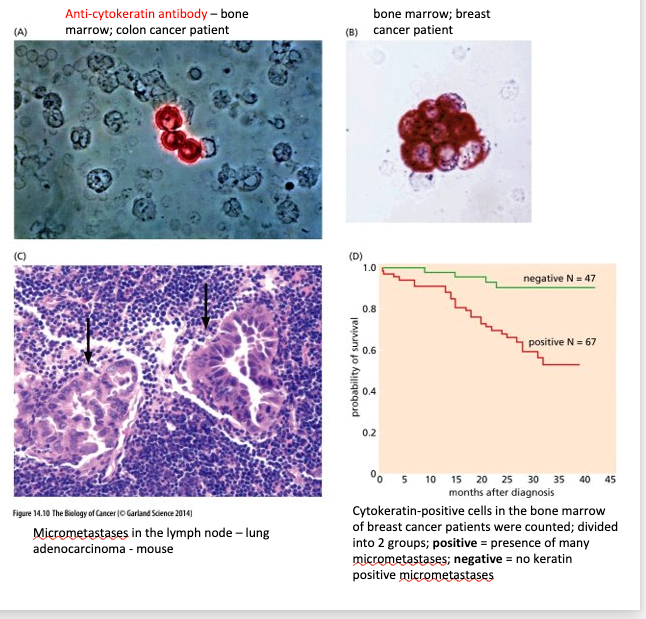
Histology of metastases in tissues
(A) Pancreatic Islet cell metastases in a lymphatic vessel (outlined in red)
(B) Breast cancer growing within a lymph node
(C) Clumps of carcinoma cells in the bone marrow
Certain cancers take on specific metastatic paths
Breast Cancers – brain, liver, bones, lungs
Prostate Cancer – Bones
Colon Cancer – Liver
Tumors of certain tissues have a high probability of metastasizing and some never metastasize
Primary melanomas of the skin almost always metastasize
Basal cell carcinomas rarely metastasize
We still do not fully understand the mechanisms underlying invasion and metastasis
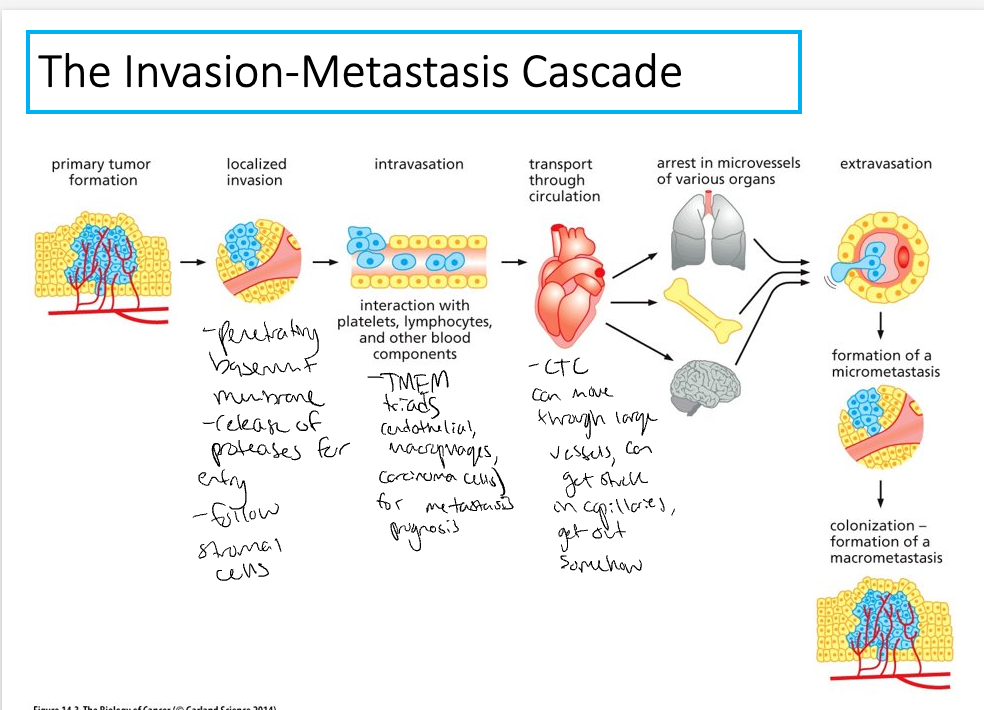
Invasion-Metastasis cascade
7 distinct steps
Localized invasion – carcinoma cells breach the basement membrane
Small probability of completing all of these steps – low likelihood of a single cancer cell leaving the primary tumor and founding another tumor at a distant site
Adapted from I.J. Fidlerm Nat.Rev. Cancer 3:453-458, 2003
> 80% of life threatening cancers are carcinomas – focus of this information

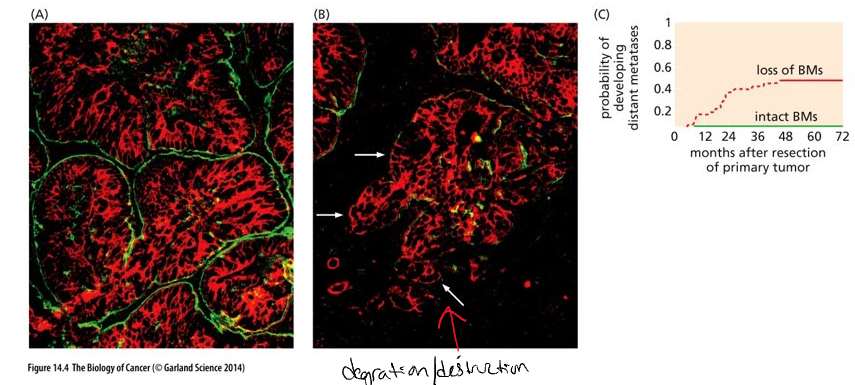
Breaching of basement membrane
Carcinomas begin on the epithelial side of the basement membrane (benign if they remain here)
Basement membrane = specialized extra cellular matrix composed of proteins secreted by both stromal and epithelial cells
Stroma is composed of connective tissue (fibroblast cells), blood vessels, lymphatic vessels and nerves
(Panels A and B) Green = basement membrane (BM); red = carcinoma cells; black = stroma
(A) – less aggressive
(B) – more aggressive – loss of BM at white arrows
(C) Loss of BM around tumor islands correlates with development metastases 5 years after removal of primary tumors
Invasion of stroma
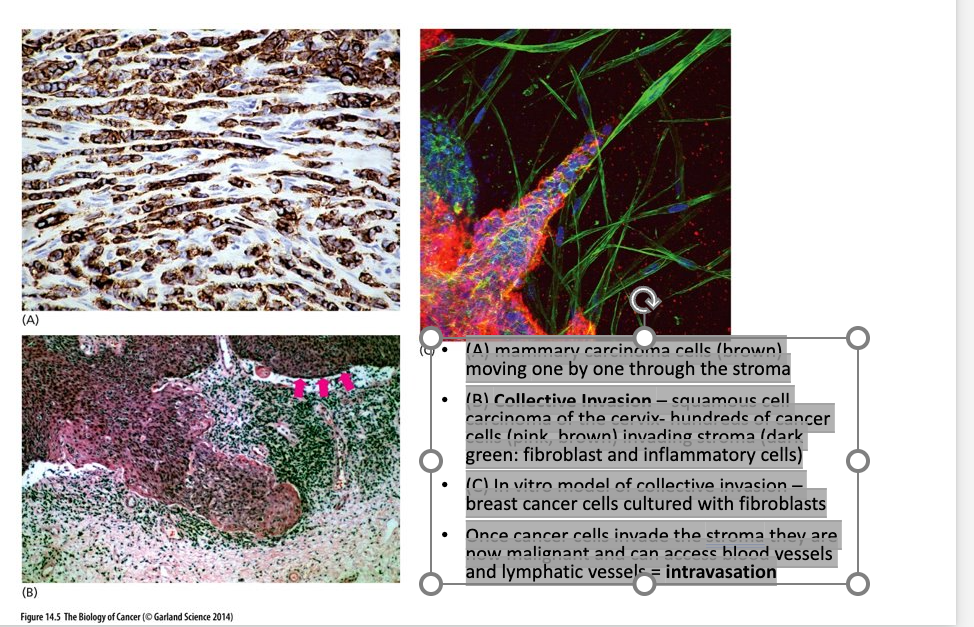
(A) mammary carcinoma cells (brown) moving one by one through the stroma
(B) Collective Invasion – squamous cell carcinoma of the cervix- hundreds of cancer cells (pink, brown) invading stroma (dark green: fibroblast and inflammatory cells)
(C) In vitro model of collective invasion – breast cancer cells cultured with fibroblasts
Once cancer cells invade the stroma they are now malignant and can access blood vessels and lymphatic vessels = intravasation
Invasion- EMT
(A) Cancer cells release proteases which remodel the ECM (degrade proteins in the BM)
ECM = blue
Black indicates areas where the ECM has been degraded
Red = adherens junctions (E-cadherin) that enable cancer cells to adhere to one another
White arrow = leading edge where cancer cells are expressing integrins (green) which allow them to attach to the still intact ECM
Cancer cells can make and secrete their own proteases or induce stromal cells to release them
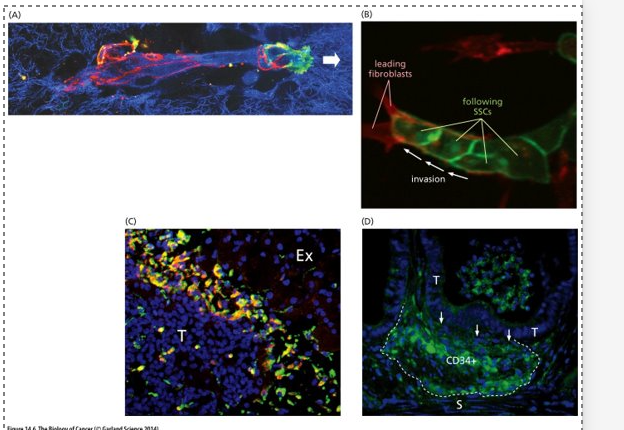
(B) cancer cells following stromal cells (fibroblasts) making a path for them
(C) Cancer cells recruit macrophages (green) and induce them to release proteases
(D) mouse model of intestinal carcinogenesis – recruitment of immature myeloid cells (CD34+) that will secrete proteases
The epithelial-mesenchymal transition (EMT)
To acquire motility and invasiveness the carcinoma cells must shed their epithelial phenotype and undergo a drastic alteration --- EMT
This requires a transcriptional program more characteristic of mesenchymal cells – involves coordinated expression of hundreds of genes and the production of new proteins
This does happen normally during developmental morphogenesis and during wound healing – carcinoma cells tap into these cellular programs – key feature of metastasis
Intravasation
Intravasation = invasion of cancer cells into blood and lymphatic vessels
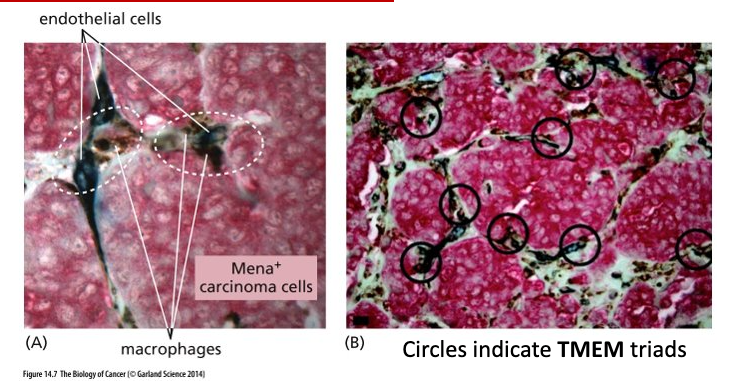
Carcinoma cells, macrophages and endothelial (line blood vessels and regulate exchanges between blood and surrounding tissues) cells work together to accomplish intravasation
TMEM – Tumor microenvironment of metastasis
Counting TMEM triads is a good prognostic marker for metastasis
Circulating Tumor cells
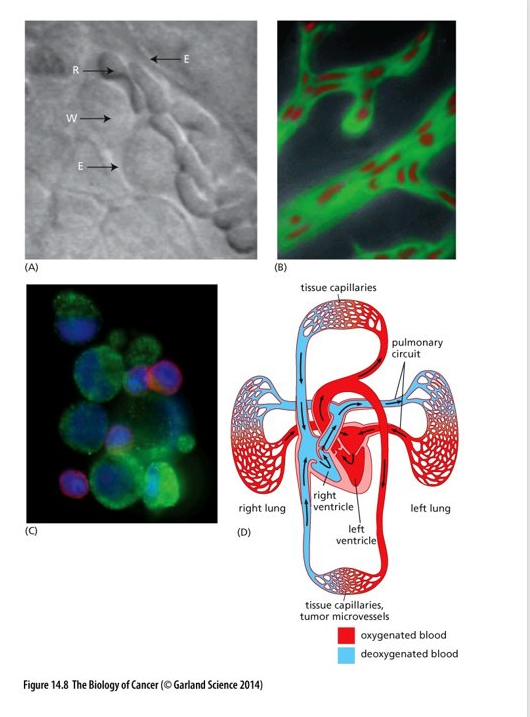
May persist for only a short time in circulation – unlike red blood cells and white blood cells they are not able to pass through many microvessels (capillaries to small)
Most get trapped in lung capillary beds
Possibility that some find a way to circumvent capillaries
(A) E = capillary wall; W = leukocyte; R = erythrocyte
(B) notice how the erythrocytes are deformed to be able to move through the vessel
(C) CTCs often found in aggregates
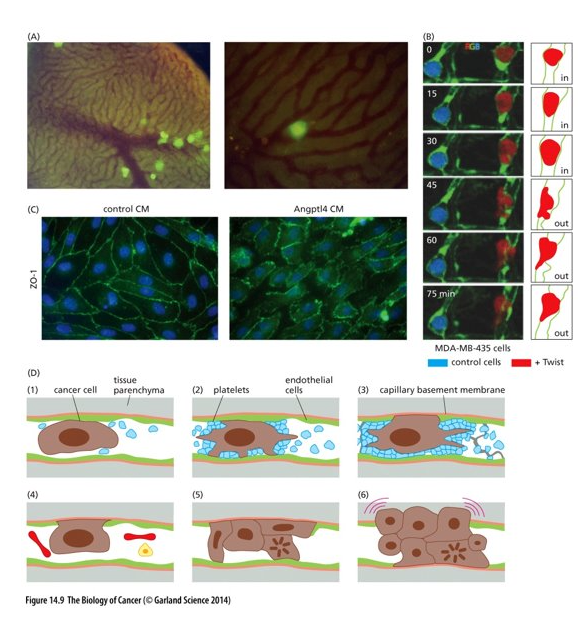
Extravasation
Next, cancer cells must exit the blood vessel and enter the surrounding tissue = extravasation
Involves complex interactions between the cancer cell and the walls of the vessel
(A) tumorigenic GFP labelled cells were injected into the portal vein (liver) of a mouse
(B) breast cancer cells injected into zebrafish; green = capillary walls
Control cells (blue) unable to cross capillary wall; red cancer cell crosses through
(C) Angptl4 = angiopoietin-like protein 4 secreted by cancer cells induces endothelial cells to retract from one another and create gaps in the vessel walls (CM = conditioned culture media with Angptl4
(D) – cancer cells can proliferate in the blood vessel and create a small tumor that grows and destroys the vessel wall – then able to enter the tissue parenchyma
overview
Micrometastases and colonization
Once cancer cells enter the parenchyma –may form micrometastases = small clumps of disseminated cancer cells, some are able to expand to clinically detectable masses = colonization (most complex and challenging step)
New tissue environment does not provide the cancer cells with the collection of familiar growth and survival factors that they encountered at the primary site.
Able to detect micrometastases with specific antibodies
The probability of an individual cancer cell completing all of the steps of the invasion-metastasis cascade is very low.
Colonization = the rate-limiting step
Micrometastases may persist for extended amounts of time in a dormant state
Primary tumors, metastatic tropisms
Th idea or theory that cancer cells preferably spread to specific areas of the body to specific cancer types
The pre-metastatic niche (PMN), a concept devised by Kaplan and colleagues in 2005, corresponds to a tissue microenvironment that provides support and the necessary conditions for the survival and proliferation of tumor cells (9). In contrast to the previous idea that distant organs were passively receptive to metastatic cells, numerous studies have suggested the existence of a tumor secretome, which produces factors, including hormones, chemokines, growth factors, and extracellular vesicles (EVs) that are secreted into the circulation, leading to the preconditioning of the future metastatic site (10–12).
Tumor cells produce antigens, known as tumor-associated antigens, which ideally should be recognized by the immune system. Like all other nucleated cells, tumor cells, present their antigens to Cluster of Differentiation 8 positive (CD8+) T lymphocytes via Major Histocompatibility Complex class I (MHC-I) molecules. Professional antigen presenting cells (APCs), like dendritic cells (DCs), capture tumor-associated antigens. DCs become activated, migrate to secondary lymphoid organs and present tumor-associated antigens on MHC-I and MHC-II molecules to CD8+ and CD4+ T cells, respectively. If T cells are sufficiently activated by DCs, they migrate to the tumor tissue and initiate cancer cell death upon recognizing their target antigen (22).
Various preclinical and clinical findings substantiate the theory that the immune system regulates certain tumors. For instance, mice deficient in B and T cells exhibit a higher occurrence and accelerated growth of induced tumors (24, 25). Correlational studies have demonstrated a link between T cell tumor infiltration and patient survival across various cancer types, such as breast, ovarian, and colorectal cancers (26–28). Clinical and experimental observations suggest that the adaptive immune system inhibits metastasis formation. For example, the depletion of CD8+ T cells resulted in increased lung and reproductive tract metastases in a melanoma mouse model (29). Effective immune surveillance has the potential to eliminate tumor cells. However, immune responses against cancer are often compromised in individuals with cancer. Commonly, tumor cells downregulate MHC-I molecules to evade antigen presentation. Also, tumor cells upregulate the expression of immune checkpoints such as programmed death-ligand 1 (PD-L1), that usually block immune responses against self-antigens. Furthermore, tumor-derived factors are known to interfere with the maturation of DCs, inducing immature phenotypes that are less prone to activate T cell anti-tumor responses
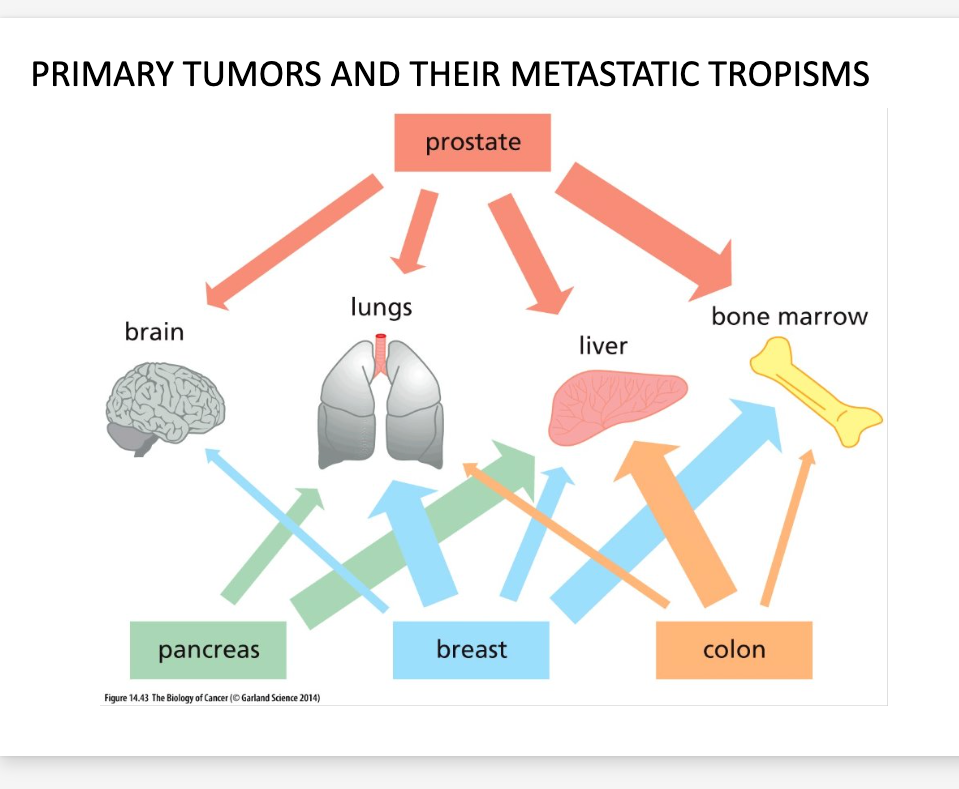
Seed vs. Soil
Seed- Intrinsic cell properties of cancer cells; established when they form primary tumor.
Soil- host micro environment (organism specific)
Target organs can release chemokines to attract tumor cells