Week 11 - Individual Differences in Motor Control, Signal Detection Theory
1/22
There's no tags or description
Looks like no tags are added yet.
Name | Mastery | Learn | Test | Matching | Spaced | Call with Kai |
|---|
No analytics yet
Send a link to your students to track their progress
23 Terms
Shams et al Sound induced flash illusions
participants view a flash on a screen and hear beeps
illusion: when two or more beeps are paired with a single flash, participants often perceive multiple flashes
Findings:
as the number of beeps increases, the perceived number of flashes also increases
temporal binding window (TBW)
refers to the period during which multisensory stimuli are integrated
data suggest a wider TBW leads to stronger illusions
Individual exerperiences with the sound-induced flash illusion
not everyone has the same TBW
some individual variations and differences in temporal binding
variations exist but they may be too small at the neurophysiological level
temporal binding window (TBW)
not consistent and differs among participants
can be identified using psychophysical methods
psychology + physics
How could we determine the perceptual threshold for someone?
staircase method:
present pairs of stimuli at decreasing time intervals until participants report perceiving them as one or two separate stimuli
randomize intervals to prevent participant bias
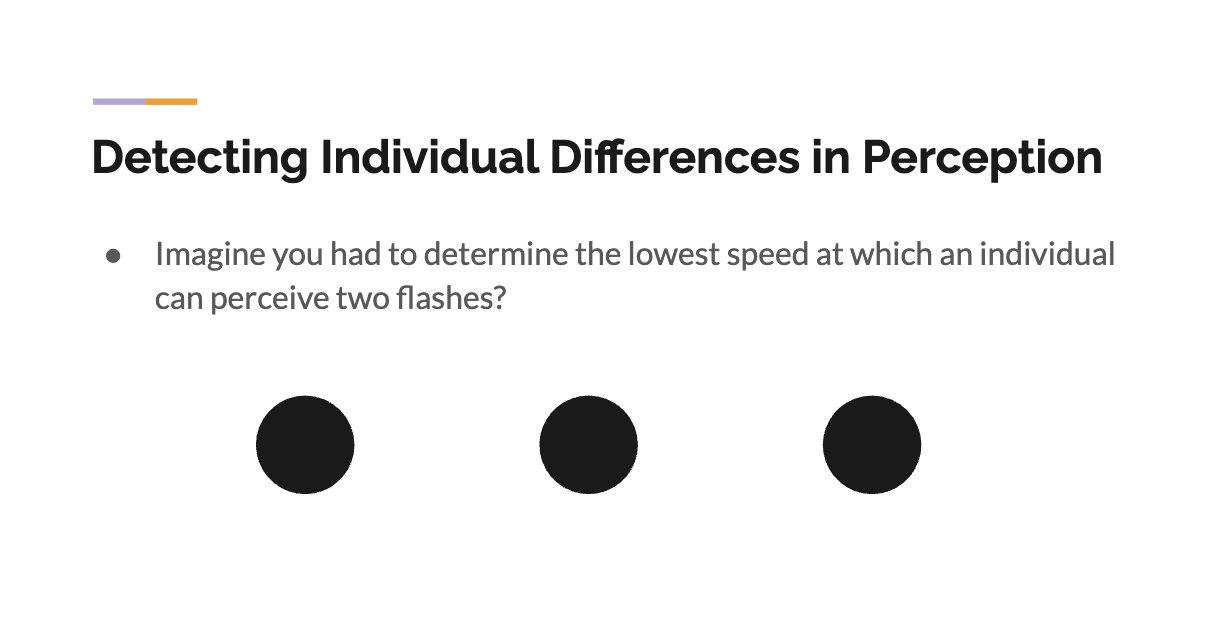
participants view visual stimuli presented in quick succession
gradually adjust the speed of presentation to find the point where they can consistently detect them as separate events
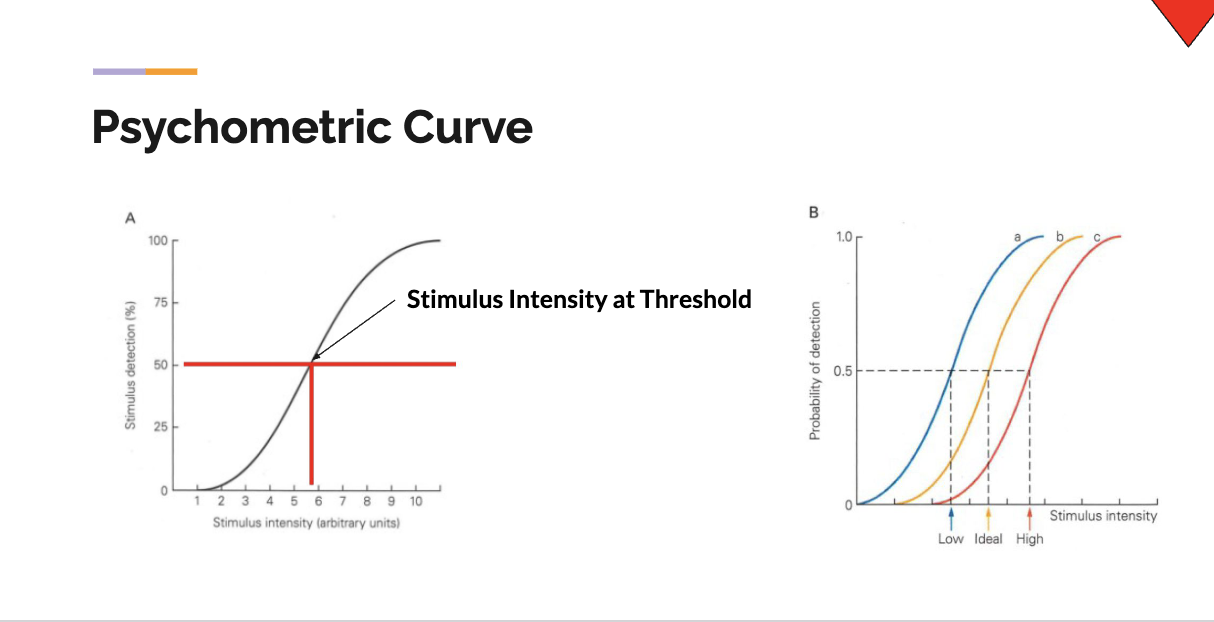
graph illustrating relationship between stimulus intensity and probability of detection or perception
threshold determination is typically at 50% detection probability
Low intensity stimuli are often detected inconsistently
different contexts can change the shape or position of the curve:
shift left: when the stimulus is easier to detect
shift right: when the stimulus is harder to detect
Signal detection theory - determining thresholds
variability in detection thresholds can be determined mathematically
F(x)=(2πσ²)-1/2exp[−(x−m)² / (2σ²]
m = mean
σ = standard deviation
described how values are distributed around a mean
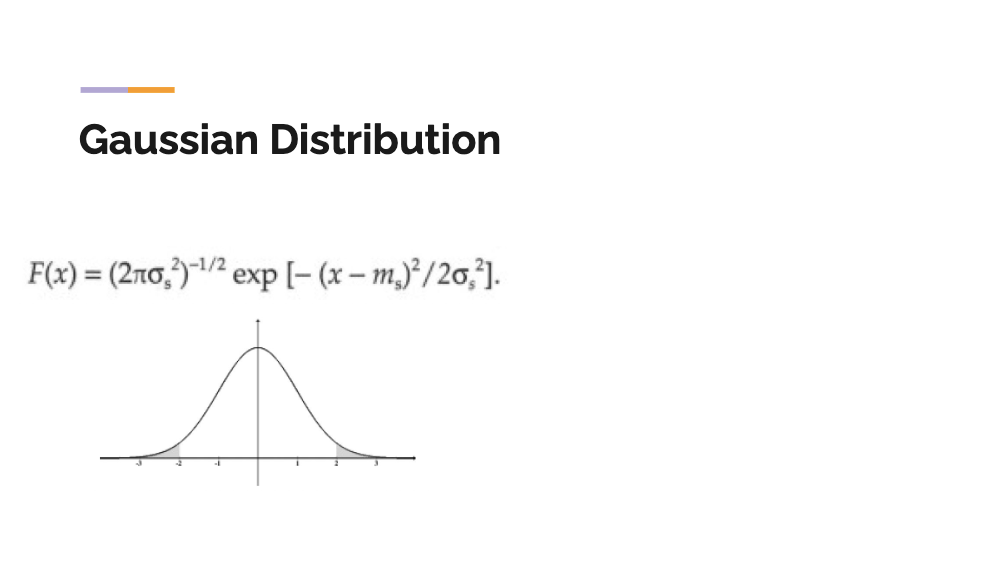
Gaussian distribution
how perceived intensities of stimuli are distributed in a population or experiment
general bell curve with a peak at the mean M
width of the curve is determined by the standard deviation reflecting variability
greater the overlap between noise and signal distributions, the harder it is to distinguish signals
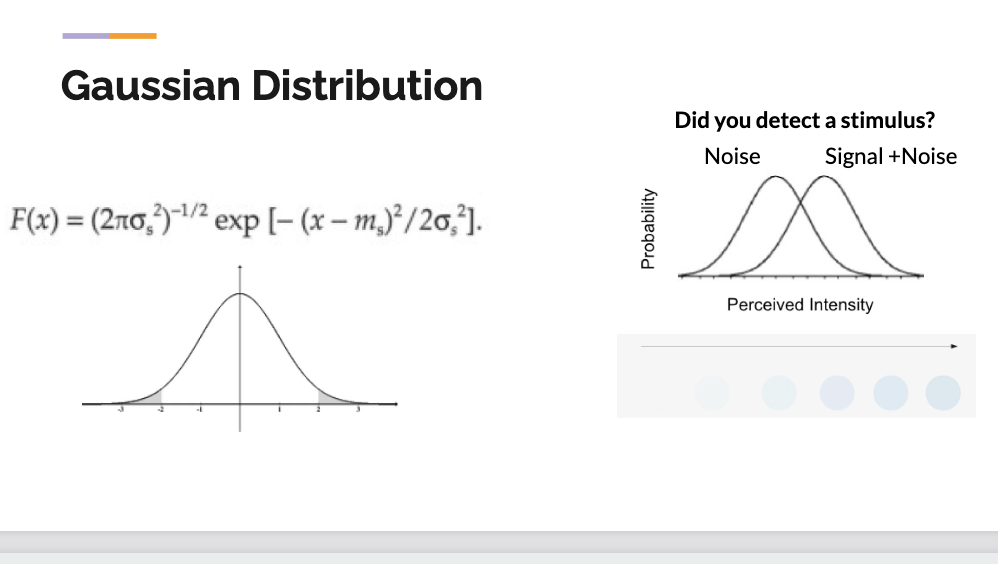
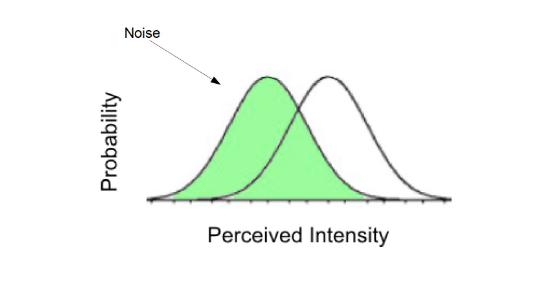
noise-only distribution
represents static or random noise present in the absence of a true signal
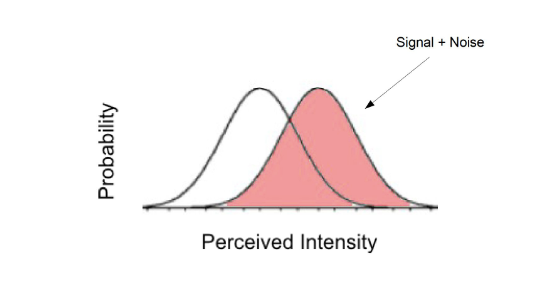
when a real signal is introduced perceived intensity shifts to the right
cuver overlaps with noise only curve showing uncertainty when identifying whether a stimulus is present or absent
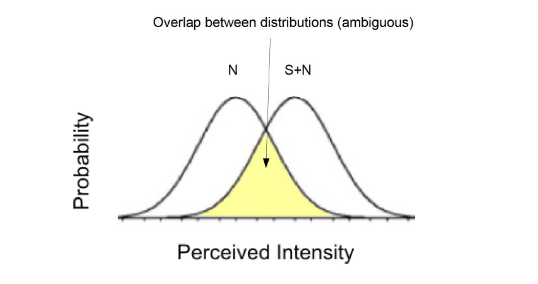
indiactes area where overlap occurs, representing uncertainty
Final explanation
sensitivity is measured by the distance between the peaks of the noise and signal + noise distributions
higher d = better detection
if the perceived intensity is greater than the criterion = stimulus detected
if perceived intensity is less than criterion = stimulus undetected
4 possible outcomes in SDT
correct response (correct yes)
participant correclty identified it as present
false alarm (incorrect yes)
no signal, participant iincorrectly identified signal
correct rejection (correct no)
no signal, participant says there is no signal
miss (incorrect no)
signal present, participant fails to detect signal
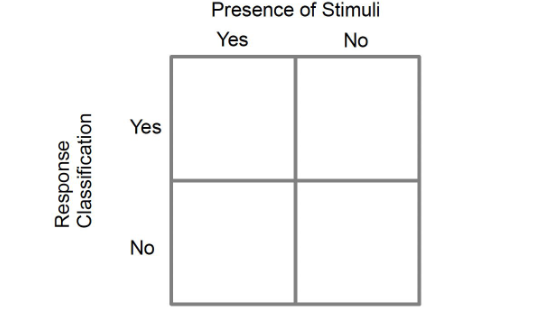
Fawcett - confusion matrix
rows represent participants response classification (yes or no)
columns represent actual presence of the stimulus (yes or no)
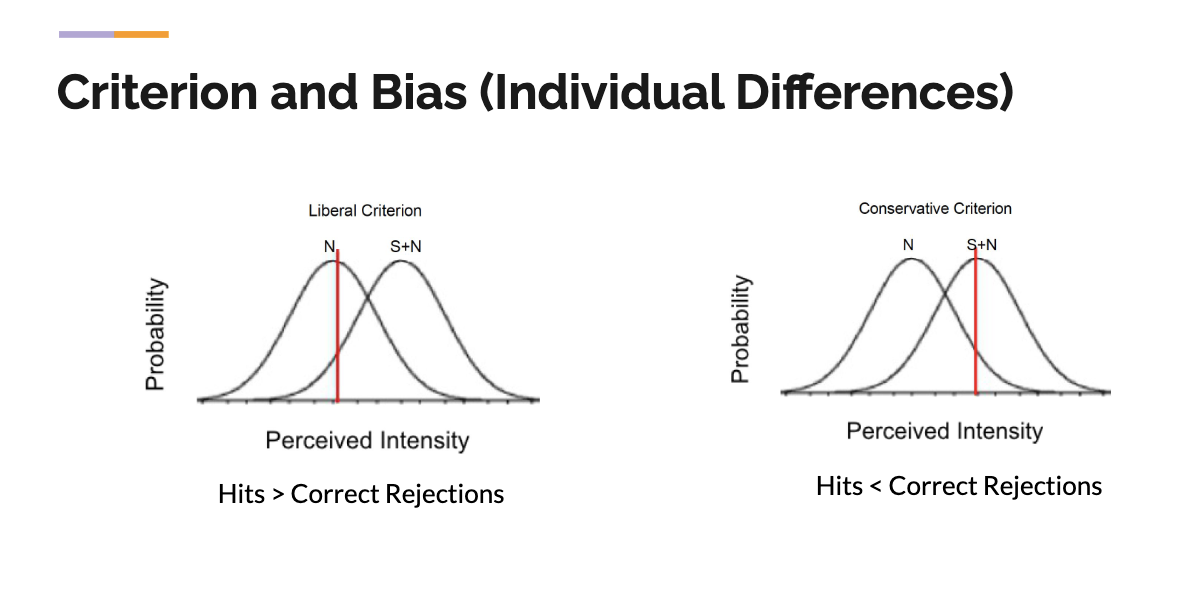
graphs show how people set their decision criterion in signal detection tasks
liberal:
The criterion shifts to the left, leading to more Hits but also more False Alarms.
Reflects a bias towards saying "Yes" to detect a signal even when uncertain.
Conservative:
The criterion shifts to the right, leading to fewer False Alarms but also more Misses.
Reflects a bias towards saying "No" to avoid false positives.
Individual differences in sensory processing
interested in variation sensory thresholds
d-prime is a measure of sensitivity and estimates the standardized difference between the mean of two distribution
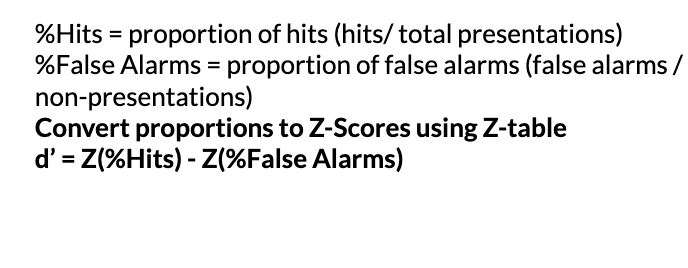
steps to calculate d’:
see picutre
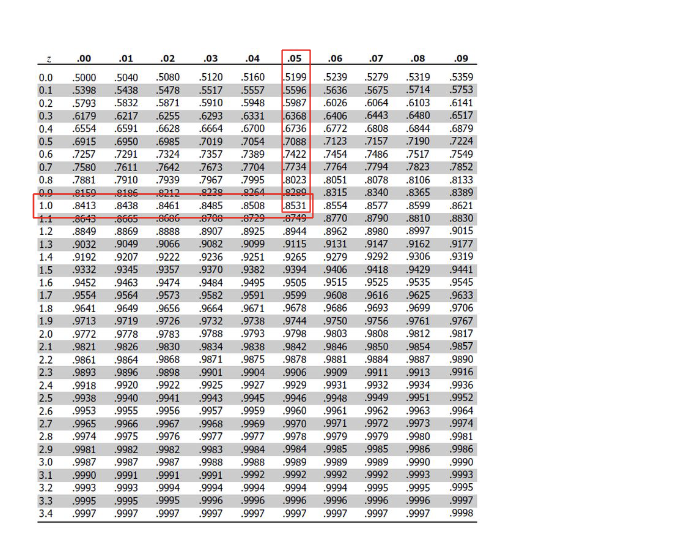
z-table
used to convert proportions into Z-scores
e.g. if 85% of trials result in hits, located 0.85 in z-table to find corresponding z-score
represented how far a proportion is from the mean of a standard normal distribution
calculating d’
hit rate (HR) and false alarm rate (FA) are used to calculate
measures an individual’s sensitivity in detecting a stimulus
z-scores corresponding to HR and FA are substracted
why calculate d’?
to be able to interpret the research on individual differences in sensory integration
each person’s nervous system can use different criteria
can reflect a combination of individual differences in strategy and processing
Stevenson et al
investigated whether variability in the TBW correlates with how individual perceive the McGurk effect
McGurk effect:
phenomenon where conflicting auditory and visual stimuli are combined into a third perception
shows how sensory information is integrated or overridden by dominant modalities
e.g. hearing ba, while seeing ga, combined into da
stevenson et al results
used psychophysics to determine the TBW for multisensory audiovisual stimuli
found that duration of the right-side of the TBW was negatively correlated with likelihood of the perception of the McGurk effect
individual with lower right TBWs are more likley to perceive the McGurk effect
Lebar et al
examined participants brain response to visual stimuli during a mirror-reversed drawing task, comparing high and low performers
tasked with drawing shaped, with visual feedback presented normally or reveresed through a mirror
Findings:
no differences in brain response to visual stimuli in mirror-reversed vs normal drawing conditions
high performers has increase visual cortex activation during drawing when compared to low performers
better integration of visual feedback with motor commands
heightened use of visual processsing to refine movements
Design of individual differences hypotheses
how can we design an experiment to examin if high performers really do show increased brain acitvity?
used same techniques as lebar et al
training-studies: how training over time affects brain activation in low performers, are improvement in skill linked to changed in brain activity
between group differences studies: compare results of trained vs untrained, investigate if increased visual cortex activation is a trait of high performers or develops due to experience