DEMAND CURVE-Price Determination in Competitive Markets
1/21
Earn XP
Description and Tags
DEMAND CURVES
Name | Mastery | Learn | Test | Matching | Spaced |
|---|
No study sessions yet.
22 Terms
define demand
Demand is the amount of a good/service that a consumer is willing and able to purchase at a given price in a given time period
define effective demand
is demand supported by the necessary purchasing power (the ability to pay)
If a consumer is willing to purchase a good, but cannot afford to, it is not effective demand
what does a demand curve represent?
is a graphical representation of the price and quantity demanded (QD) by consumers
what does the law of demand state?
states that there is an inverse relationship between price and quantity demanded (QD), ceteris paribus
When the price rises, the QD falls
When the price falls, the QD rises
define market demand
is the combination of all the individual demand for a good/service
how is market demand calculated?
It is calculated by adding up the individual demand at each price level
give an example of a real-world example of a decrease in demand
During the COVID-19 pandemic, the demand for restaurant dining fell sharply due to changes in various conditions of demand
Reduced disposable income as unemployment increased
Changing preferences for safer dining options
Government restrictions on indoor dining
what happens to the demand curve due to this scenario?
The demand curve shifts to left from D → D1 as fewer consumers opt to eat out
The price level remains the same (P1), demand falls from Q1 → Q2
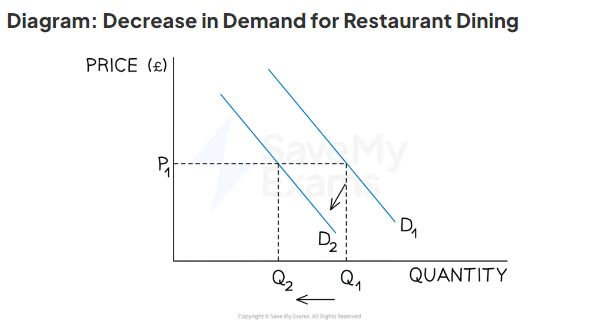
why does the demand curve move this way?
During to the pandemic, there was a downturn in the economy, causing unemployment levels to rise
As a result, there was a reduction in the real income of consumers
Restaurant dining is considered a normal good, demand falls when consumer incomes fall
give an example of a real-world example of a increase in demand
In 2023, global demand for Taylor Swift concerts surged as a result of her music becoming more popular
This is considered to be a change in tastes and preferences
what happens to the demand curve due to this scenario?
The demand curve shifts right D → D1 as more consumers buy concert tickets and the quantity demanded rises Q1 → Q2
Changes in the popularity of her concerts shifted the entire demand curve right, irrespective of the price level
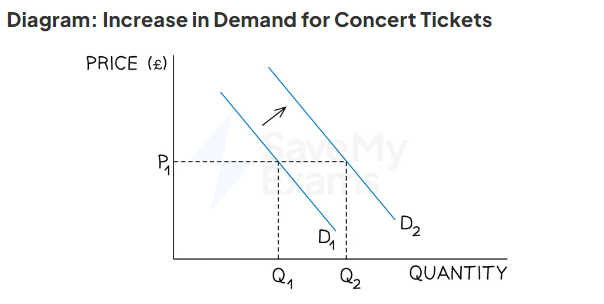
why does the demand curve move this way?
Positive reviews of Swift's concert and the popularity of her songs, along with changes in consumer tastes and preferences, have caused an increase in demand for concert tickets at each price level
how does changes in real income shift the entire demand curve?
An increase in real income typically leads to a rightward shift in the demand curve, as consumers have more purchasing power and can buy more goods and services at every price level.
Conversely, a decrease in real income would shift the demand curve to the left, indicating a reduction in quantity demanded.
how does changes in taste/preferences shift the entire demand curve?
Changes in consumer tastes and preferences can lead to a rightward shift in the demand curve when a product becomes more desirable, increasing the quantity demanded at each price level.
Conversely, if preferences shift away from a product, the demand curve may shift left, reducing the quantity demanded.
how does changes in the prices of substitute of goods shift the entire demand curve?
An increase in the price of a substitute good typically results in a rightward shift in the demand curve for the related good, as consumers will switch to the less expensive option.
Conversely, a decrease in the price of a substitute may shift the demand curve to the left, indicating a reduction in quantity demanded for the original good.
how does changes in the prices of complementary goods (related goods) shift the entire demand curve?
An increase in the price of a complementary good generally causes a leftward shift in the demand curve for the related good, as consumers may purchase less of both goods.
Conversely, a decrease in the price of a complementary good may shift the demand curve to the right, indicating an increase in quantity demanded for the original good.
how does changes in the number of consumers shift the entire demand curve?
An increase in the number of consumers typically results in a rightward shift in the demand curve, as more people create higher demand at each price level.
Conversely, a decrease in the number of consumers may shift the demand curve to the left, indicating a reduction in quantity demanded.
how does future price expectations income shift the entire demand curve?
Expectations of higher future prices generally lead to a rightward shift in the demand curve, as consumers may purchase more now to avoid paying more later.
Conversely, expectations of lower future prices may shift the demand curve to the left, as consumers may delay purchases.