Module 5 - Topic 1 Vocabulary (6th Grade Carnegie Learning)
1/26
There's no tags or description
Looks like no tags are added yet.
Name | Mastery | Learn | Test | Matching | Spaced |
|---|
No study sessions yet.
27 Terms
variability
The value of an attribute being studied can change from one person to another.
data
Categories, number, or observations gathered in response to a statistical question.
statistical question
A question that is answered based on data that vary.
statistical process
A process that has four components:
1. Formulating a statistical question.
2. Collecting appropriate data.
3. Analyzing the data graphically and numerically.
4. Interpreting the results of the analysis.
categorical data
Data for that fits into exactly one of several different categories or groups. Also called qualitative data.
quantitative data
Data for which each piece of data can be placed on a numerical scale. Also called numerical data.
population
The entire set of items from which data are collected.
sample
A selection from a population.
survey
A way to collect data in which people are asked one or more questions.
observational study
A way to collect data in which the researcher observes the variable of interest.
experiment
A way to collect data in which the researcher imposes a condition and observes the results.
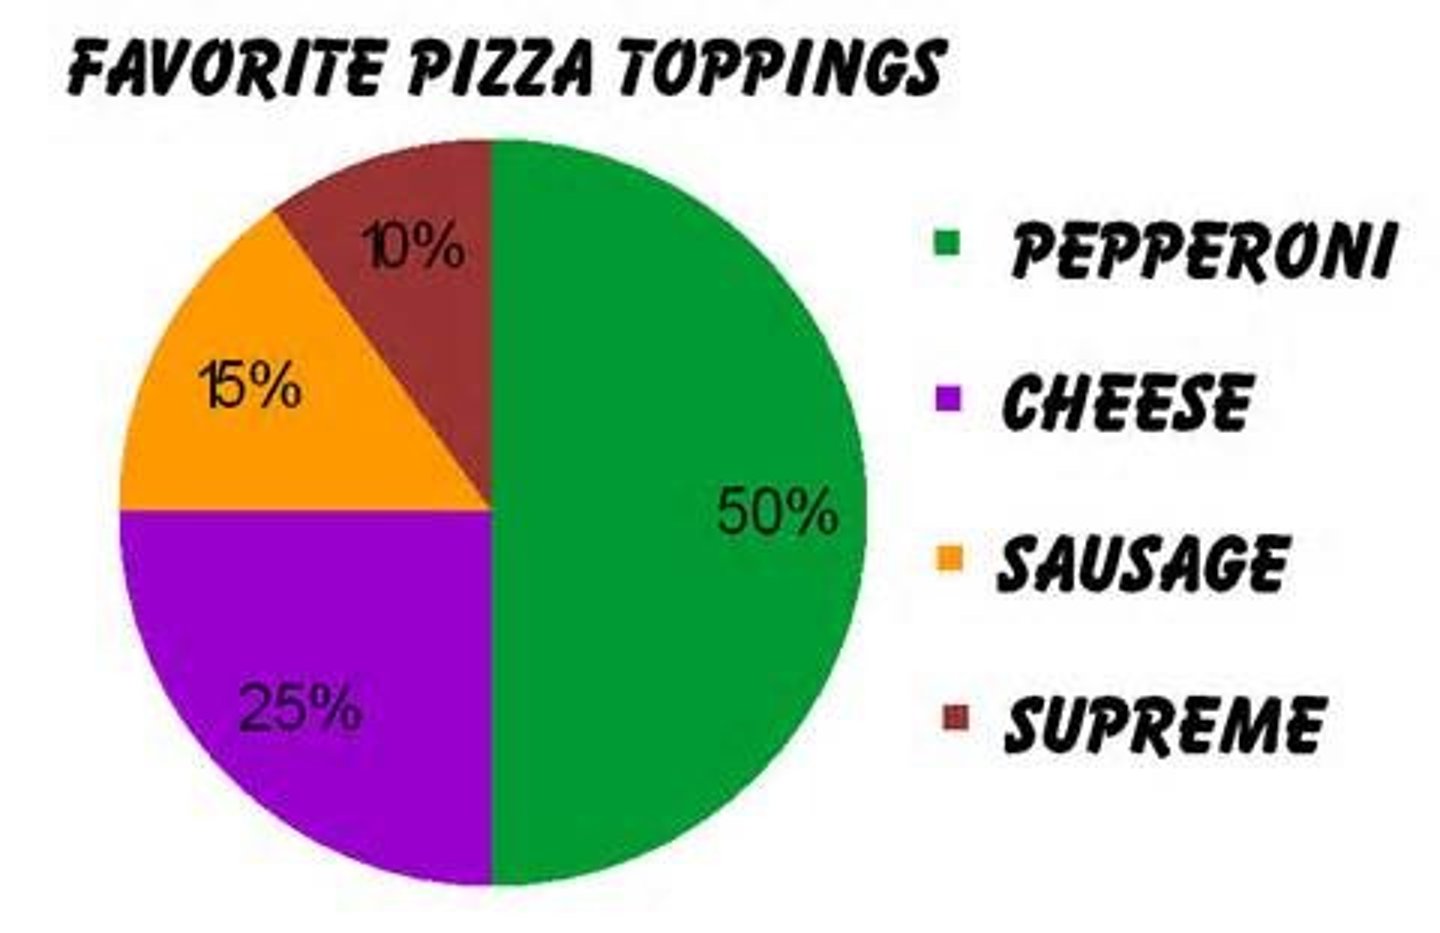
circle graph
Often called a pie chart, it displays categorical data using sectors or "wedges" of a circle.
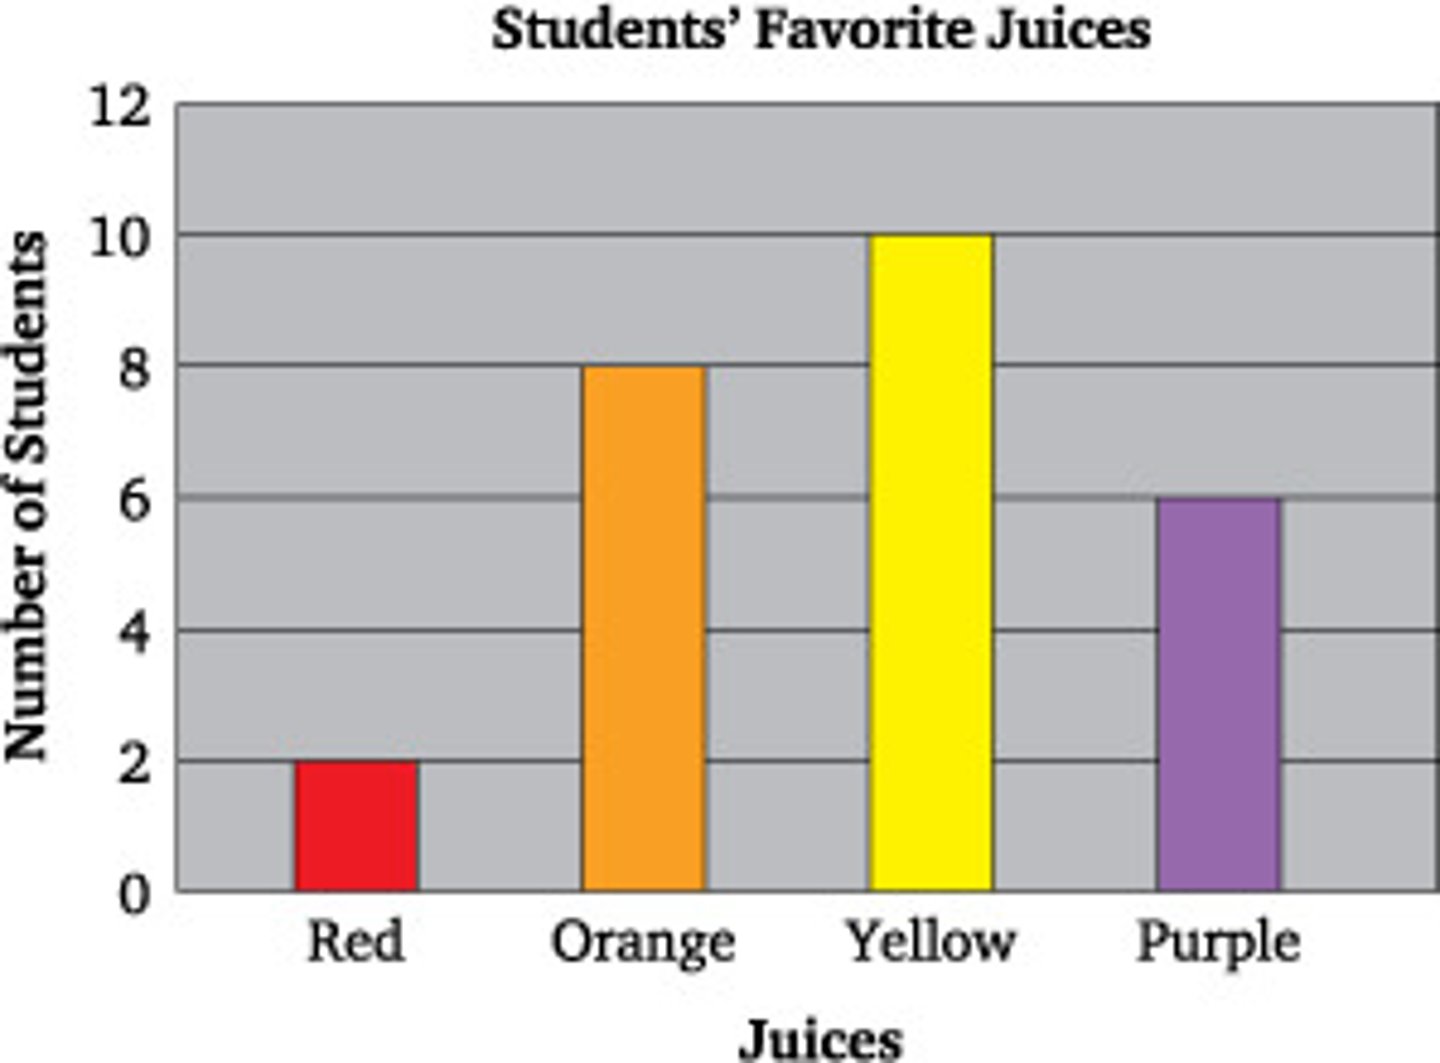
bar graph
A way to display categorical data that uses horizontal or vertical bars.
frequency
The number of times an item or number occurs in a number set.
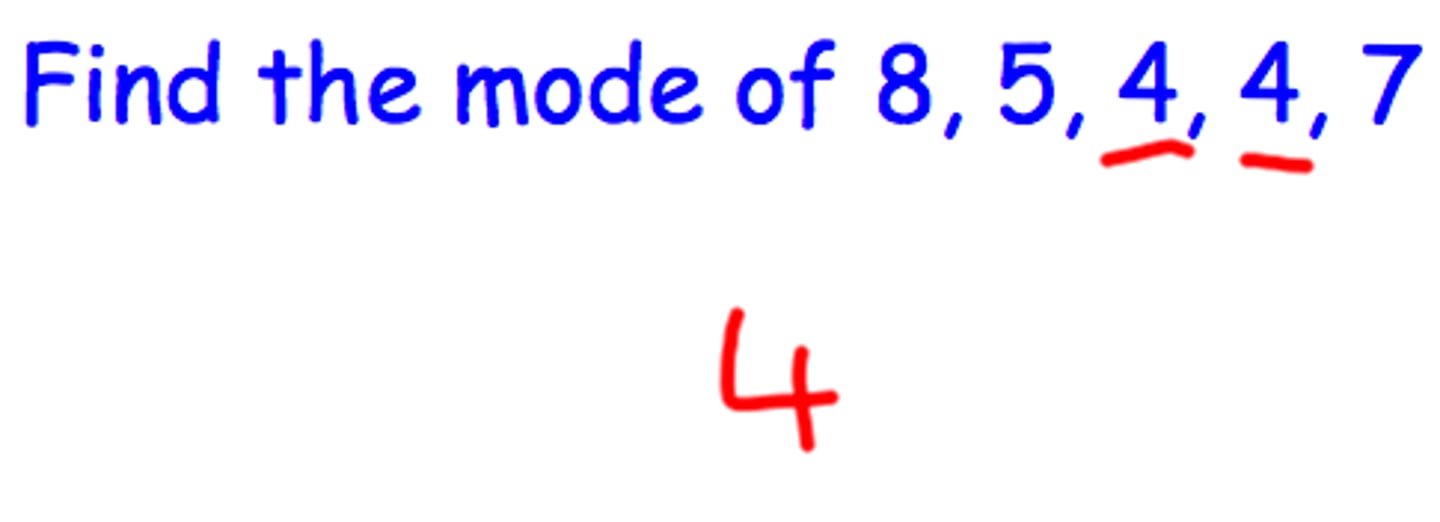
mode
The value that occurs most often in a number set.
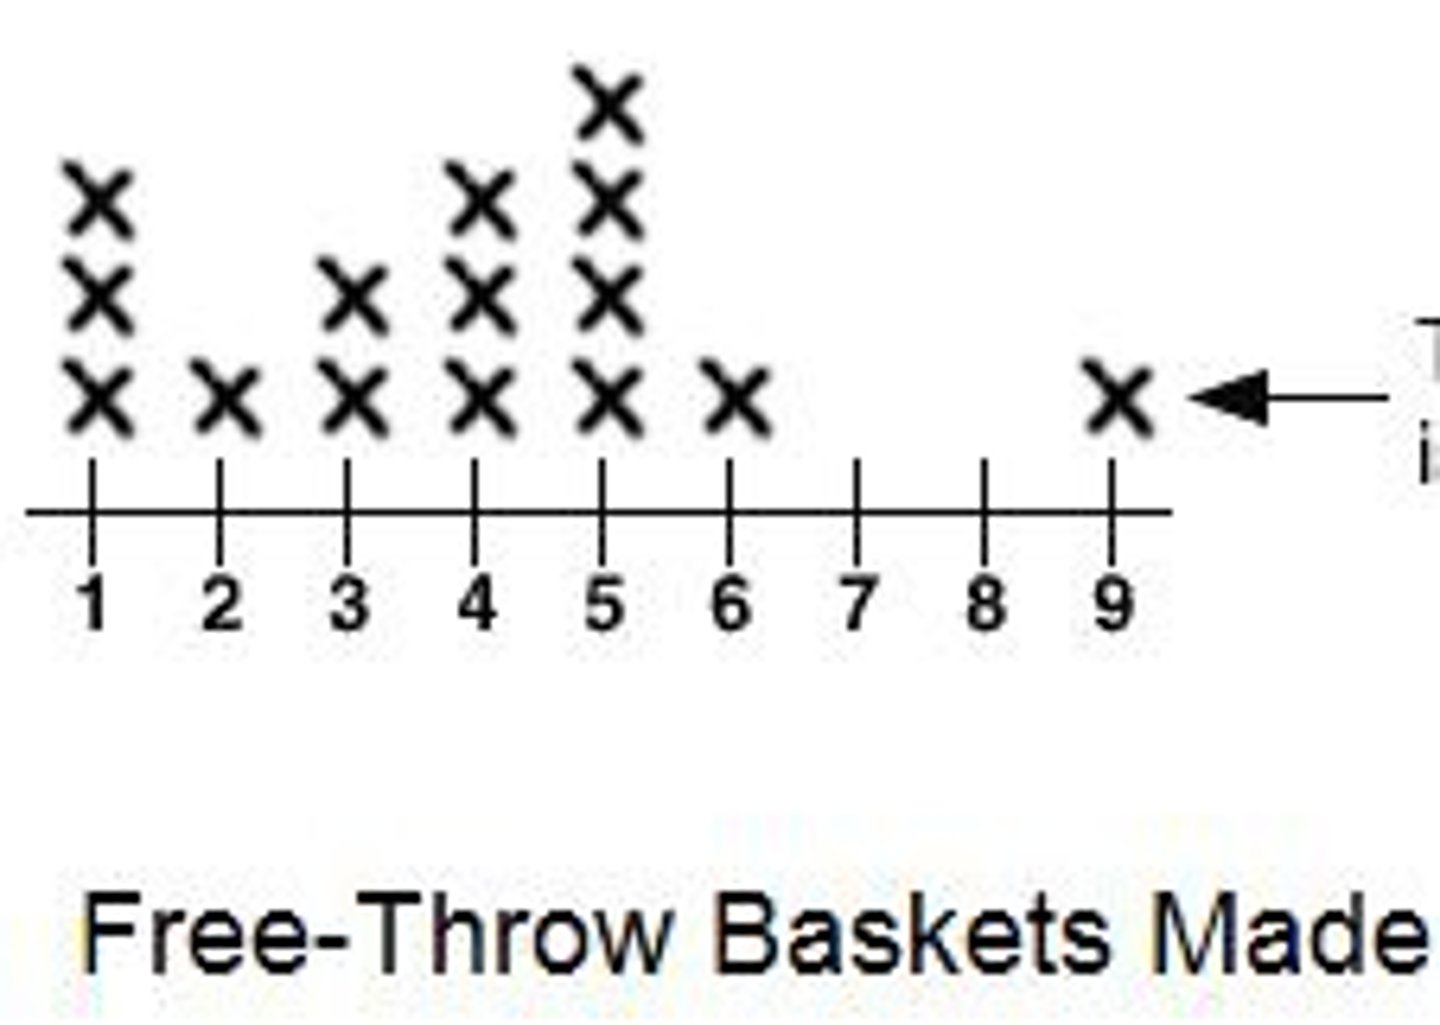
dot plot
A data display that shows discrete data on an umber line with dots, Xs, or other symbols.
distribution
The way in which data is spread out.
symmetric
Data is is displayed in a way that the right and left halves mirror each other and there is a peak in the middle.
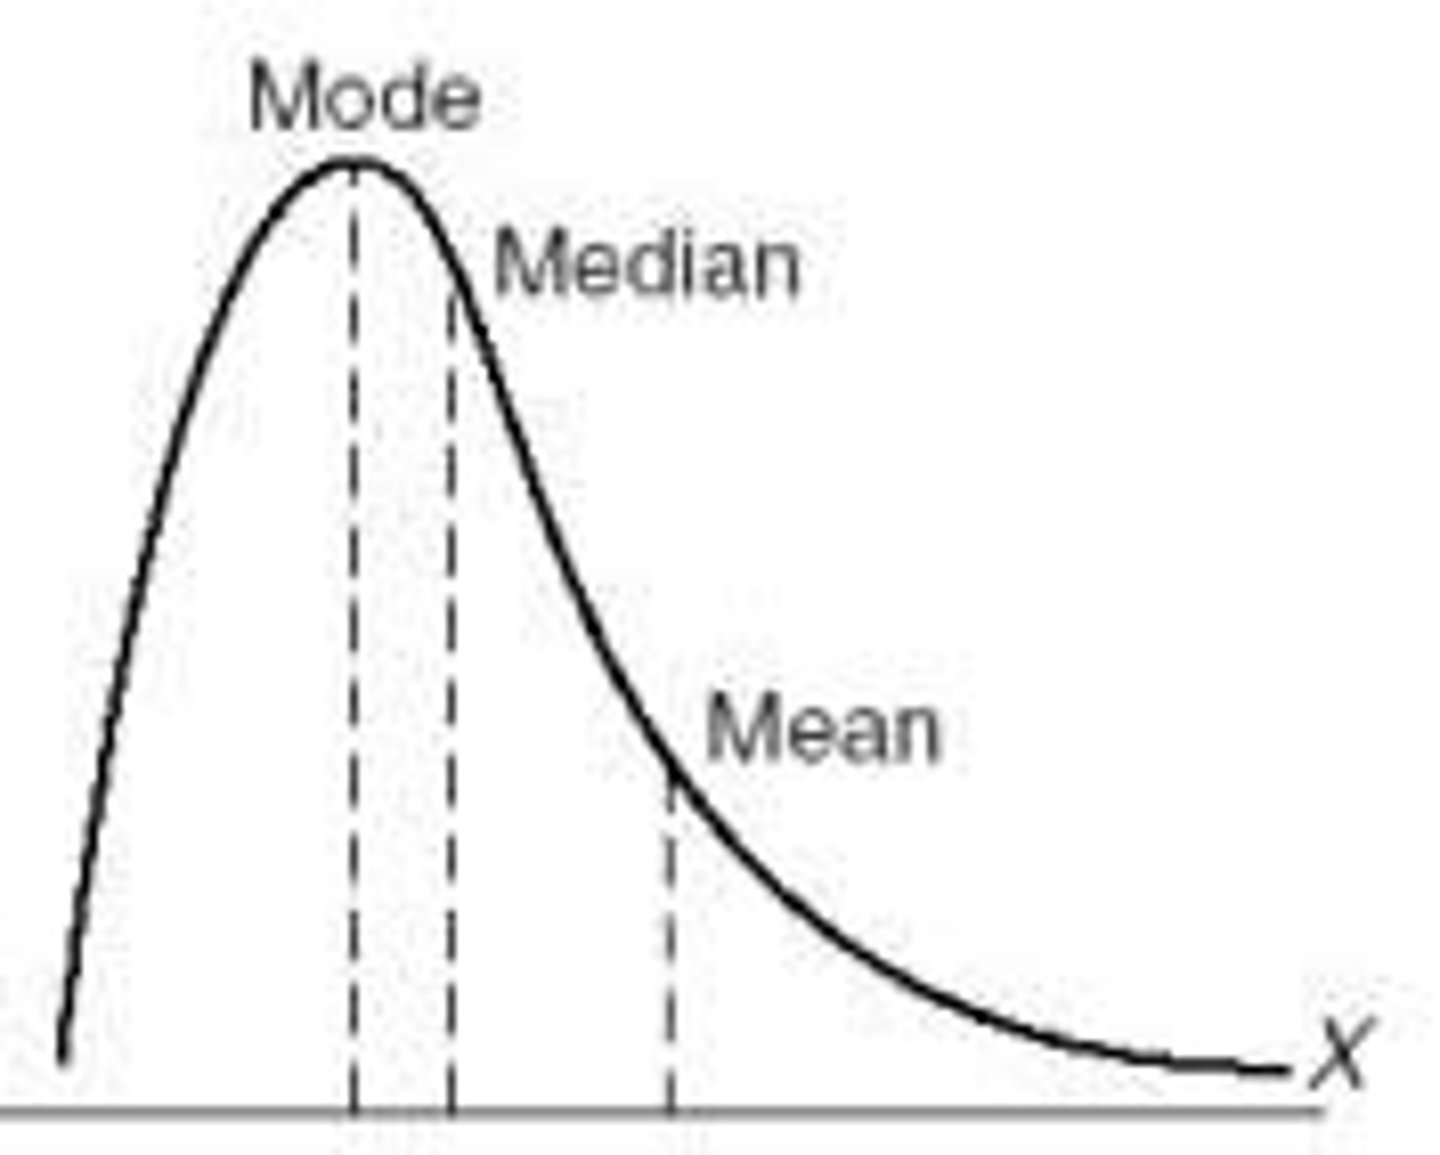
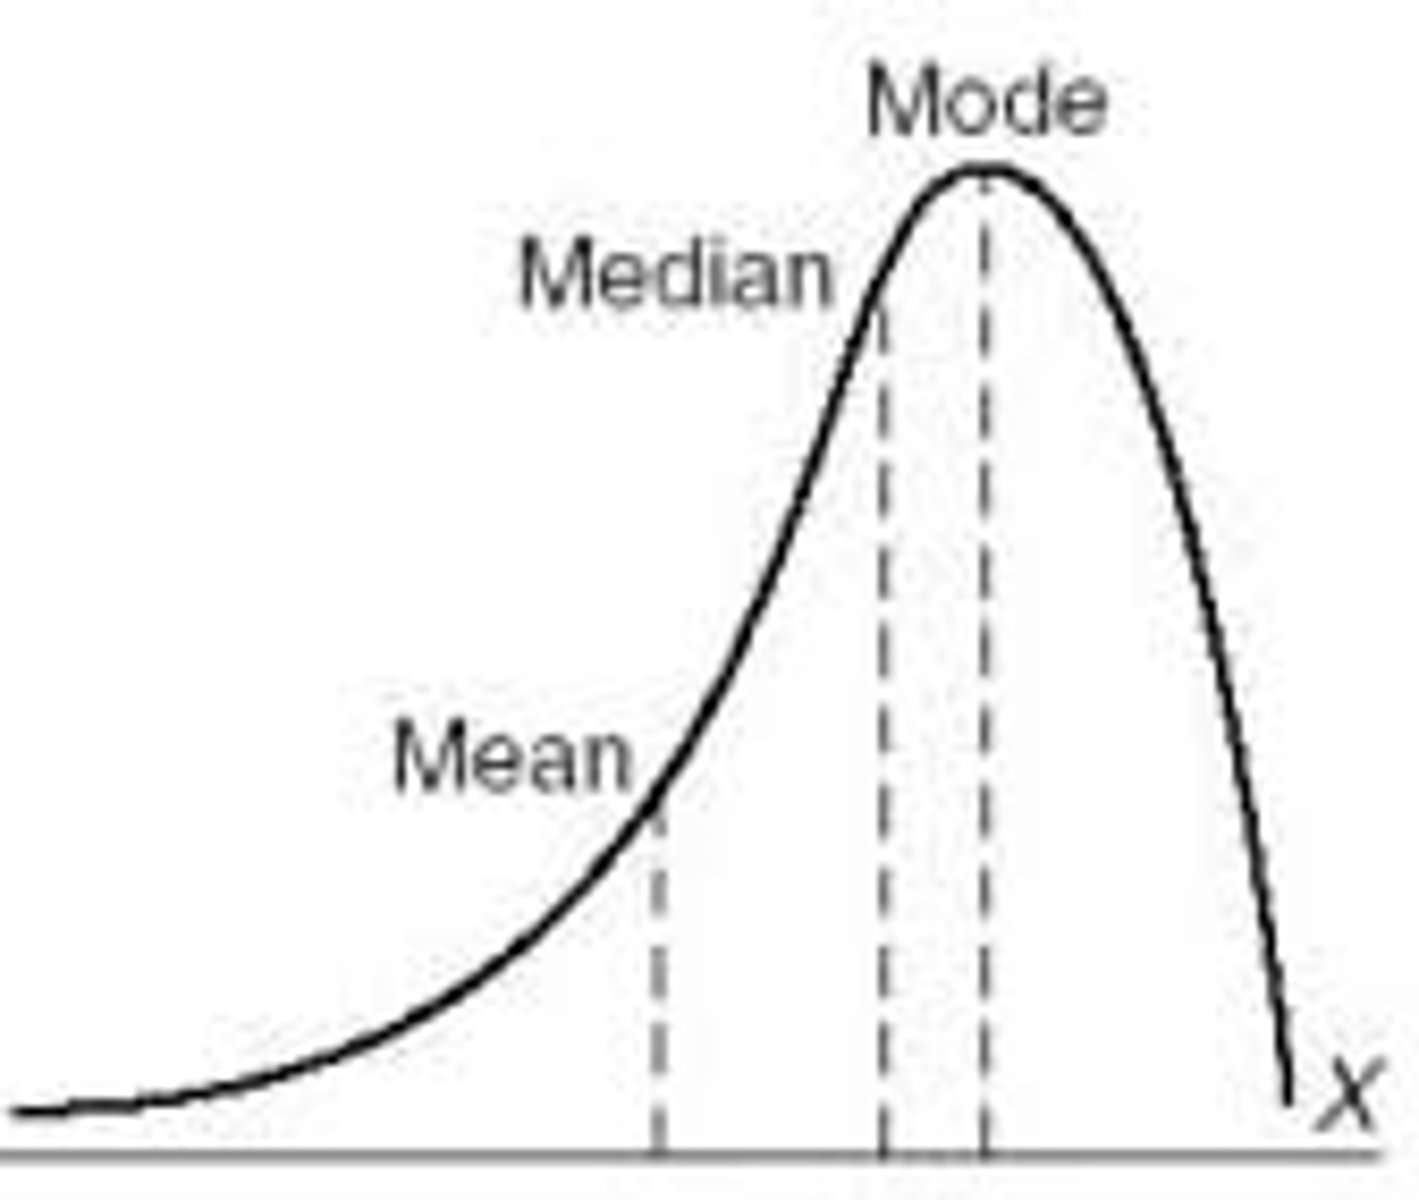
skewed right
Data is displayed in a way that the peak of the data is the left side and there are only a few data points on the right side.
skewed left
Data is displayed in a way that the peak of the data is on the right side and there are only a few data points on the left side.
clusters
Area where data are grouped close together.
gaps
Areas where there are no data.
peaks
Values that contain more data points than values on either side of it.
outliers
Data values that lie a large distance from other data.
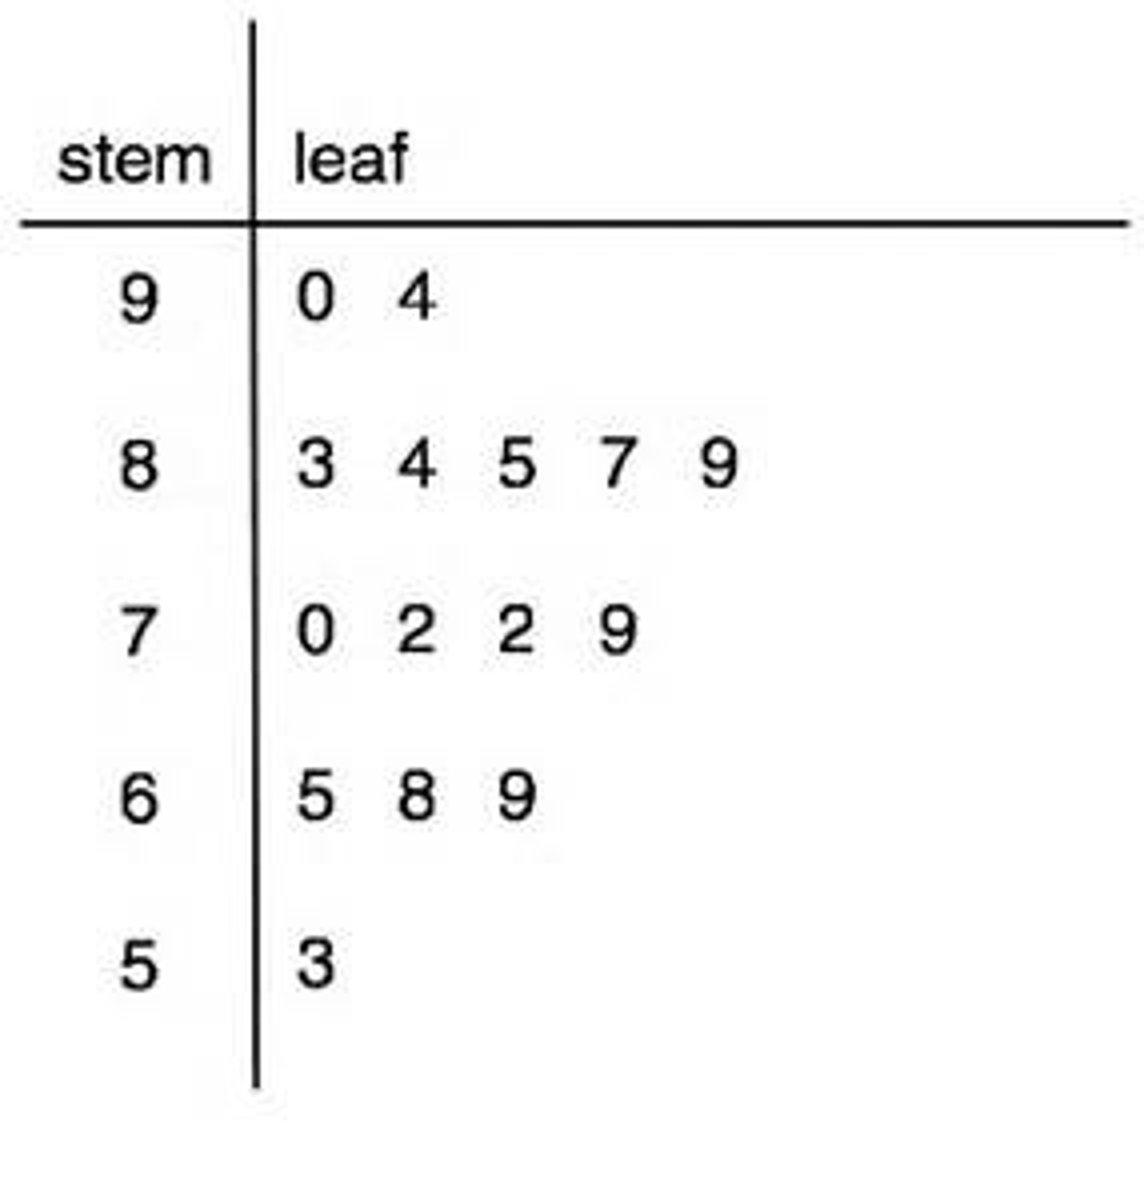
stem-and-leaf plot
A graphical method represented to order numerical data.
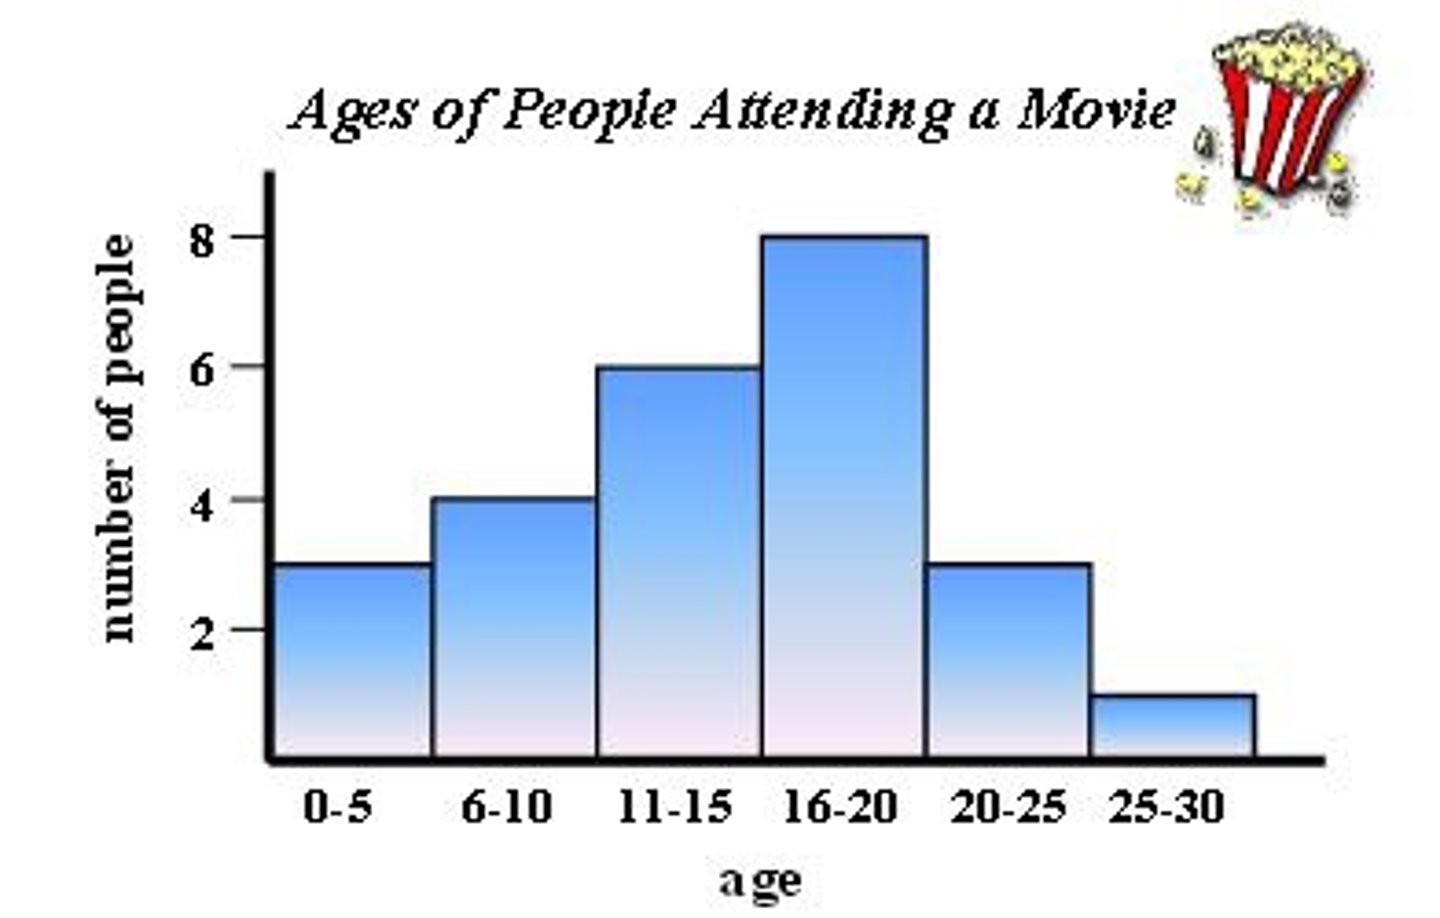
histogram
A way to display quantitative data using vertical bars that touch.
grouped frequency table
A table used to organize data according to how many time data values within a given range occur.