Biostatistics 3: Correlation and Regression
1/18
There's no tags or description
Looks like no tags are added yet.
Name | Mastery | Learn | Test | Matching | Spaced | Call with Kai |
|---|
No analytics yet
Send a link to your students to track their progress
19 Terms
What is variance?
Variance: a measure of dispersion for a single numerical variable, i.e. how far are the values spread out from their average value.
What is covariance?
Covariance: a measure of dispersion for two numerical variables, describing how spread out both are in relation to the average values of both.
What is correlation?
Correlation: a measure of an interdependent relationship between two numerical variables, i.e. a change in one drives a change in the other, and vice versa.
If two variables are correlated we see…
• An increase in one drives an increase in the other.
• An decrease in one drives an decrease in the other.
If two variables are anticorrelated we see…
• An increase in one drives an decrease in the other.
Describe what the correlation coefficient corresponds to.
Between - 1 and 1
• 1 is perfectly correlated
• -1 is perfectly anti-correlated
• 0 is perfectly un-correlated
What is the correlation test?
This is a statistical hypothesis test.
• Null hypothesis: there is zero correlation between the two variables.
• Assumptions:
• a linear relationship between the variables is expected.
• both variables contain data drawn from a normal distribution.
What is correlation?
In fact, correlation is the specific interdependent relationship between two numerical variables.
If you're talking about any other type of relationship between
variables, you probably mean to say there is an "association"
between the variables.
Pearson’s correlation coefficient assumes a _____ ______ between variables.
linear relationship
If there is not a linear relationship between variables (Pearson’s Correlation) we must consider the ___ - ________ correlation.
Which is?
non-parametric
Spearman's method for correlation is the non-parametric equivalent for the pearson’s correlation.
• Assumes the relationship between variables is monotonic.
• Otherwise has exactly the same interpretation.
Establishes a “NON-straight line”, line fitting the data
What is linear regression?
Statistical modelling exactly how one continuous variable depends on another.
Regression is about dependence i.e. the input variable drives a change in the outcome variable, but NOT the other way around.
Linear regression is a technical term for…
'fitting a straight line to the data'
The linear regression model estimates what two parameters?
What method is used to estimate them?
The model estimates two parameters:
• Intercept - the value of the response variable when the input variable is zero.
• Gradient - the slope of the line.
Estimated with method called maximum likelihood.
• The model compares many possible lines to a zero-gradient horizontal line to find the 'best fit'.
• It does so by calculating a quantity called least squares.
In linear regression, what assumptions are made by the models?
• Reason to expect a linear relationship between the two variables.
• Residuals are independent of each other.
• Residuals are normally distributed and have constant variance.
When we perform predictive modeling, there are two types, which are?
Two types of prediction:
• Extrapolation - predicting new y-values for x-values outside the range covered by the data.
• Interpolation - predicting new y-values for x-values that are inside the range covered by the data.
Safer and more reliable
What is the linear regression equation?
y = a + bx
Where:
• y is the outcome variable.
• x is the input variable.
• a is the model estimate for the intercept.
• b is the model estimate for the coefficient of x.
What if data is not able to be related linearly?
• Transforming it, for example by calculating the logarithm of one of the variables.
• Use another modelling strategy, e.g. polynomial regression (fitting a quadratic, cubic, or higher order polynomial function to the data).
• For binary outcomes, we can use logistic regression (see next week).
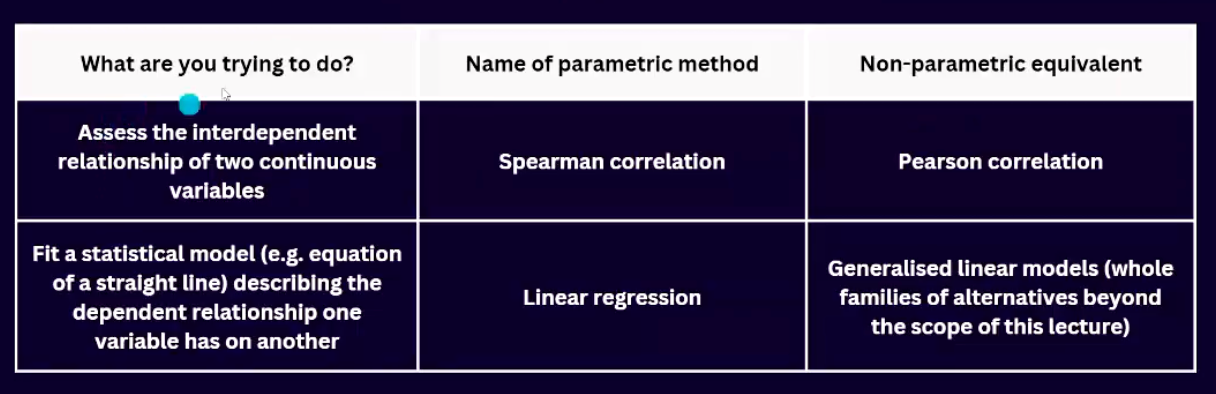
Summarize overall differences between the Spearman correlation and Linear regression.
What value of R denotes a relationship?
1 - Perfect Relationship
0 - No Relationship