Chapter 4: Cost-Volume-Profit Analysis
1/50
There's no tags or description
Looks like no tags are added yet.
Name | Mastery | Learn | Test | Matching | Spaced |
|---|
No study sessions yet.
51 Terms
different types of cost:
variable costs
fixed costs
mixed costs (VC + FC)
variable costs
remain constant per unit but change in total as volume changes
fixed costs
do not change in total over wide ranges of volume or activity
Characteristics of Variable Costs
Total Cost
changes proportionately to changes in volume
when volume increases, total costs increases
when volume decreases, total costs decreases
Cost per Unit
remains constant
Characteristics of Fixed Costs
Total Cost
remains constant
Cost Per Unit
changes inversely to changes in volume
when volume increases, cost per unit decreases
when volume decreases, cost per unit increases
mixed costs
have both fixed and variable components
High-Low Method
a method to separate mixed costs into variable and fixed components (three steps)
Steps of the High-Low Method:
identify the highest and lowest levels of activity and calculate the variable cost per unit
calculate the total fixed costs
create and use an equation to show the behavior of a mixed cost
Variable Cost per unit =
change in total cost / change in volume of activity
Variable cost per unit (in terms of high/low) =
(cost associated with highest volume - cost associated with lowest volume) / (highest volume - lowest volume)
total fixed cost =
total mixed cost - total variable cost
total fixed cost (expanded) =
total mixed cost - (variable cost per unit x number of units)
total mixed cost =
(variable cost per unit x number of units) + total fixed cost
relevant range
the range of volume where total fixed costs and variable costs per unit remain constant
contribution margin
the difference between net sales revenue and variable costs
called contribution margin because it is the amount that contributes to covering fixed costs
contribution margin =
net sales revenue - total variable costs
unit contribution margin / contribution margin per unit
exactly what it sounds like. contribution margin per unit
unit contribution margin =
net sales revenue per unit - variable cost per unit
contribution margin ratio
the ratio of contribution margin to net sales revenue
contribution margin ratio =
contribution margin / net sales revenue
OR
unit contribution margin / net sales revenue per unit
traditional income statement classifies costs by function:
product costs
period costs
a contribution margin income statement classifies costs by behavior:
variable costs
fixed costs
cost-volume-profit (CVP) analysis
a planning tool that looks at the relationships among costs and volume and how they affect profits (or losses)
assumptions for CVP analysis:
the price per unit does not change as volume changes
managers can easily classify each cost as variable, fixed, or mixed
the only factor that affects total costs is change in volume, which increases or decreases variable and mixed costs
fixed costs do not change
there are no changes in inventory levels
CVP analysis can be used to…
estimate the amount of sales needed to achieve the breakeven point
breakeven point
the sales level at which the company does not earn a profit or a loss but has an operating income of zero
three methods of estimated sales required to break even:
equation approach
contribution margin approach
contribution margin ratio approach
the equation approach
operating income = net sales revenue - variable costs - fixed costs
the contribution margin approach
required sales in units = (fixed costs + target profit) / contribution margin per unit
Contribution margin ratio approach
required sales in dollars = (fixed costs + target profit) / contribution margin ratio
target profit
the operating income that results when net sales revenue minus variable and fixed costs equals management’s profit goals
same three approaches used for breakeven profit calculation can be used to determine the target profit
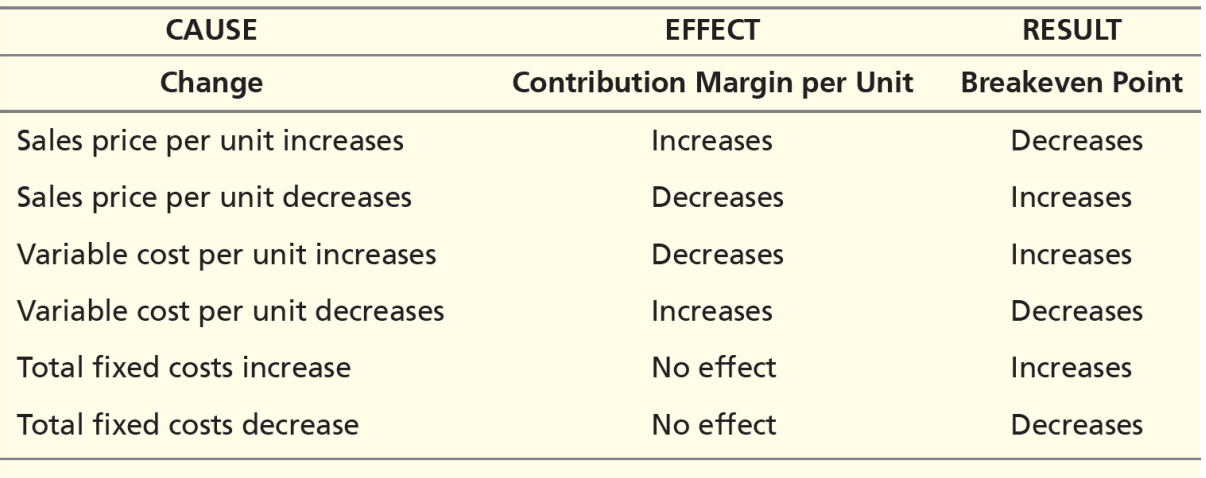
sensitivity analysis
a “what if” technique that estimates profit or loss results if sales price, cost, volume, or underlying assumptions change
effects of changes in sales price, variable costs, and fixed costs
cost stickiness
costs increase more when sales volume is increasing than costs decrease when sales volume is decreasing
three additional applications of CVP:
margin of safety
operating leverage
sales mix
margin of safety
the excess of expected sales over breakeven sales
used to evaluate the risk of current operations and their plans for the future
margin of safety in units =
expected sales - breakeven sales
margin of safety in dollars =
margin of safety in units x sales price per unit
margin of safety ratio =
margin of safety in units / expected sales in units
cost structure
the proportion of fixed costs to variable costs
operating leverage
predicts the effects that fixed costs will have on changes in operating income when sales volume changes
degree of operating leverage
can be measured by dividing the contribution margin by the operating income
degree of operating leverage =
contribution margin / operating income
the cost of producing products is estimated using one of two methods:
absorption costing includes all product costs
variable costing considers only variable manufacturing costs
Absorption costing - Product Costs
direct materials
direct labor
variable manufacturing overhead
fixed manufacturing overhead
Absorption Costing - Period Costs
variable selling and administrative costs
fixed selling and administrative costs
Absorption Costing - Income Statement Format
Traditional Format:
Net Sales Revenue
- Cost of Goods Sold
______________________
Gross Profit
- Selling and Administrative Costs
_______________________
Operating Income
Variable Costing - Product Costs
direct materials
direct labor
variable manufacturing overhead
Variable Costing - Period Costs
fixed manufacturing overhead
variable selling and administrative costs
fixed selling and administrative costs
Variable Costing - Income Statement Format
Contribution Margin Format:
Net Sales Revenue
- Variable Costs
__________________
Contribution Margin
- Fixed Costs
___________________
Operating Income
variable costing and absorption costing will result in different operating income when:
units produced are more than units sold
units produced are less than units sold