MSAV 662 Exam 1 (Chapters 1, 2, 3, 4, 6, 7) Terms & Concepts
 Call Kai
 Learn
Learn Practice Test
 Spaced Repetition
 Match
Match Flashcards
 Knowt Play
1/72

There's no tags or description
Looks like no tags are added yet.
Name | Mastery | Learn | Test | Matching | Spaced | Call with Kai | Chat |
|---|
No analytics yet
Send a link to your students to track their progress
73 Terms
Descriptive Statistics
applying statistics to organize and summarize information
Inferential Statistics
applying statistics to interpret the meaning of information
Population
entire set of individuals or items of interest
data termed parameters
generalized inferential statistics
Sample
representative subset of a population
data determined statistics
most of behavioral research
Variables
any characteristic, behavior, observation that can be measured and has different values
Score
numerical value associated with the variable
Value
number of levels or scores a variable can have
Nominal scale of measurement
uniquely classifies
e.g., Zip codes, telephone numbers, gender (coded as 1/2/3)

Ordinal scale of measurement
uniquely classifies
order matters
e.g., finishing order in a competition, education level, rankings

Interval scale of measurement
uniquely classifies
order matters
equal intervals
e.g., temperature, latitude and longitude, satisfaction rating scales

Ratio scale of measurement
uniquely classifies
order matters
equal intervals
natural zero
e.g., length, height, weight, time

Continuous Data
measured along a continuum at any place beyond the decimal point
e.g., Olympic sprinter’s run time
Discrete Data
measured in whole units or categories that are not distributed along a continuum
e.g., number of students in a class
Three common research methods
Experimental
Quasi-experimental
Correlational
Experimental method
applied to make observations in which a researcher fully controls the conditions and experiences of participants by applying three required elements of control: manipulation, randomization, and comparison/control, to isolate cause-and-effect relationships between variables
Quasi-experimental method
applied to make observations in a study that is structured like an experiment but has conditions and experiences of participants that lack some control because the study lacks random assignment, includes a preexisting variable, and may not include a comparison/control group
e.g. value of education of students who went to college vs. who didn’t go to college after high school
Correlational method
the measurement of two or more factors, whose variables are not manipulated, to determine or estimate the extent to which the values for the factors are related or change in an identifiable pattern, though lacking the appropriate controls to demonstrate cause and effect
e.g. students’ hours of computer use vs. exercise minutes per week
frequency
the number of times, or how often, a category, score, or range of scores occurs
frequency distribution
a summary of data in terms of how often a category, score, or range of scores occurs
(useful when researchers measure counts of behavior)
real range
one more number than the difference between the largest and smallest number in a data set
interval width
the range of values contained in each interval of a frequency distribution with grouped data
= real range / number of intervals chosen
outlier
an extreme score that falls substantially above or below most other scores in a data set
relative frequency
a summary display that distributes the proportion of scores in each interval of a frequency distribution
= observed frequency / total frequency count
also converted to relative percentage by multiplying X 100
percentile point
the value of a score on a measurement scale below which a specified percentage scores in a distribution fall
Calculate value of a specific percentile
= (distance of percentile from top of interval cumulative value / range of width from percentages) X width of real range
Ungrouped data
a set of scores or categories distributed individually, in which the frequency for each individual score or category is counted
pictogram
a summary display that uses symbols or illustrations to represent a concept

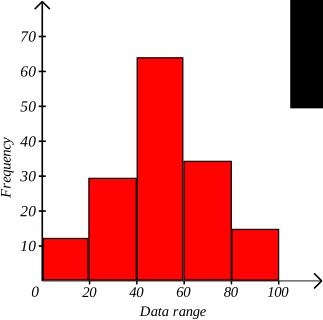
histogram
a graphical display used to summarize the frequency of continuous data that are distributed in numeric intervals, represented by a vertical rectangle for each interval frequency
frequency polygon
a dot-and-line graph used to summarize the frequency of continuous data at the midpoint of each interval, which is distributed along the x-axis and is calculated by adding the upper and lower boundary of an interval and then dividing by 2
interval boundaries
mark the cutoffs for a given interval with the upper and lower limits for each interval, with the lower being the smallest value and the upper being the largest value in each interval of the frequency distribution
ogive
a dot-and-line graph used to summarize the cumulative percentages or cumulative frequencies of data at the upper boundary of each interval, with the y-axis always ranging from 0% to 100%
stem-and-leaf display
a graphic method of displaying data that can be used for discrete or continuous data, in which each original score from an individual data set is listed
bar chart
a graphical display used to summarize the frequency of discrete and categorical data that are distributed in whole units or classes
pie chart
a graphical display in a circle that depicts the relative percentage of discrete and categorical data as segments of the circle
central tendency
statistical measures for locating a single score at or near the center of a distribution that is most representative or descriptive of all scores in the distribution
arithmetic mean
the sum of a set of scores in a distribution, divided by the total number of scores summed; conceptually the ‘balance point’ of a distribution
weighted mean
the average for a set of values in which some data points contribute more than others
= sum of weighted products / sum of weights
median
the middle value in a distribution of data listed in numeric order
mode
the value or score that occurs most often or most frequently in a data set
Add a score above the mean and the mean will…
increase
Add a score below the mean and the mean will…
decrease
Delete a score below the mean and the mean will…
increase
Delete a score above the mean and the mean will…
decrease
Add or delete a score equal to the mean and the mean will…
not change
normal distribution
a theoretical distribution in which scores are symetrically distributed above and below the mean, the median, and the mode at the center of the distribution
skewed distribution
a distribution of scores that includes those that fall substantially above (positively) or substantially below (negatively) most other scores in a distribution
positively skewed distribution
a distribution of scores that includes scores that are substantially larger (toward the right tail in a graph) than most other scores, where the mean is located above or to the right of the median
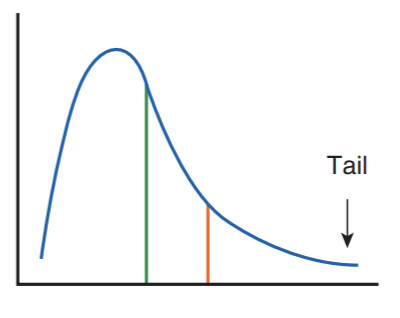
negatively skewed distribution
a distribution of scores that includes scores that are substantially smaller (toward the left tail in a graph) than most other scores, where the mean is located below or to the left of the median

modal distribution
a distribution of scores in which one or more scores occur most often or most frequently, which come in a variety of shapes and sizes
unimodal distribution
a distribution of scores in which one mode occurs most often or most frequently (has one mode)
bimodal distribution
a distribution of scores in which two scores occur most often or most frequently (has two modes)

nonmodal (rectangular) distribution
a distribution of scores in which all scores occur at the same frequency (has no mode)

variability
statistical measures for locating a single score used to determine the dispersion or spread of scores in a distribution
range
the difference between the largest and smallest value in a data set
fractiles
measures that split a data set into two or more equal parts (e.g., quartiles, deciles, and percentiles)
the four quartiles
the 25th percentile (Q1), the 50th percentile (Q2), the 75th percentile (Q3), and the 100th percentile (Q4)
interquartile range
the range of values between the upper (Q3) and lower (Q1) quartiles of a data set
semi-interquartile range (quartile deviation)
a measure of half the distance between the upper quartile (Q3) and lower quartile (Q1) of a data set, computed by dividing the IQR in half
variance
a measure of variability for the average squared distance that scores deviate from their mean, where the larger the value, the more dispersed or spread out scores are from their mean
population variance (σ²)
a measure of variability for the average squared distance that scores in a population deviate from the mean, computed only when all scores in a given population are recorded
deviation
the difference of each score from its mean, denoted x − µ when computed for a population
sum of squares (SS)
the numerator for the variance formula, which is the sum of the squared deviations of scores from their mean
sample variance (s²)
a measure of variablity for the average squared distance that scores in a sample deviate from a mean
definitional formula for variance
calculates the population and sample variance that requires summing the squared differences of scores from their mean to compute the sum of squares (SS) in the numerator
computational formula for variance (raw scores method for variance)
a formula to compute population and sample variance that does not require summing the squared differences of scores from their mean to compute the SS in the numerator
biased estimator
any sample statistic obtained from a randomly selected sample that does not equal the value of its respective population parameter, on average
unbiased estimator
any sample statistic obtained from a randomly selected sample that equals the value of its respective population parameter
degrees of freedom (df) for sample variance
the number of scores that are free to vary in a sample
standard deviation (root mean square deviation)
a measure of variability for the average distance that scores deviate from their mean (square root of the variance)
population standard deviation (σ)
a measure of variability for the average distance that scores in a population deviate from their mean, calculated by taking the square root of the population variance
sample standard deviation (s / SD)
a measure of variability for the average distance that scores in a sample deviate from their mean, calculated by taking the square root of the sample variance
empirical rule
1. Approximately 68% of all scores lie within one standard deviation of the mean
2. Approximately 95% of all scores lie within two standard deviations of the mean
3. Approximately 99.7% of all scores lie within three standard deviations of the mean

Chebyshev’s theorem
defines the percentage of data from any distribution that will be contained within any number of standard deviations where SD > 1
