Week 5 Lecture - Relationship Statistics
 Call Kai
 Learn
Learn Practice Test
 Spaced Repetition
 Match
Match Flashcards
 Knowt Play
1/51

There's no tags or description
Looks like no tags are added yet.
Name | Mastery | Learn | Test | Matching | Spaced | Call with Kai | Chat |
|---|
No analytics yet
Send a link to your students to track their progress
52 Terms
Covariate
An extraneous or confounding variable that can affect the outcome variable.
ANCOVA
Analysis of covariance; an ANOVA that controls for covariates using adjusted means.
MANOVA
Tests for differences between groups when there are multiple dependent variables.
MANOVA Advantages
Controls familywise error rate and accounts for relationships among dependent variables.
Discriminant function analysis
used to determine which of the DV's are best at discriminating (which is the best at separating DV's into groups)
What is the relationship between raters' scores
inter-rater reliability
What is the relationship between the two sets of scores from the same rater
intra-rater reliability
What is the relationship between gait speeds captured by the Vicon in patients following a stroke at time 1 and again at time 2....can each of the patients walk at about the same speed
test-retest reliability
Are the items in a test or survey consistent with each other
internal consistency
Can a score on one outcome measure predict another outcome measure
predictive validity
Can two different outcome measures get similar results at the same time
concurrent validity
Can two different outcome measures (one is a gold standard) get similar results
criterion validity
Can sub-groups of items in an outcome measure explain factors of the same complex construct....such as satisfaction, coordination, etc.
construct validity
Pearson Correlation (r)
Measures strength and direction of a linear relationship between two interval/ratio variables.
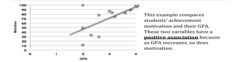
Pearson Correlation must have
quantitative data
Pearson r Range
Ranges from -1.00 (perfect negative) to +1.00 (perfect positive).
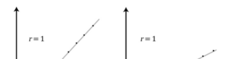
Pearson r Effect Sizes
Small is ±0.1, medium is ±0.3, and large is ±0.5.
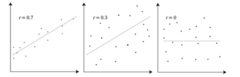
Coefficient of Determination (r²)
The proportion of variability in one variable predicted by the other variable.
r=0 therefore r²=
0 (two circles don't touch)
r=.8 therefore r²=
.64 (two circles overlap 64%)
r=1.0 therefore r²=
1.00 (two circles overlap 100%)
Correlation vs. Agreement
Correlation measures association, not how closely the actual values agree.
Point-Biserial Correlation (rpb)
Measures relationship between two levels of a categorical variable and an interval/ratio variable.
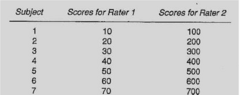
Spearman Rank Correlation (rs)
Non-parametric equivalent to Pearson's correlation, used with ordinal or ranked data.
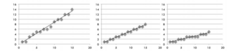
Intraclass Correlation Coefficient (ICC)
Reliability coefficient for multiple raters; measures agreement or association.
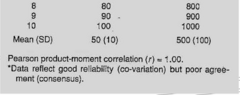
Agreement vs Consistency
Agreement - use fewer options to rate (scale of 1-3: "no, maybe, yes")
Consistency - use more options to rate, looking for similar rating (exact gait speed)
Standard Error of the Mean (SEM)
Measures how accurately a sample mean represents the population mean.
Standard Error of Measurement (SEmeasurement or SEm)
Estimates expected measurement error around a patient's true score.
Regression
A statistical technique used to predict an outcome variable from predictors.
Linear regression
one predictor, one I/R outcome
Multiple linear regression
multiple predictor, one I/R outcome
Logistic regression
1+ predictors, one categorical outcome, two levels only
Multinomial logistic regression
1+ predictors, one categorical outcome, multiple levels
Ordinal logistic regression
1+ predictors, one ordinal outcome, multiple levels
Homoscedasticity
The assumption that outcome variance is equal across all predictor levels. Creates a residual, the residual score is the distance from the score (Y) and the line (Y') that the data points create.
Homoscedasticity values
Similar to a z score...
+1 represents one standard deviation above the model line.
-1 represents one standard deviation below the model line.
0 represents a score on the model line.
Linearity
The data points are arranged in a somewhat linear pattern.
Curvilinear
The data points are arranged in a somewhat curved pattern (lots of errors)
Skewness/kurtosis values
>+2 or
Standardized Residual
A residual score converted to standard deviations to identify outliers.
Cook's Distance
A statistical test evaluating an outlier's influence on a regression model. Scores of >+1 are a problem
Shapiro-Wilk
Measures normality. Values less than alpha indicate there is statistical evidence that your data is not normally distributed. p < alpha = bad/non-normal
Levene's Test
Measures HOV. Values less than alpha indicate that your group variances are significantly different from one another. p < alpha = bad/significant difference
Multicollinearity
High correlations (r > 0.9) among multiple predictors in a model.
Variance inflation factor (VIF) and Tolerance
Multicollinearity diagnostics; VIF should be < 10, Tolerance > 0.1.
Durbin-Watson Test
Checks the assumption of independence of observations in regression. Values range from 0-4 and 2 is perfect
Cronbach's Alpha
Measures internal consistency of a scale; 0.7 is acceptable, 0.8 is good.
Kappa (K)
Measures inter-rater agreement for nominal data, accounting for chance.
Chi-Square Test for Independence
Tests whether two nominal variables are independent of one another.
Exploratory Factor Analysis (EFA)
Identifies underlying constructs or factors by analyzing correlations among items.
Minimal Detectable Change (MDC)
Minimal change falling outside measurement error; considered real but not necessarily meaningful.
Minimally Clinically Important Difference (MCID)
The smallest change in a score that is meaningful to the patient.