4.1 Species, communities, and ecosystems
1/3
There's no tags or description
Looks like no tags are added yet.
Name | Mastery | Learn | Test | Matching | Spaced | Call with Kai |
|---|
No study sessions yet.
4 Terms
Outline how we can classify organisms on a micro (per organism) and macro scale (groups).
Micro: Based on method of nutrition.
Autotroph: Obtain inorganic nutrients from the abiotic environment. (e.g. plants)
Heterotroph: Obtain organic molecules from other organisms, more specifically…
Consumer: Living/ recently killed organisms by ingestion. (e.g. lions)
Detritivore: Detritus (decomposing plant & animal parts/faeces) by internal digestion. (e.g. earthworms)
Saprotroph: Dead organisms by external digestion. (e.g. fungi like mushrooms)
Mixotroph: Use both autotrophic and heterotrophic methods of nutrition. (e.g. venus flytrap)
Macro:
Species: Groups of organisms that can potentially interbreed to produce fertile offspring.
Not reproductively isolated: Live in same population, able to and likely to interbreed
Reproductively isolated: Live in different populations, able to but unlikely to interbreed
Population: Many individuals of the same species occupying the same habitat
Community: Multiple populations of different species living together and interacting
Habitat: Area where an organisms lives
Ecosystem: Community + Abiotic factors in the environment together
Explain how nutrients are recycled in an ecosystem.
The supply of inorganic nutrients is maintained by nutrient cycling.
Autotrophs obtain inorganic nutrients from the abiotic environment, and convert them into organic compounds.
Heterotrophs ingest these organic compounds and use them for growth and respiration, releasing inorganic byproducts.
When organisms die, saprotrophs decompose the remains, releasing free inorganic materials into the soil.
The return of inorganic nutrients to the soil ensures the continual supply of raw materials for the autotrophs.
Hence, giving ecosystems the potential to be sustainable over long periods of time.
Describe how to test for association between two species.
Steps:
Define hypothesis:
Null hypothesis (H0): No significant difference between distribution of two species. (Random distribution)
Alternative hypothesis (H1): Significant difference between distribution of two species. (Associated)
Set up Quadrat sampling:
Place quadrat repeatedly in a sample area systematically (belt transect).
Calculate association using chi-squared test:
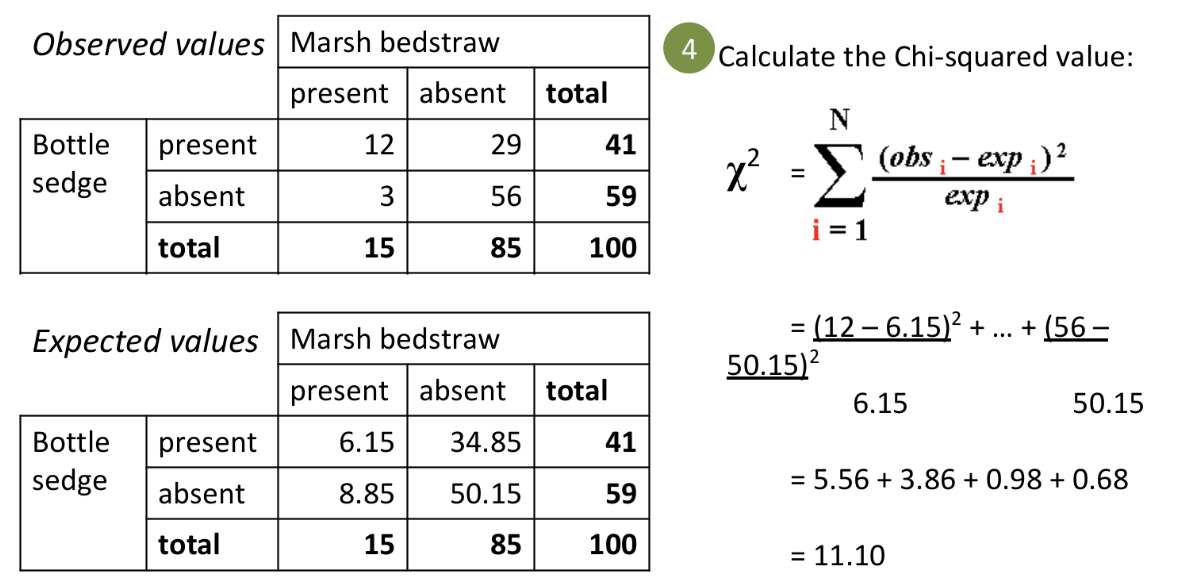
Complete table of observed values (see image).
Calculate expected values (what you would expect to find if H0 is true).
Expected value = (row total x column total)/grand total
Calculate Chi-squared value. (see image)
Determine degrees of freedom.
Degrees of freedom = (rows - 1)x(columns-1)
Compare x² value with ‘critical values’.
If p < 0.05 or more certain, H1 is true (statistically significant).

Filler.
Filler.