Climate Change
1/67
There's no tags or description
Looks like no tags are added yet.
Name | Mastery | Learn | Test | Matching | Spaced |
|---|
No study sessions yet.
68 Terms
Typhoon vs Hurricane
Typhoon - strong tropical depression that developed in northern pacific
Hurricane - strong topical depression that developed in the north atlantic
Storm Surge
a rise in sea level due to a storm, often leading to coastal flooding
Climate
average conditions and changes (pattern) in the atmosphere over a long span of time (>30 years) in a locality or region
Weather
average conditions and changes (pattern) in the atmosphere over a short span of time (<30 years; minutes, hours, days, weeks) in a locality or region
Average Conditions in the Atmosphere
Temperature
Precipitation
Air Pressure
Sunshine
Humidity
Wind Speed
Cloud Cover
Visibility
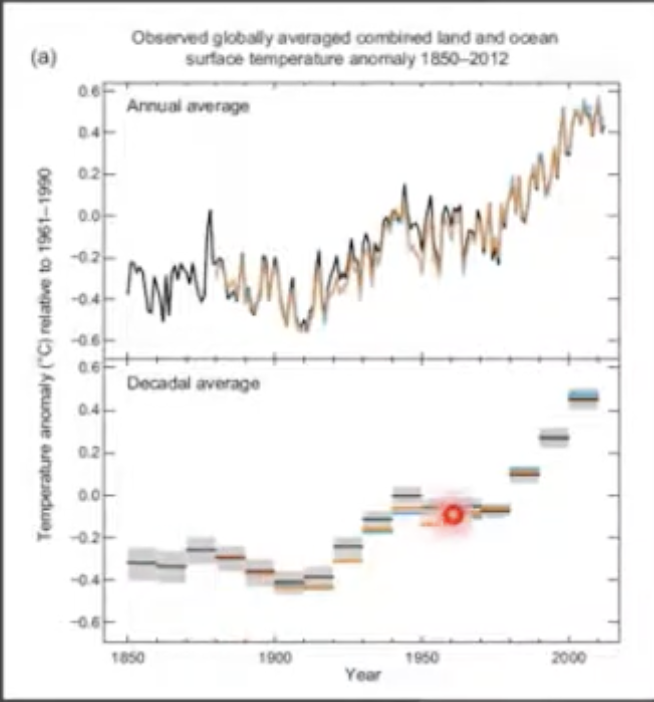
Trends in Climate Change
The mean global surface temperature has increased by about 0.3 to 0.60C since the late 19th century and by about 0.2 to 0.3°C over the last 40 years, which is the period with the most reliable data. Recent years have been among the warmest since the 1860s.
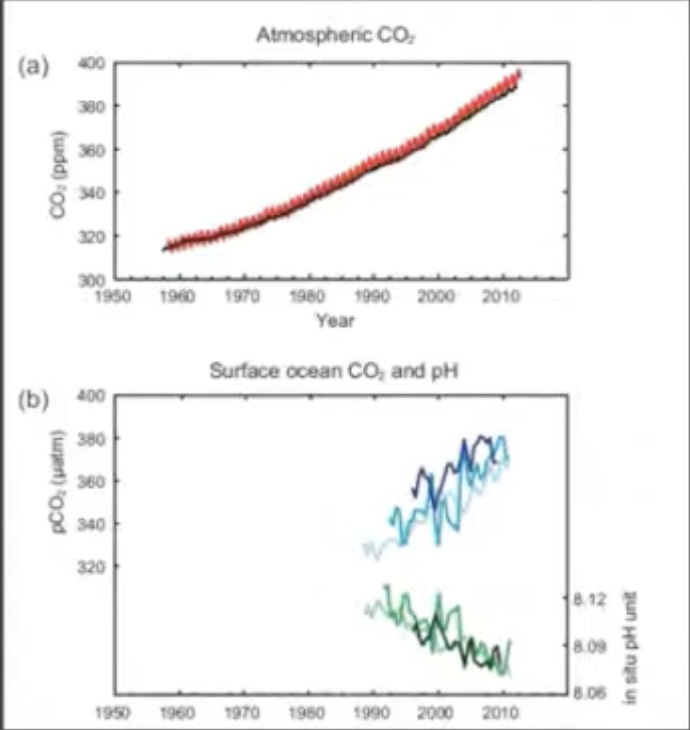
Trends in Climate Change
Atmospheric concentrations of CO2 are increasing. The mean concentration of approximately 316 parts per million per volume (ppmv) in 1958 rose to approximately 369 ppmv in 1998.
Trends in Climate Change
Glacial Ice Volume has been decreasing.
Trends in Climate Change
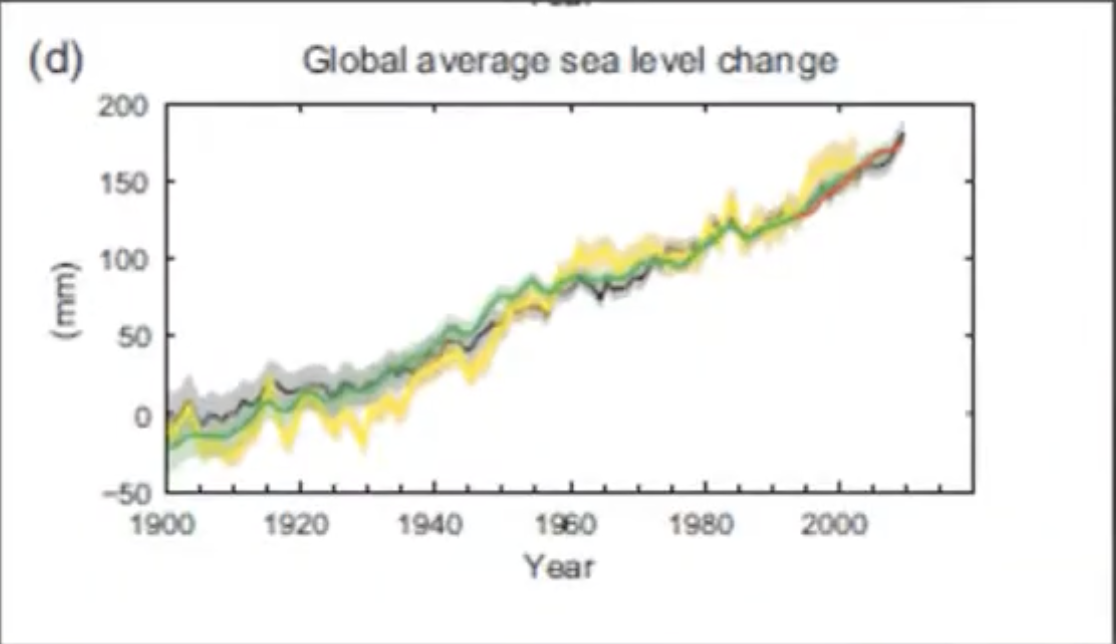
Over the last 100 years, sea level has risen by about 10 to 25 cm.
Trends in Climate Change
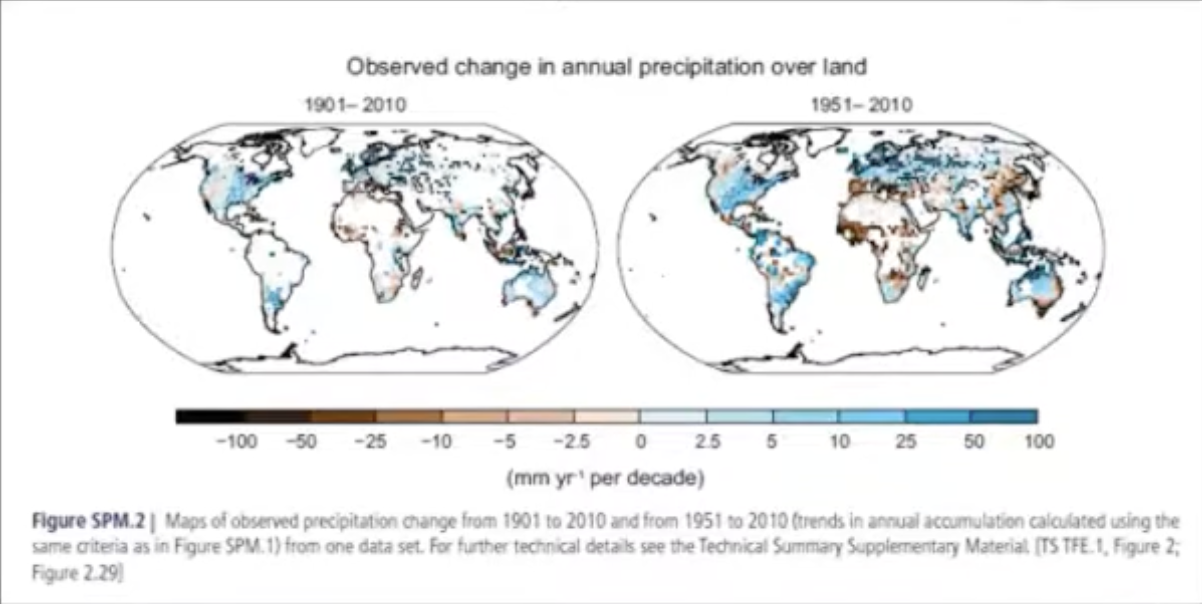
Increase in climate variability or extremes in the recent decade. The global water cycle has changed, with increases in disparity between wet and dry regions
Trends in Climate Change (Summary)
increase in mean global surface temperature
increase in Atmospheric concentrations of CO2
decrease in Glacial Ice Volume
rise in sea level
increase in climate variability or extremes
Why are there trends in Climate Change?
Greenhouse Warming
Atmospheric CO2 has increased from pre-industrial concentration of about 220 ppmv to about 367 ppmv at present. It is evident that the rapid increase in CO2 concentrations has been occurring since the onset of industrialization. The increase has slowly followed the increase in CO2 emissions from the burning of fossil fuels.
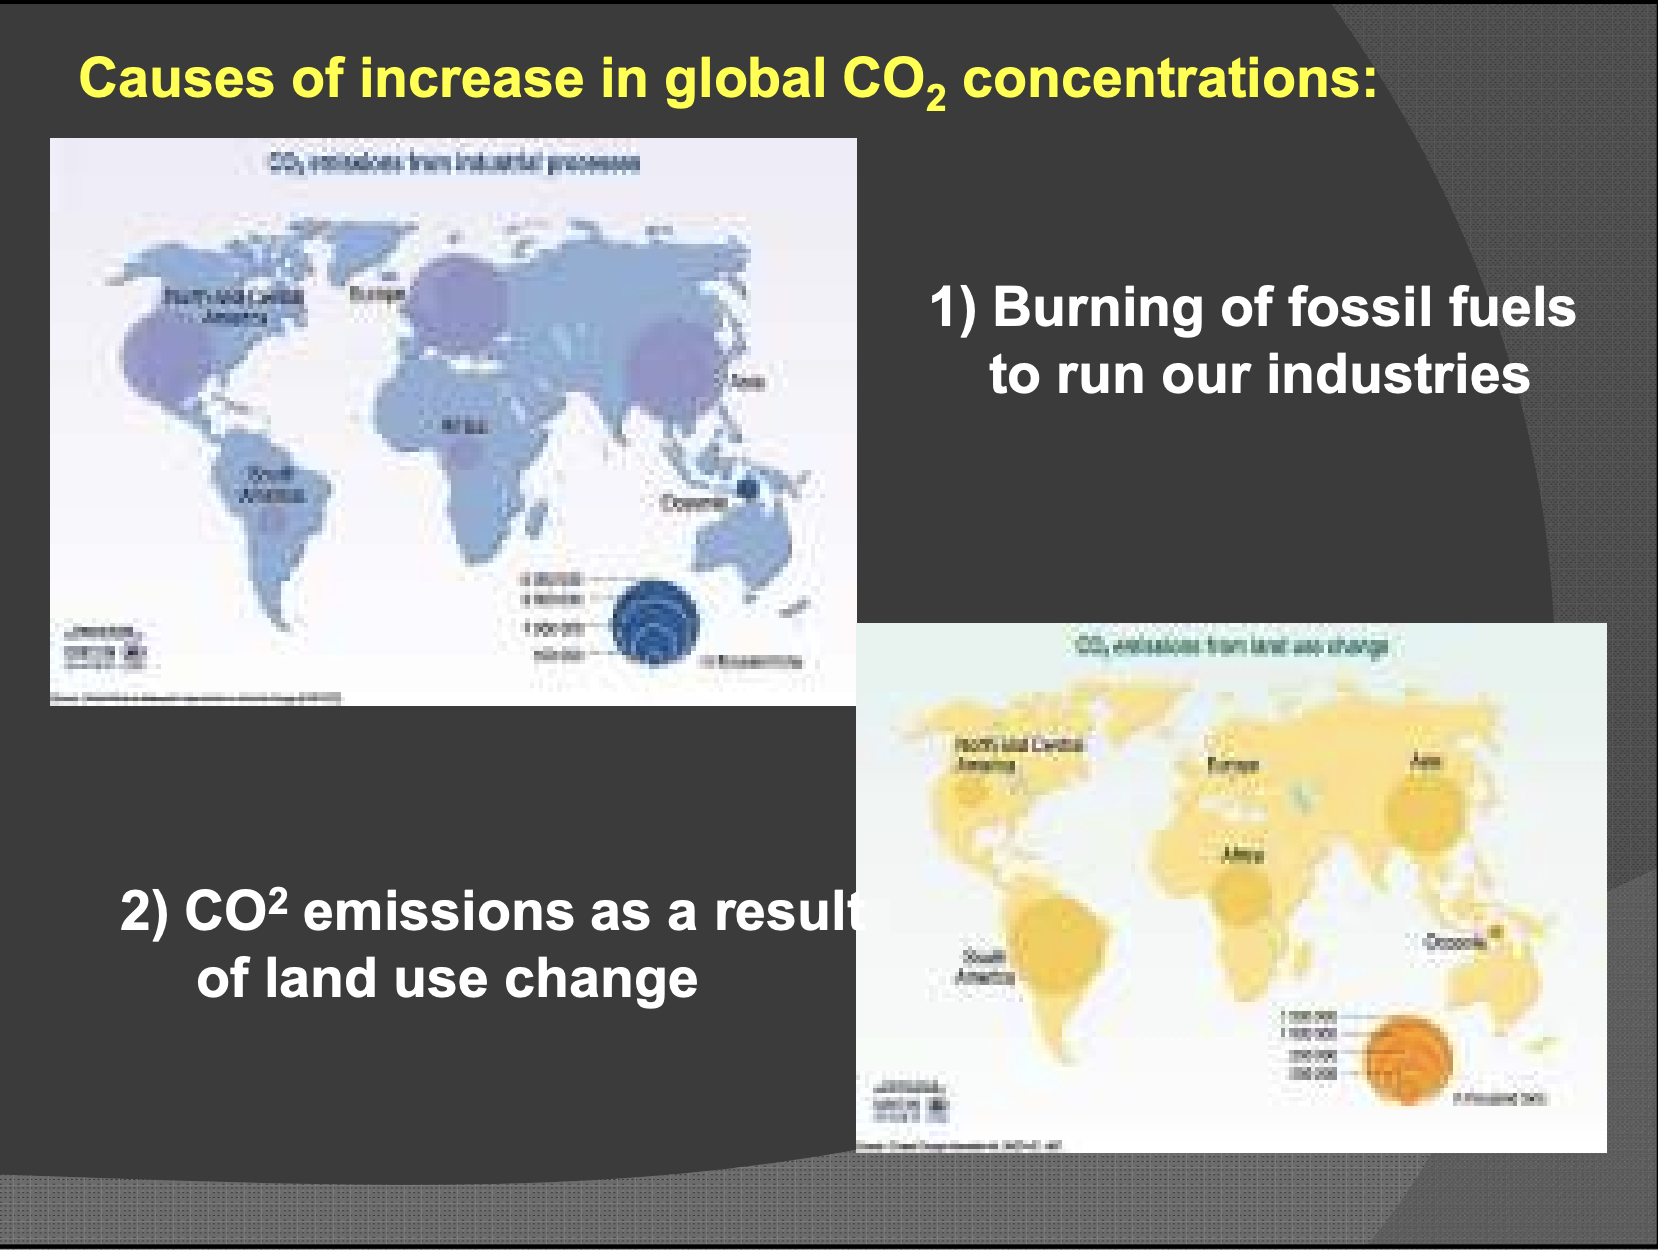
Causes of increase in global CO2 concentrations
Burning of fossil fuels to run our industries
CO2 emissions as a result of land use change
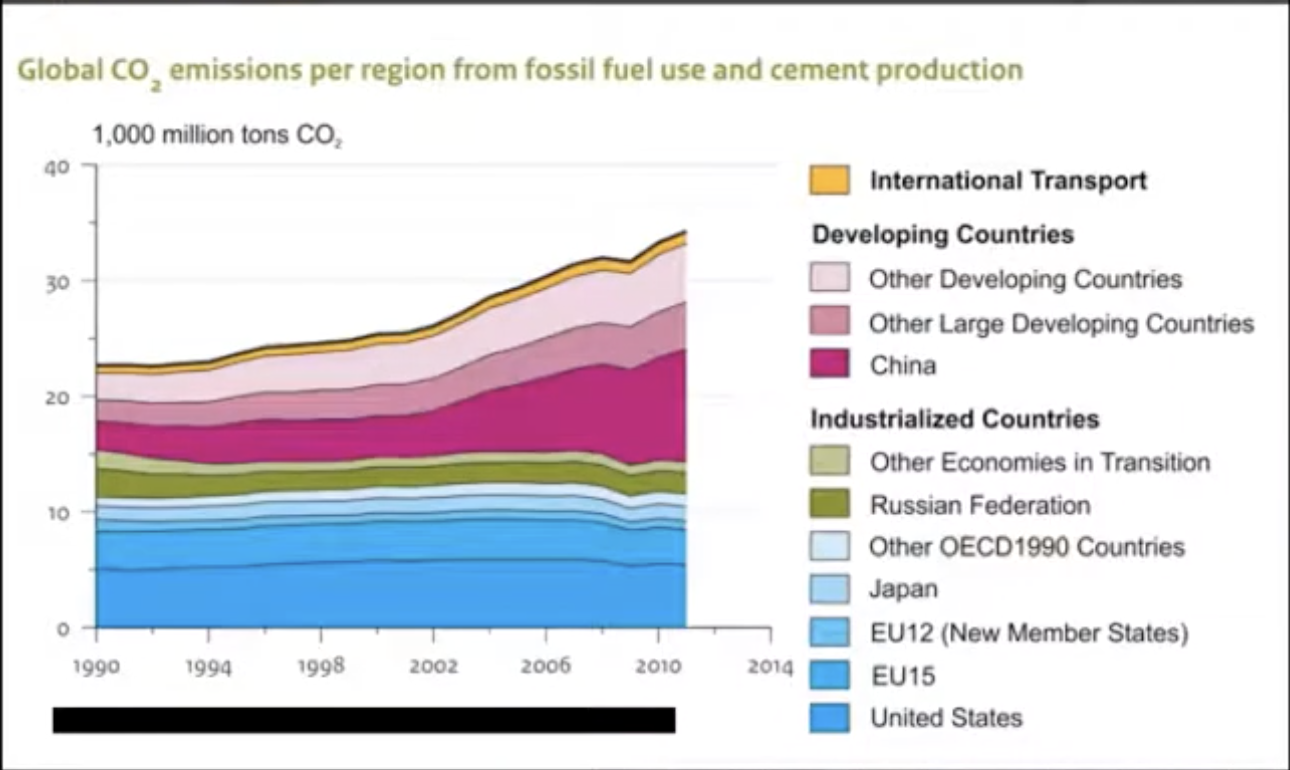
The present Global CO2 emissions
The present Global CO2 emissions from fossil fuel use and cement production.
International Transport produces a lot of CO2
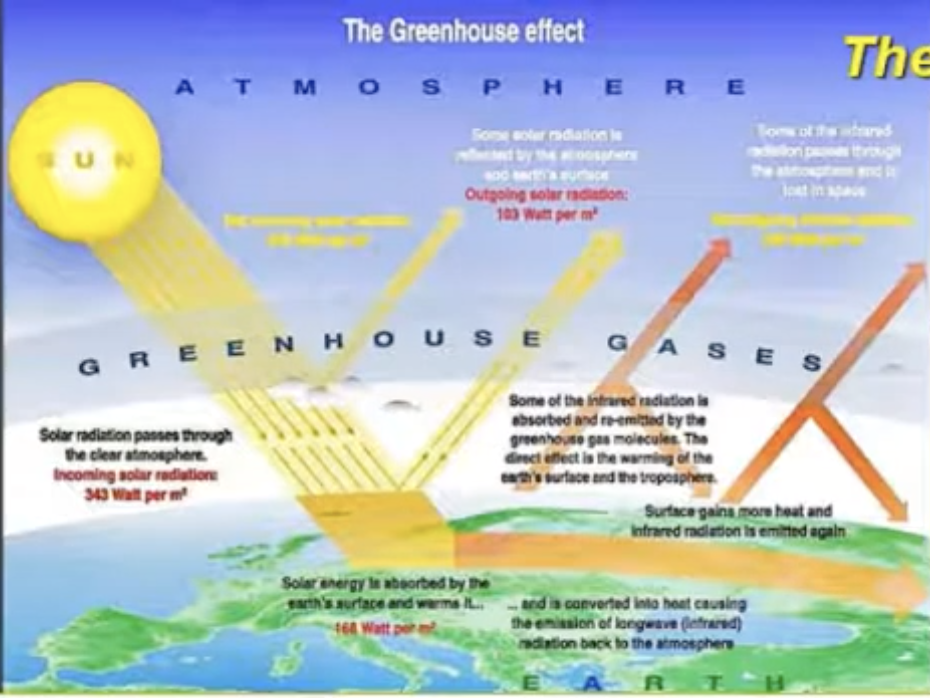
Process of Greenhouse Effect
Incoming solar radiation in terms of electromagnetic waves. Part of this heat is directly reflected back to space by clouds. Those waves that penetrate the atmosphere, part of the heat are reflected directly by the surface (planetary albedo.) Those that are absorbed by the surface of the Earth are re-radiated back in the form of infrared radiation. Because of greenhouse gases, the supposed re-radiated infrared radiation is absorbed and heats up the atmosphere or surface of the Earth. The more greenhouse gasses, the greater the absorption.
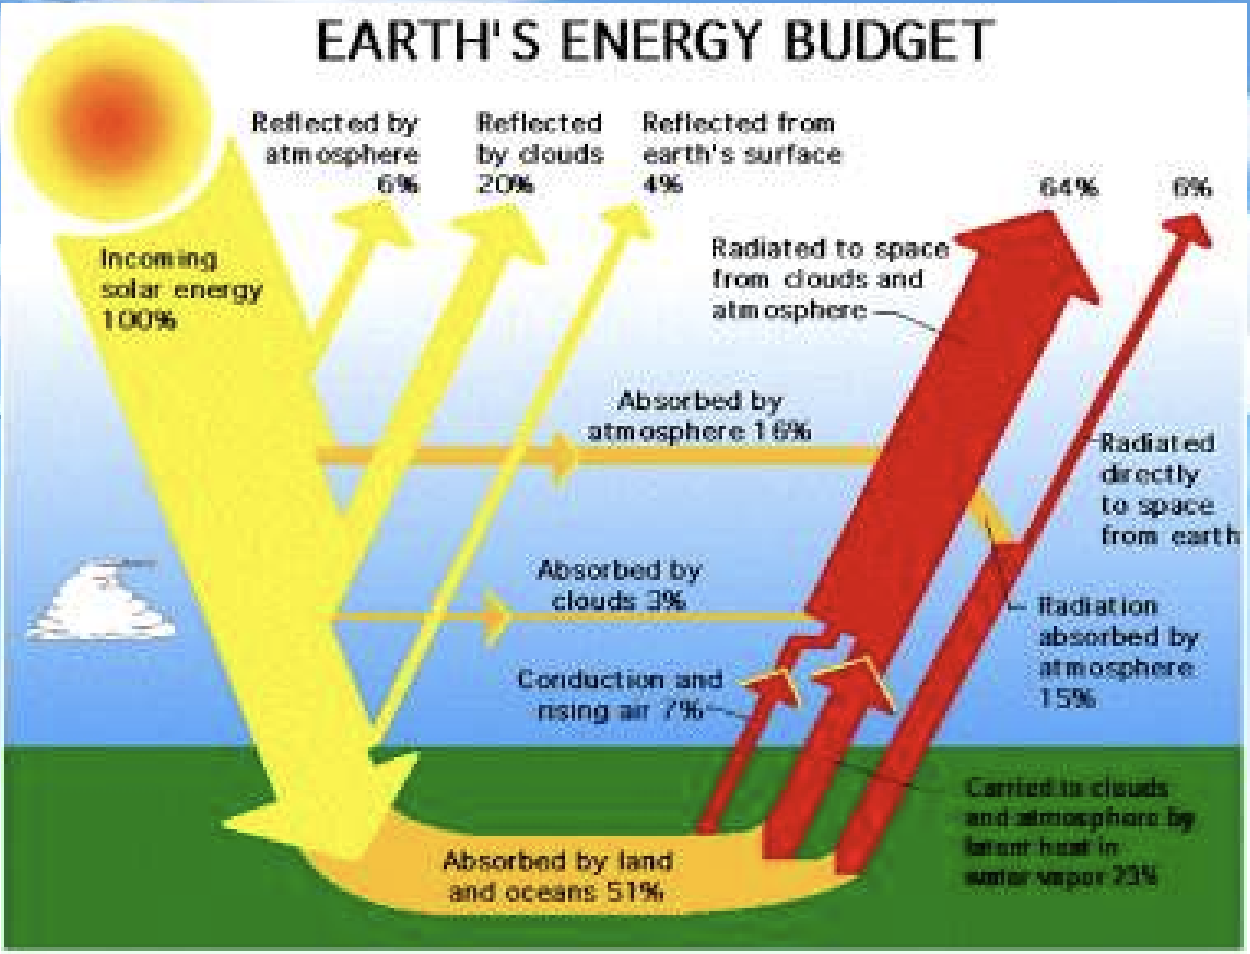
On average, about 1/3 of the solar radiation: reflected back to space. The rest: Absorbed by the atmosphere, atmosphere, but most is absorbed by the land and oceans. The Earth's surface becomes warm, and as a result, it emits infrared radiation. The natural greenhouse gases (H2O, CO2 , O3 , CH4 and N2O) trap the infrared radiation, warming the atmosphere. BUT: Human activities are causing greenhouse gas concentrations to increase.
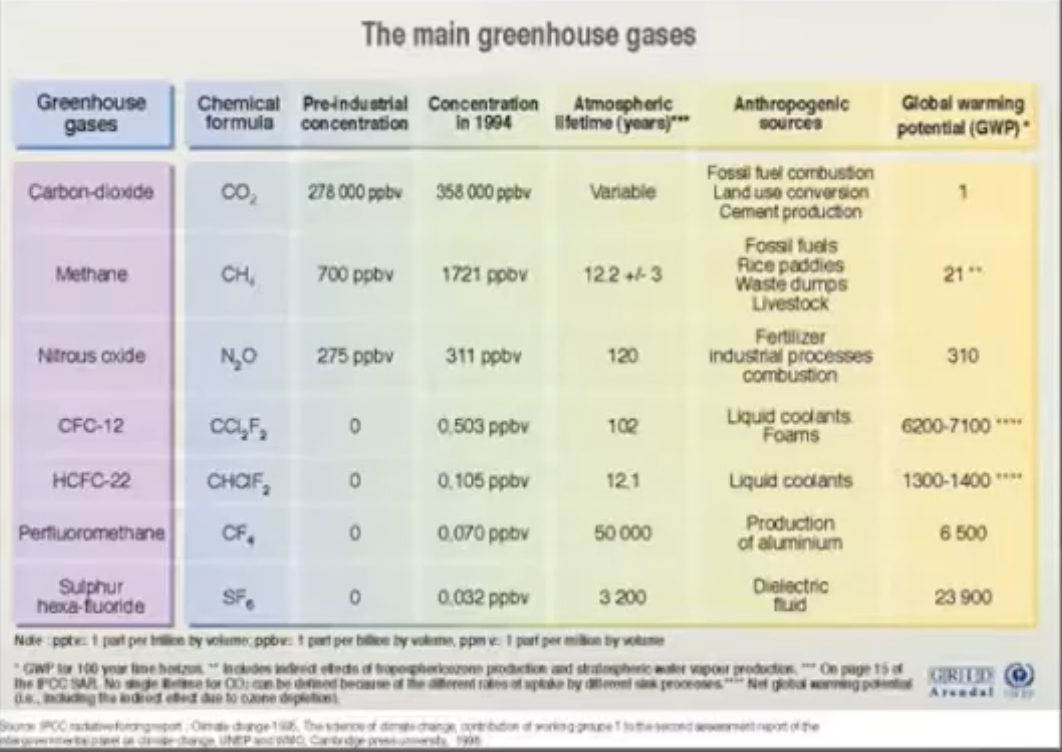
Greenhouse Gases
Carbon-dioxide
Methane
Nitrous Oxide
CFC-12
HCFC-22
Perfluoromethane
Sulphur hexa-flouride
The roles of aerosols and albedo (does the reverse of global warming)
Sulfur dioxide in the atmosphere increases the reflectivity of clouds, increasing albedo. Sources of aerosols include volcanic eruptions, the burning of forest, desert areas, industries, barren lands, ice, and snow which all increases reflectivity.
Mount Pinatubo Erruption in 1991
Second largest eruption in the century
10 km³ of magma and 20M tons of sulfur dioxide SO2 (aerosol)
This ash plume went around the globe and stayed for around 2 years which led to global cooling
Caused a drop in temperature by 0.2 degrees but only for 2 years
CO2 - warming
SO2 - cooling
IPCC - Intergovernmental Panel on Climate Change
The ____ provides an internationally accepted authority on climate change, producing reports which have the agreement of leading climate scientists and the consensus of participating governments.
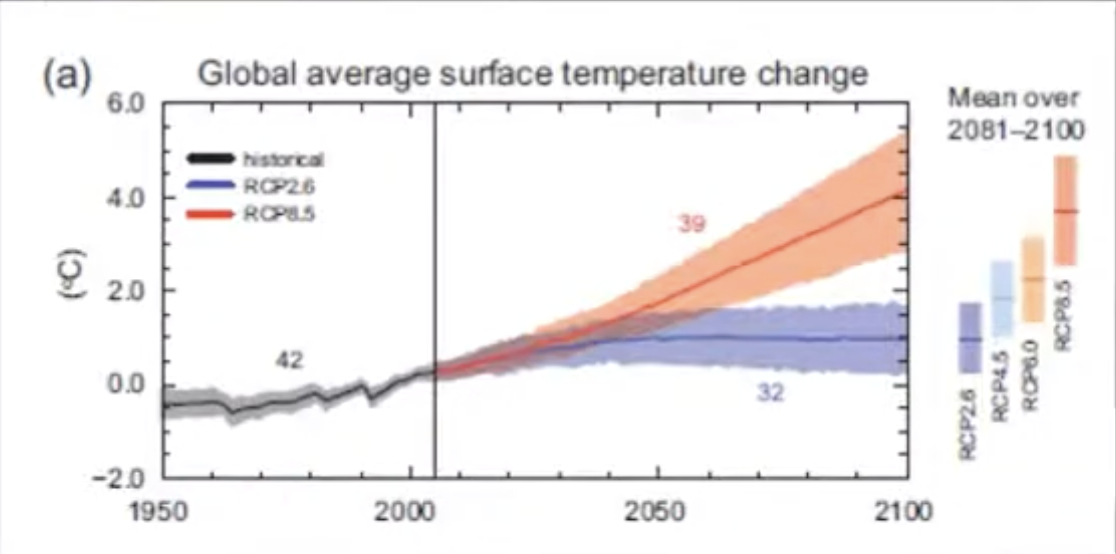
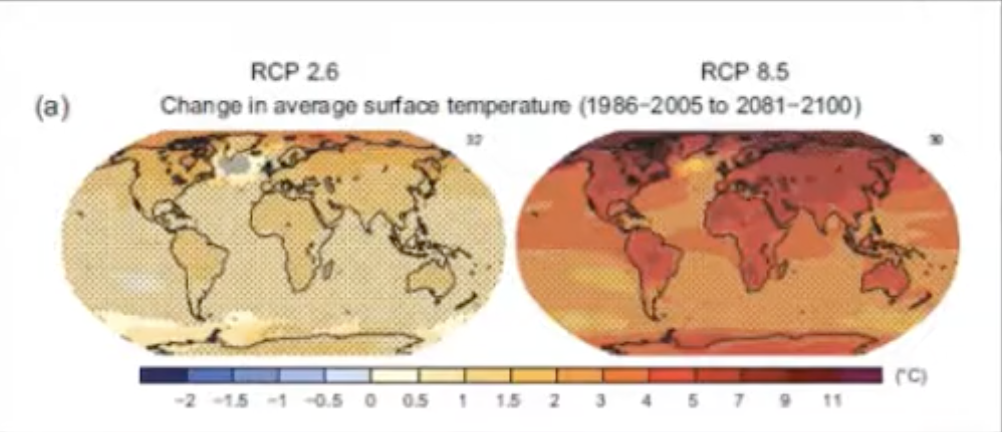
Predictions if Global Warming is not stopped
The global surface temperature increase by the end of the 21st century is likely to exceed 1.5 °C relative to the 1850 to 1900 period for most scenarios, and is likely to exceed 2.0 °C for many scenarios
Predictions if Global Warming is not stopped
The oceans will continue to warm, with heat extending to the deep ocean, affecting circulation patterns.
Predictions if Global Warming is not stopped
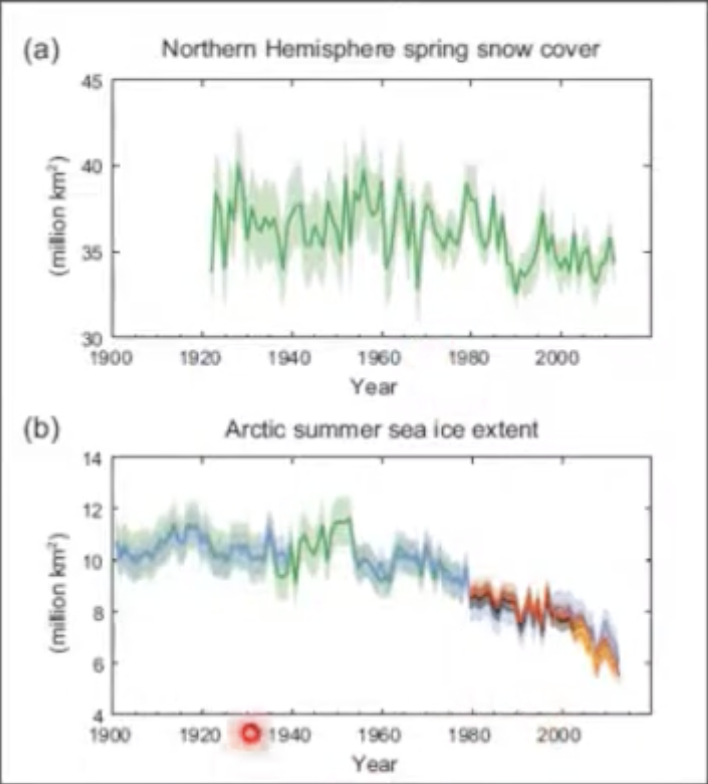
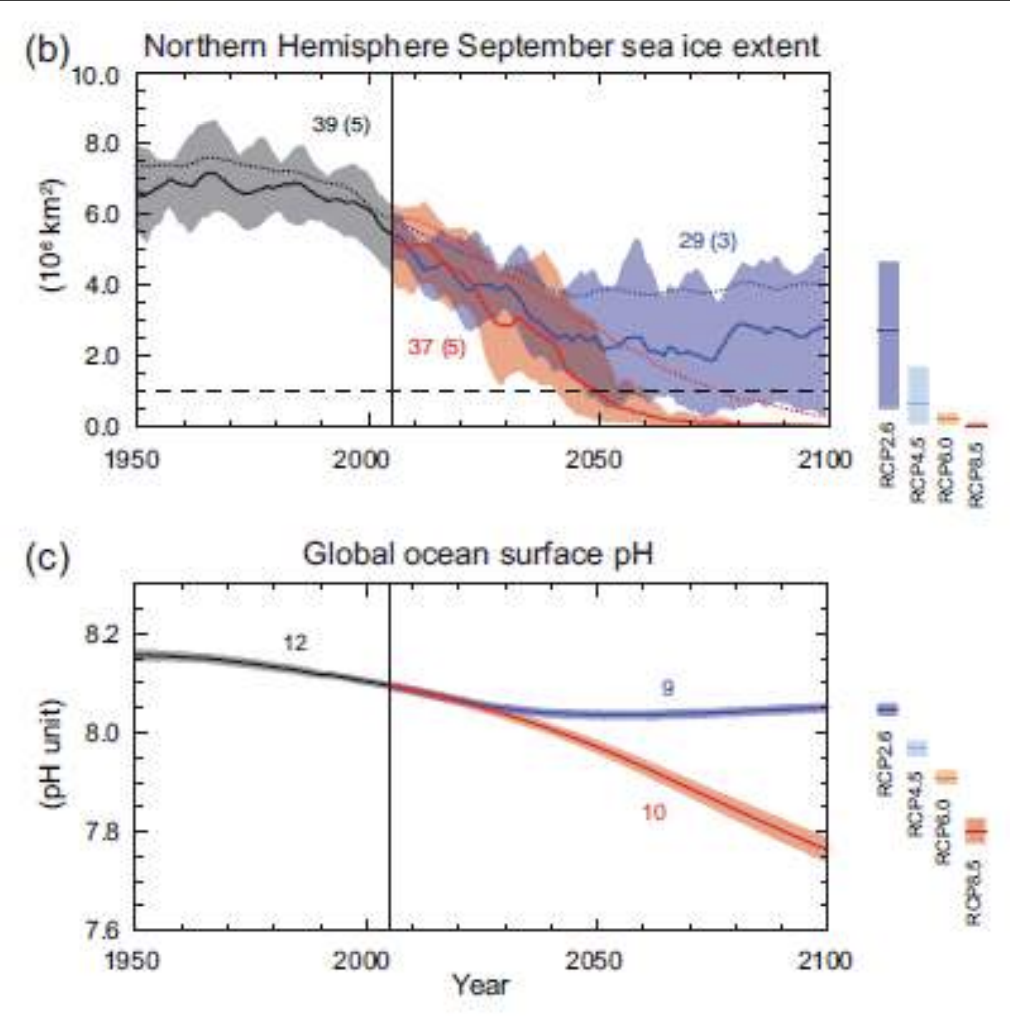
Decreases are very likely in Arctic sea ice cover, Northern Hemisphere spring snow cover, and global glacier volume
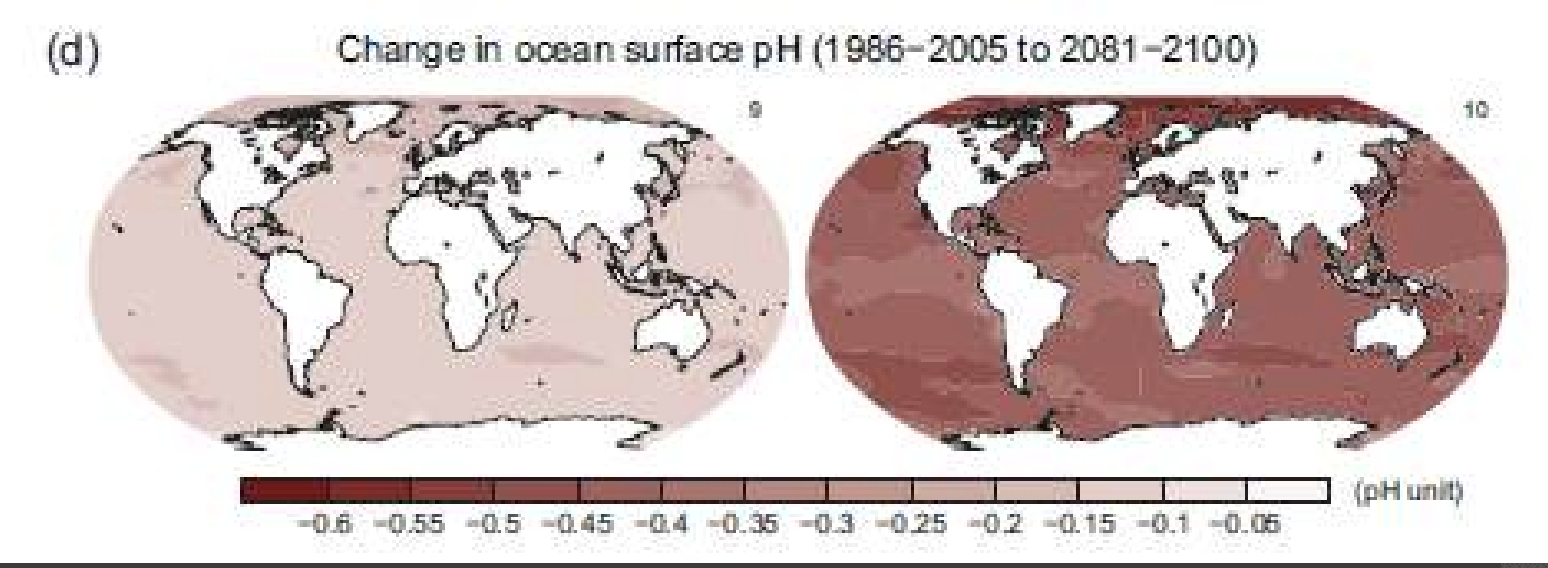
Increase in CO2 in the atmosphere therefore ocean ph drops, increasing acidity of the ocean waters, impacting organisms such as corals that secrete calcium carbonate.
Predictions if Global Warming is not stopped
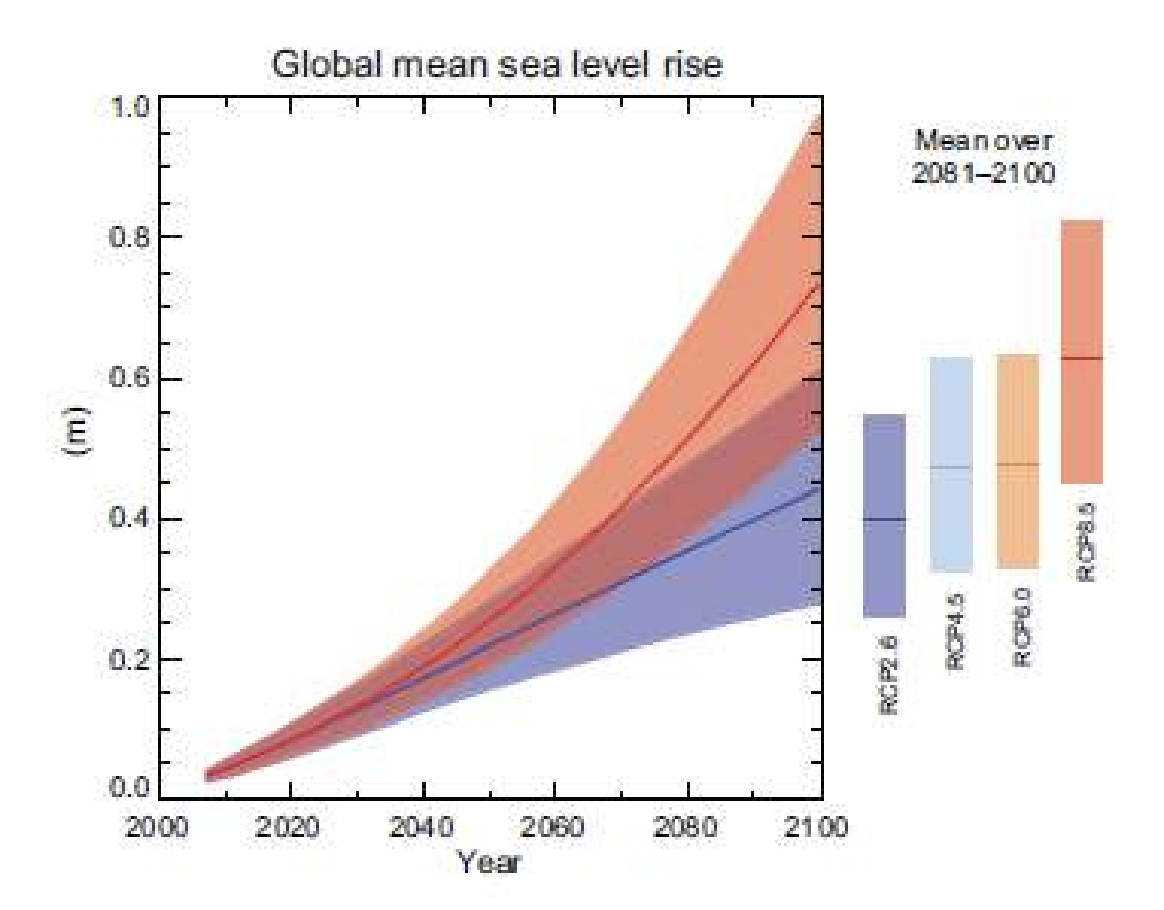
Global mean sea level will continue to rise at a rate very likely to exceed the rate of the past four decades. Climate models calculate that the sea level may rise from 20 to 100 cm.
Predictions if Global Warming is not stopped
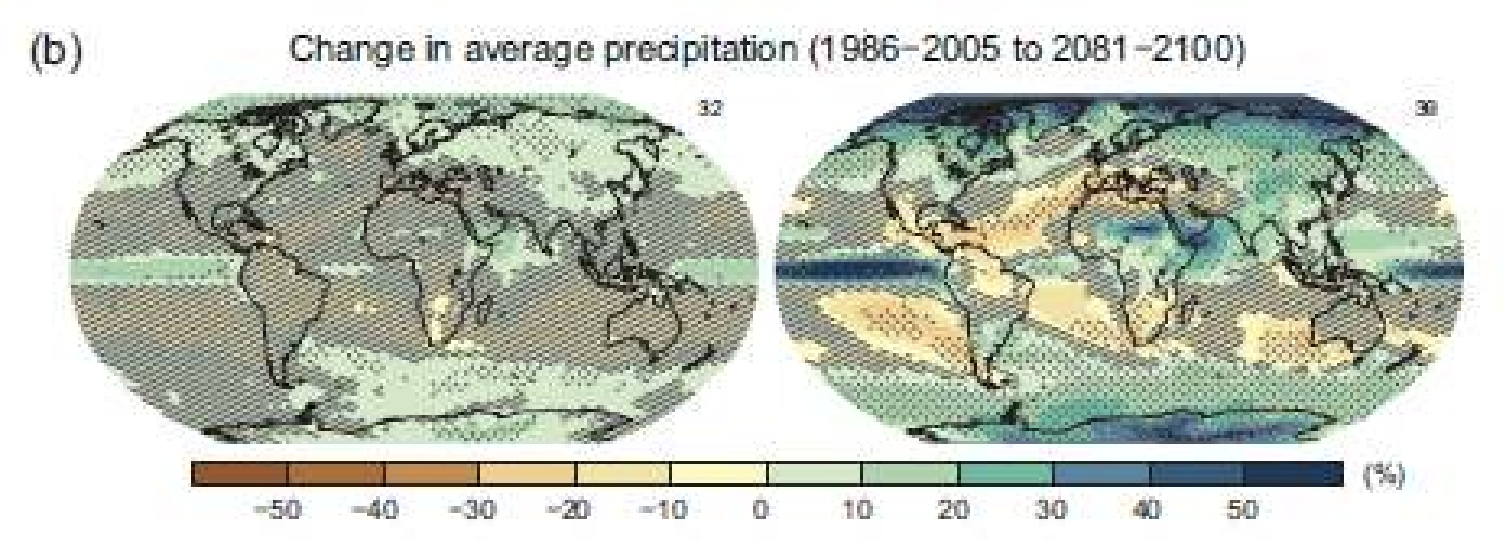
The global water cycle will change, with increases in disparity between wet and dry regions, as well as wet and dry seasons, with some regional exceptions.
Predictions if Global Warming is not stopped
Ocean Acidification – the oceans as a sink for CO2 .
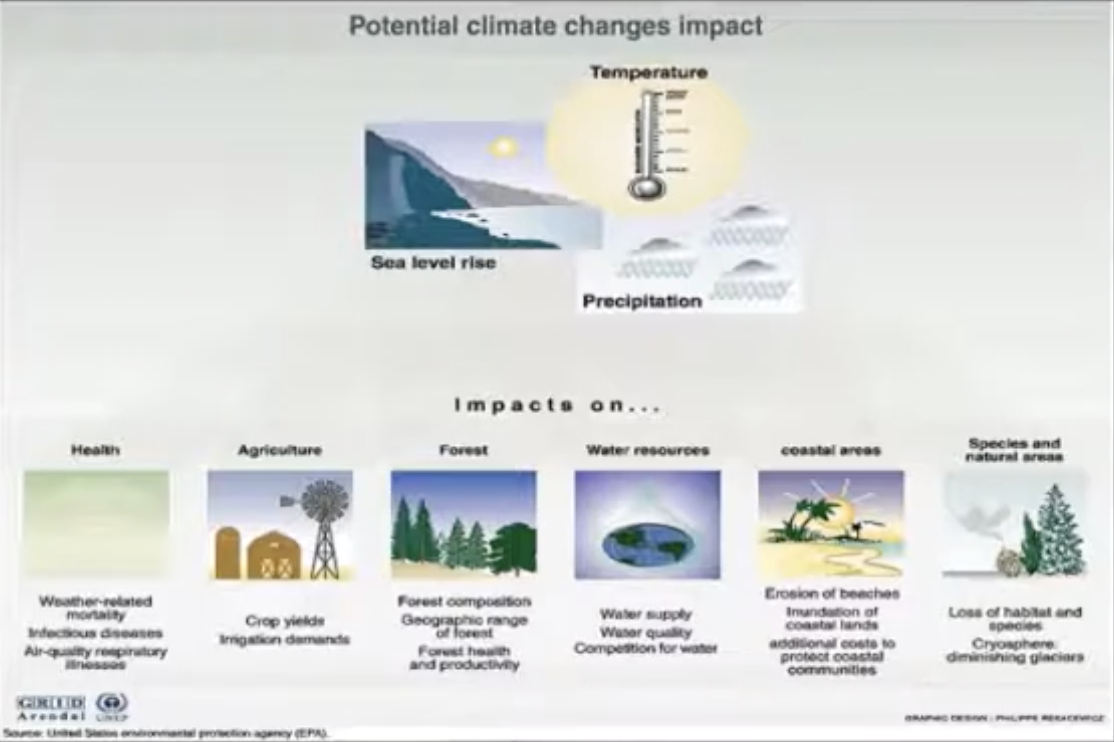
Potential climate changes impact
Health
Agriculture
Forest
Water Resources
Coastal Areas
Species and Natural Areas
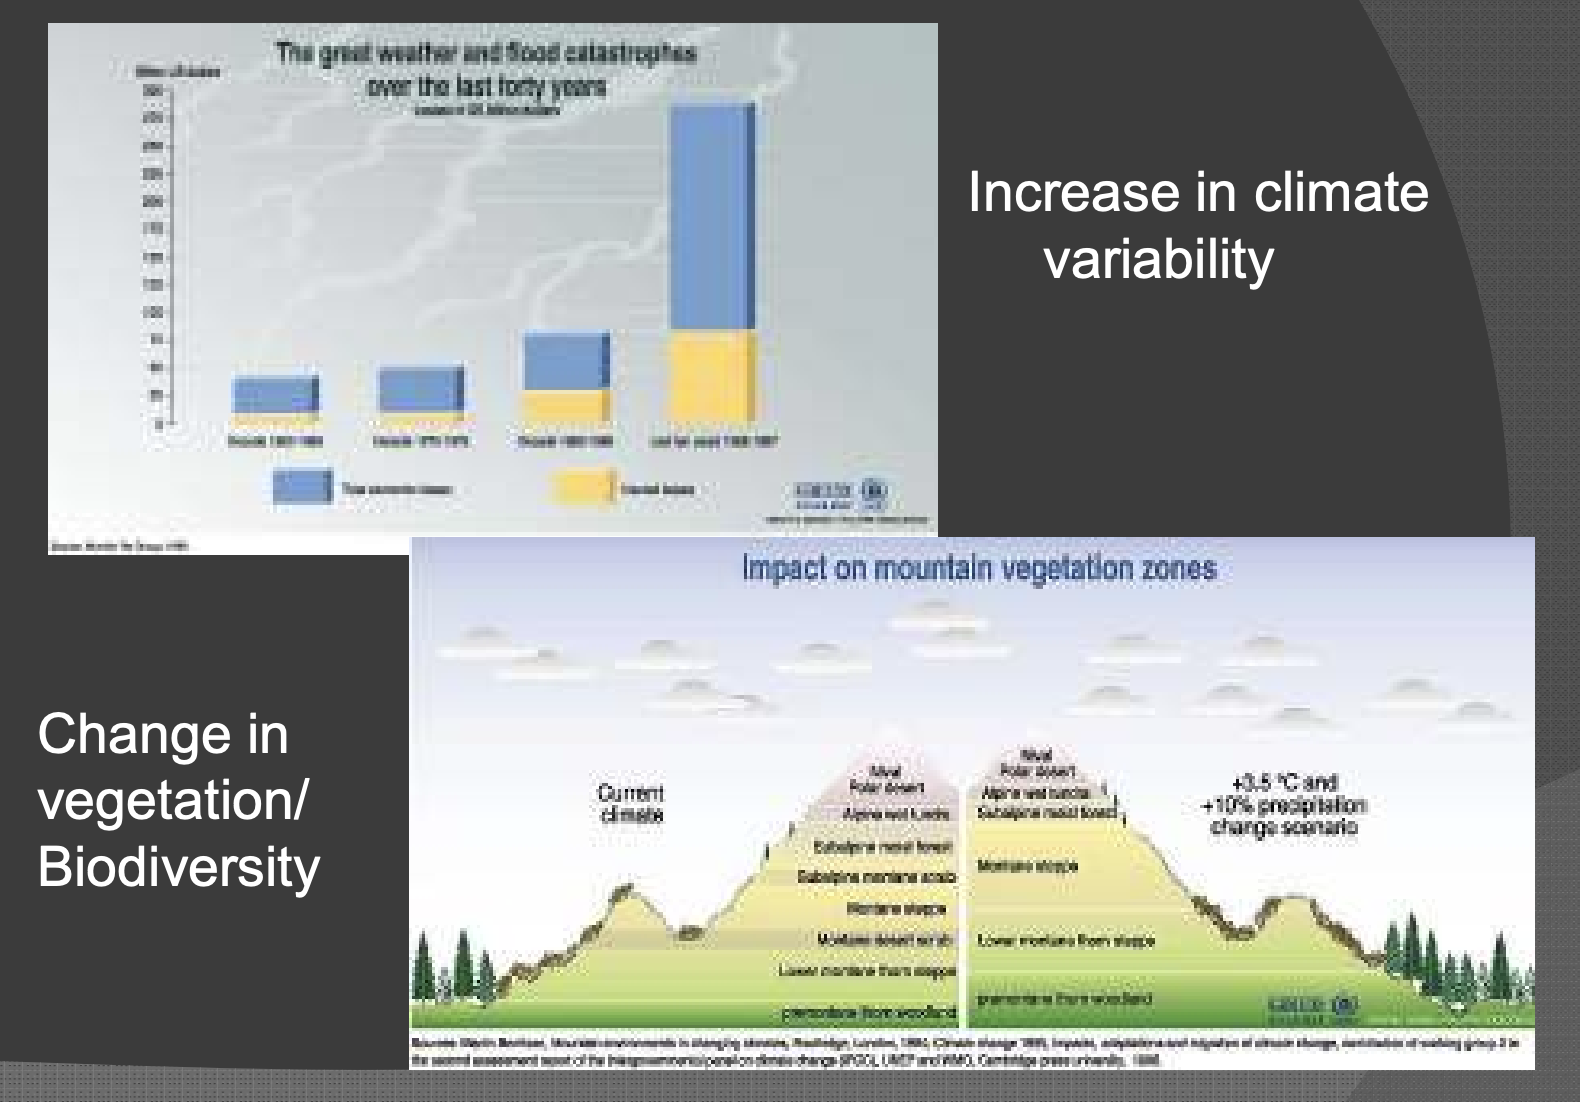
Result of global rise in temperature
Increase in climate variability
Change in vegetation/ Biodiversity
What is ENSO?
El nino southern oscillation (ENSO)
Earth’s energy budget
The energy being emitted by the sun is in the form of electromagnetic waves. Part of the energy that reaches the earth is directly reflected back into the atmosphere, reflected back by clouds or even the earth (planetary albedo) The part that reaches the surface of the earth, heats up the surface and is then re-radiated back in the form of infrared radiation.
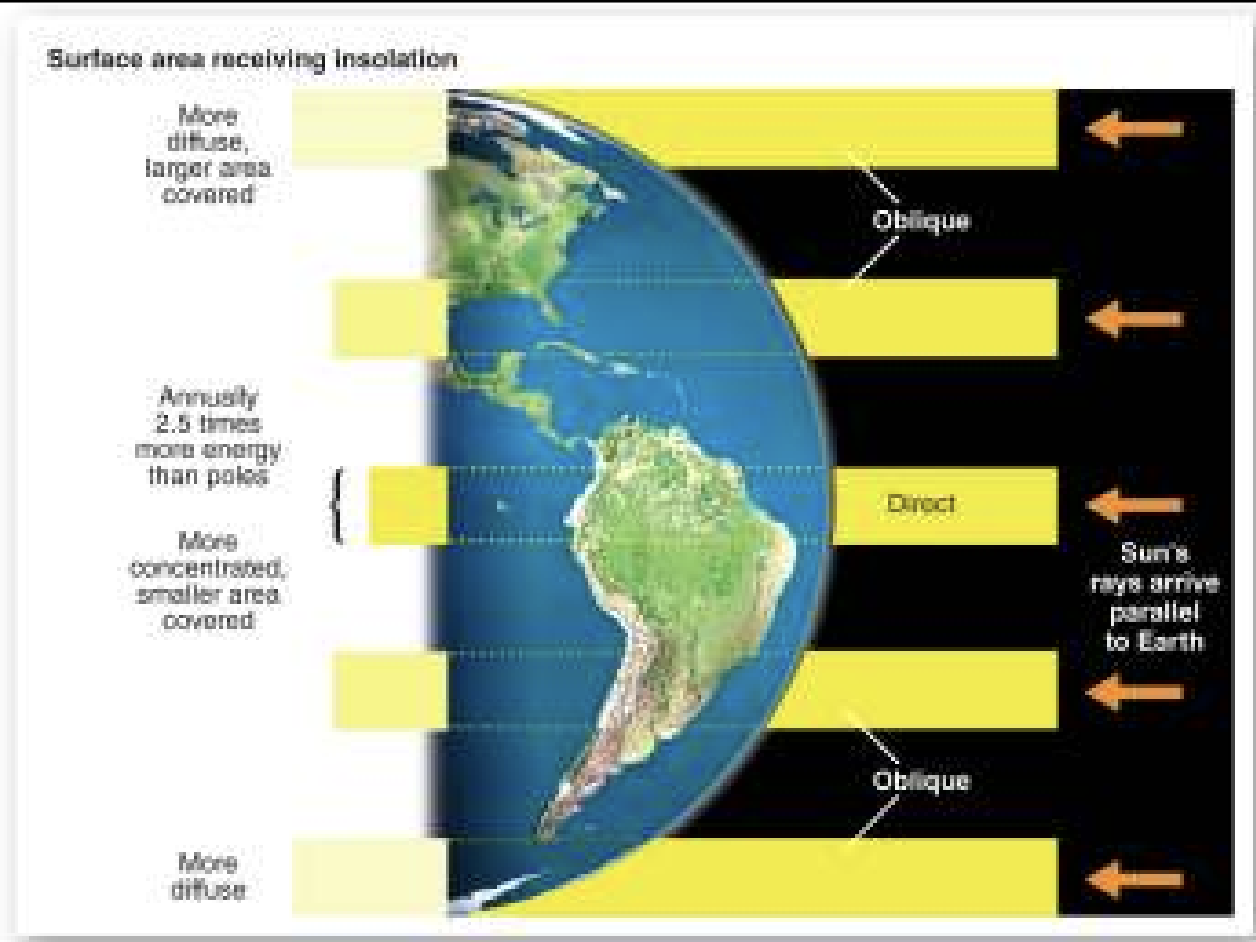
Differential heating of the Earth’s surface
Since the sun is so far away, we can assume that the sun’s rays are travelling along parallel lines. Because of the curvature of earth, the sun’s rays gets into contact with the surface of the earth at different angles. They are nearly perpendicular near the equator. As we go from the equator to the poles it becomes more and more oblique. This has a consequence with regard to amount of heating at the equator, for the same ray of light, it will heat up a smaller surface area so it's more concentrated. Contrary to that, as we go through the poles, the energy is dispersed over a larger area. More heating at the equator less and less at the poles
imbalance
Differential Heating of the Earth’s Surface leads to ____.
how does the Earth redistribute heat
1. Atmospheric Circulation
2. Ocean Circulation
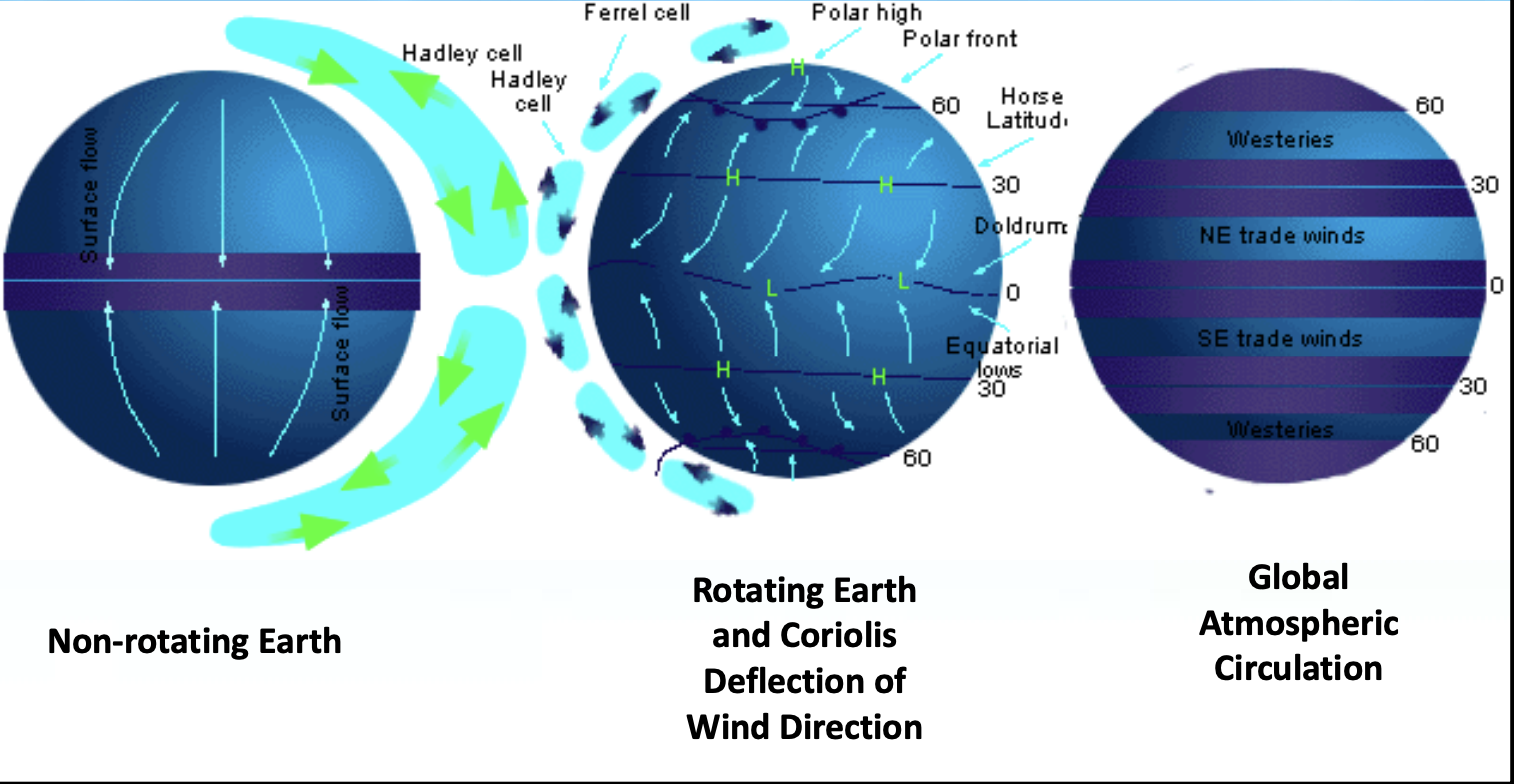
Atmospheric Circulation
Heat is redistributed by atmospheric convection. Hot air rises, and cold air descends. For a non-rotating Earth, a simple equator to pole convection is produced.
Warming of the air near the equator which contains a lot of moisture therefore creating a low pressure area.
Hadley Cell
meridional (from one latitude to another) type of atmosphereic circulation
Warm air converges on the equator and rises forming a belt of low pressure. The humidity of the air increases as it cools down during ascent causing condensation and cloud formation.
Low pressure area
in ____ warm moist air converges and rises and formes clouds. Cold air then descends towards the cooler parts of the earth (towards the poles)
Coriolis Force
an apparent force that, as a result of the earth's rotation, deflects moving objects (as projectiles or air currents) to the right in the northern hemisphere and to the left in the southern hemisphere
causes meridional flow to be disrupted as winds are deflected to the right of their course in the northern hemisphere and to the left of their course in the southern hemisphere
minimum at the equator
maximum at the poles
Coriolis effect
____ causes meridional flow to be disrupted as winds are deflected to the right of their course in the northern hemisphere and to the left of their course in the southern hemisphere
Meridional flow
the flow of air from one latitude to another
Ferrel Cells
Midlatitude cells in both hemispheres. Circulation in these cells results from the air flowing toward the poles from the subtropical highs which collides with cold air flowing from the poles
Polar Cells
Cold, dense air descends in polar high pressure system and moves toward the equator
Coriolis Effect and Atmospheric Circulation
For an unrotating earth, you have a simple circulation a hardly cell which is a regional flow of warm air that converges and rises while cool air descends. But because the earth is rotating, this flow of air is deflected by coriolis currents.
Types of Ocean Currents
Surface currents
– Wind-driven
– Primarily horizontal motion
Deep currents
– Driven by differences in density caused by differences in temperature and salinity
– Vertical and horizontal motions
Surface Currents
• Frictional drag between wind and ocean
• Wind plus other factors such as
–Distribution of continents
–Gravity
–Friction
–Coriolis effect cause
Gyres
large circular loops of moving water
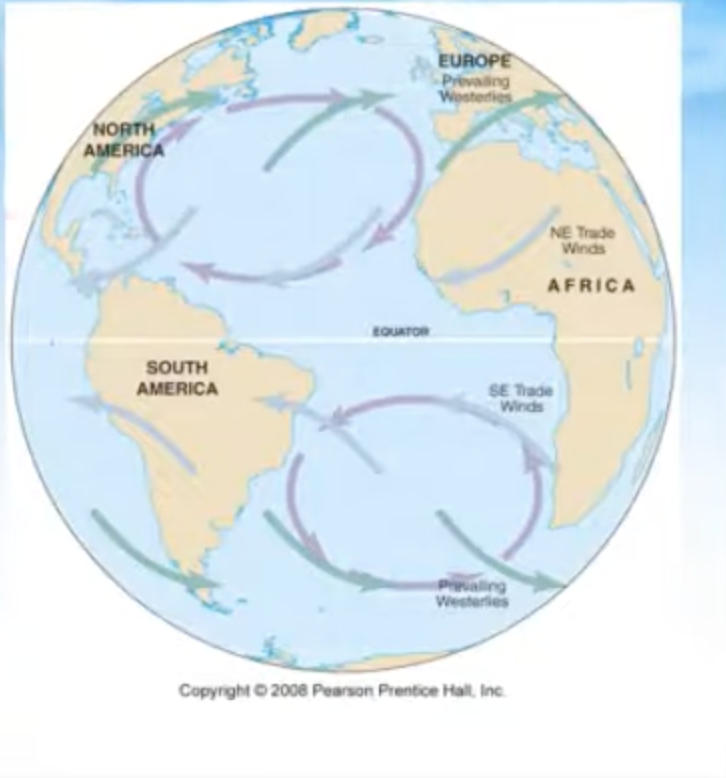
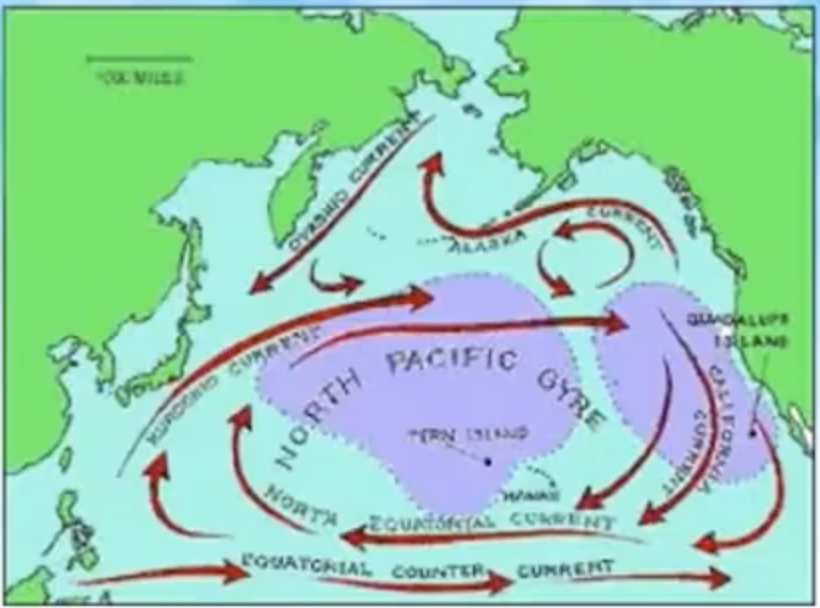
Surface Currents
Gyres circulate clockwise in the northern hemisphere and counter-clockwise in the southern hemisphere. These loops or gyres have equatorial currents, westerlies, western boundary current, and eastern boundary current.
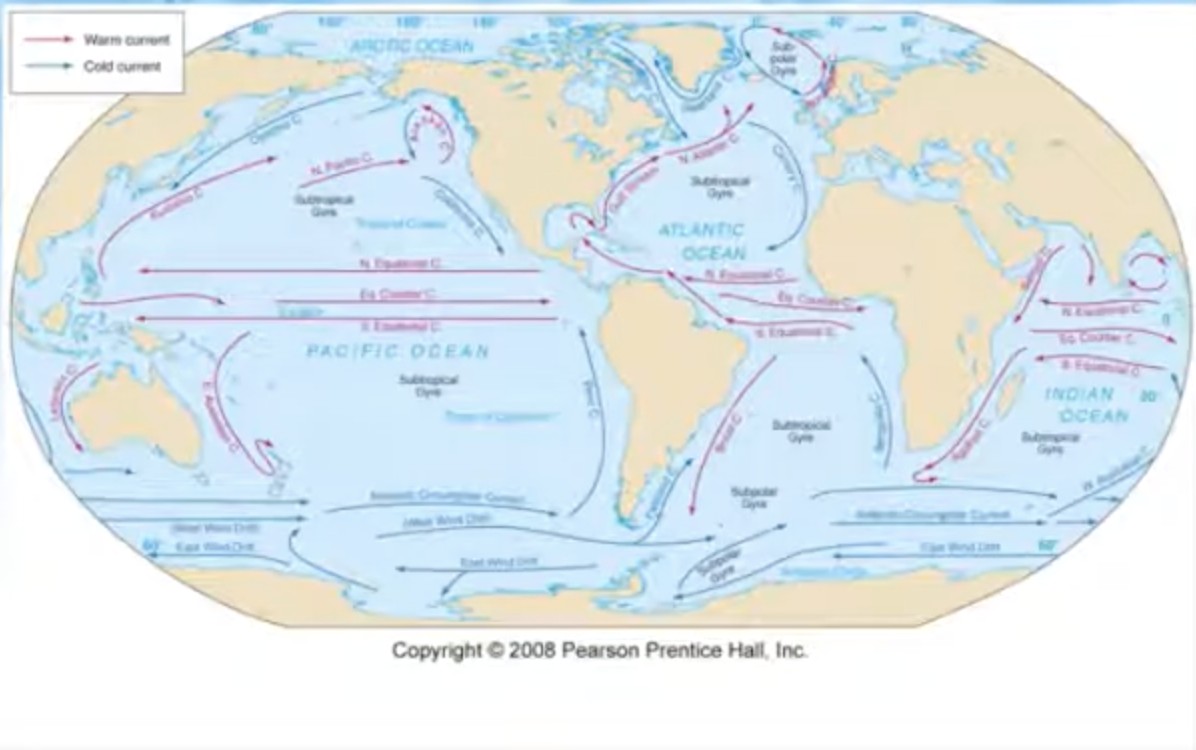
Kuroshio Current
a western boundary current that brings warm water towards the north
Gulf Stream
a western boundary current brings warm surface waters towards the pole
Eastern Boundary Current
current that brings cold water towards the equator
Western boundary current
current that brings warm water towards lower latitude
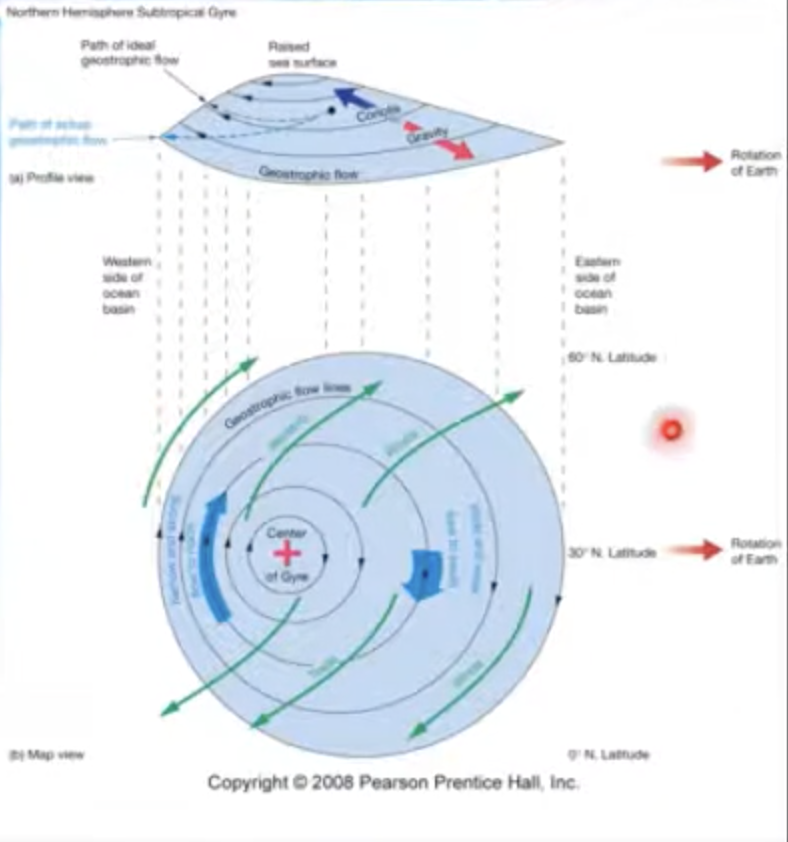
Ocean gyres
Subtropical gyres - Centered about 30 degrees N or S
Equatorial current
Western Boundary currents
Eastern Boundary currents
Geostrophic flow
• Ekman transport piles up water within subtropical gyres
• Surface water flows downhill (gravity) and
• Also to the right (Coriolis effect)
• Balance of downhill and to the right causes geostrophic flow around the “hill”
Pacific Ocean circulation
• North Pacific subtropical gyre
• Kuroshio
• North Equatorial Current
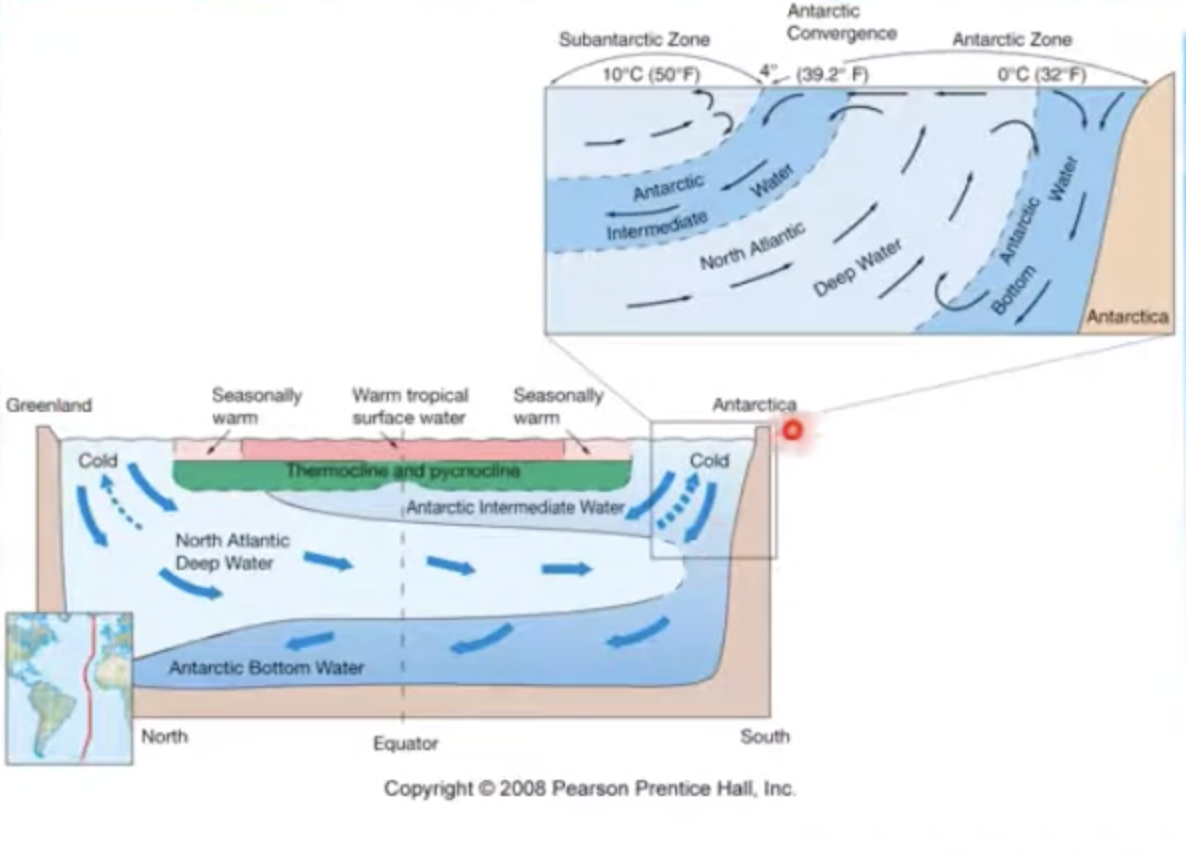
Deep Water Circulation
Thermohaline or density driven deep water currents.
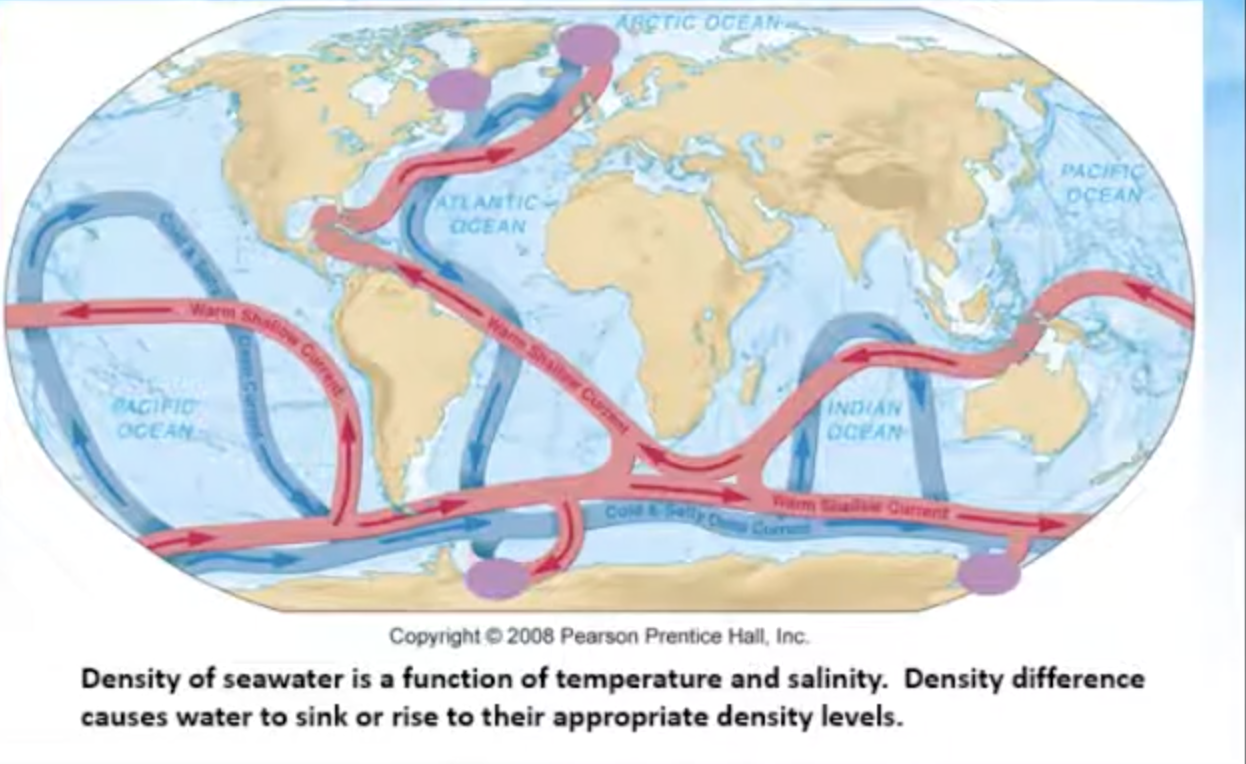
Thermohaline circulation
also known as Deep Water Circulation
Atmospheric vs Oceanic Circulation (ChatGPT)
Atmospheric circulation refers to the large-scale movement of air around the Earth, driven by the uneven heating of the planet’s surface by the sun, which distributes heat and moisture across regions.
Oceanic circulation, on the other hand, involves the movement of seawater through currents caused by wind, temperature, salinity differences, and the Earth's rotation, helping transport heat and nutrients throughout the oceans.
Deep Water Circulation (ChatGPT)
Deep water circulation, also called thermohaline circulation, is the global movement of ocean water driven by differences in temperature and salinity. Cold, salty water is denser and sinks in polar regions, while warmer, less salty water rises in other areas. This process forms a global conveyor belt that moves heat, nutrients, and gases throughout the deep ocean.
Deep ocean currents
• Cold, oxygen-rich surface water to deep ocean
• Dissolved O2 important for life and mineral processes
• Changes in thermohaline circulation can cause global climate change
– Example, warmer surface waters less dense, not sink, less oxygen deep ocean
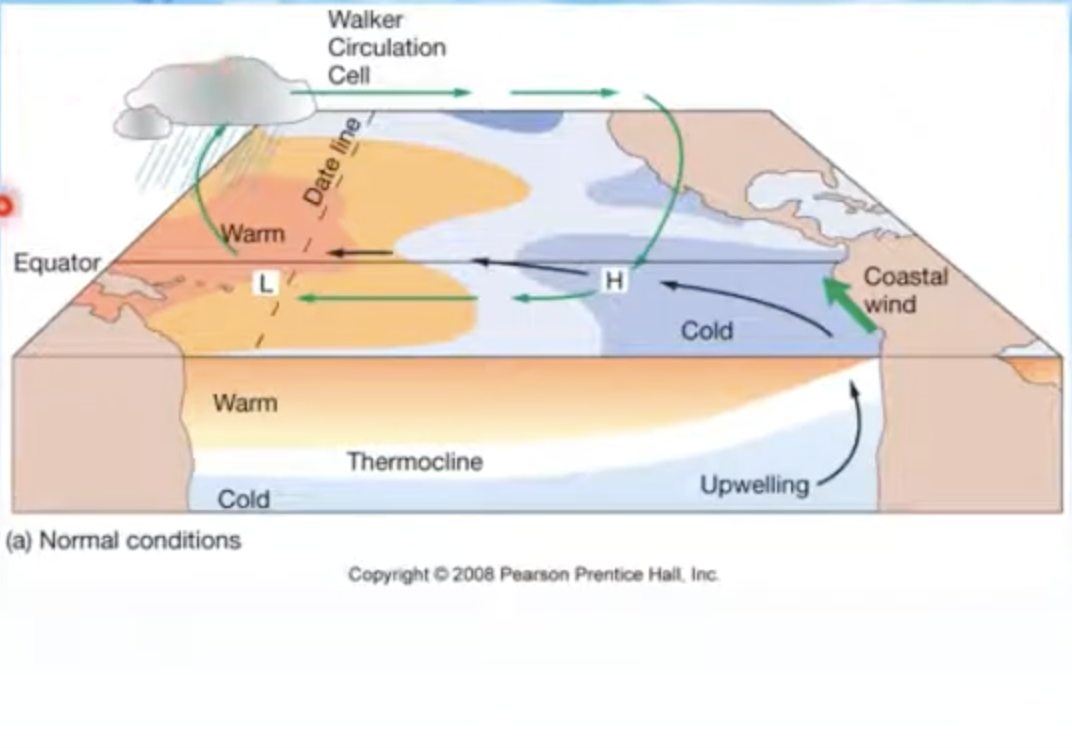
Atmospheric and oceanic disturbances in Pacific Ocean
• Normal conditions
– Air pressure across equatorial Pacific is higher in
eastern Pacific
– Strong southeast trade winds
– Pacific warm pool on western side
– Thermocline deeper on western side
– Upwelling off the coast of Peru
Atmospheric and oceanic disturbances in Pacific Ocean
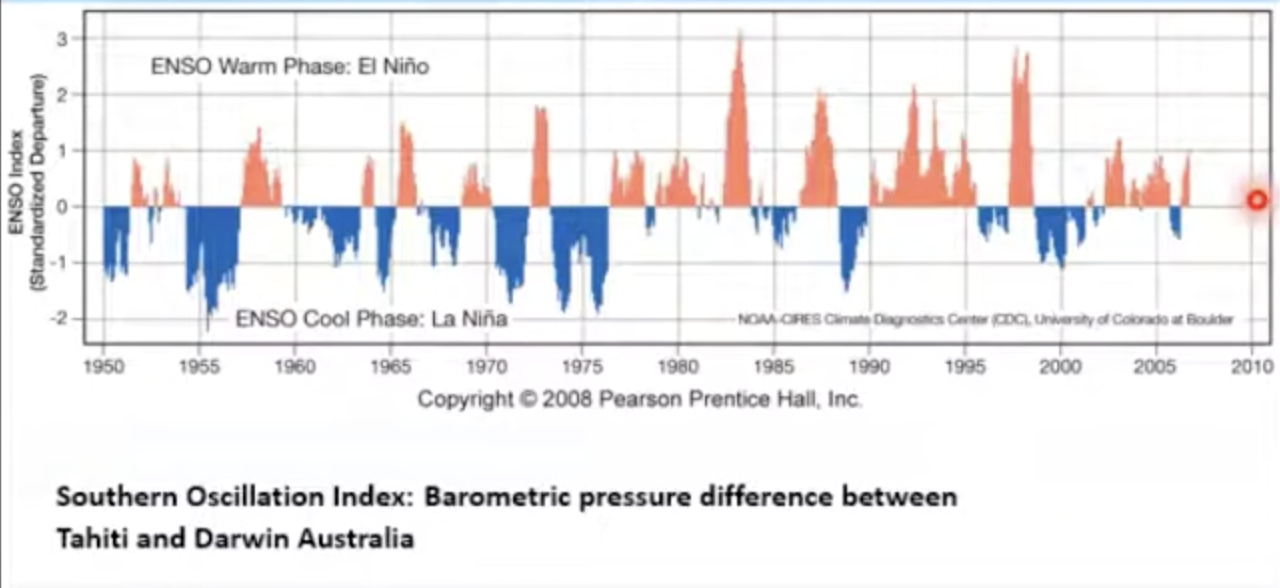
• El Niño El Niño-Southern Oscillation (ENSO) Southern Oscillation (ENSO)
– Warm (El Niño) and cold phases (La Niña)
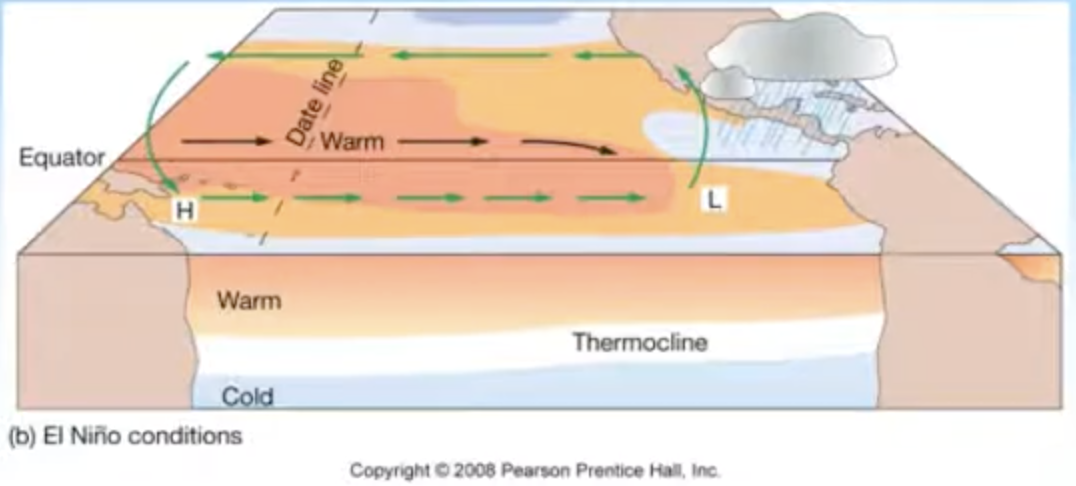
El Niño-Southern Oscillation (ENSO): Warm phase (El Niño)
– High pressure in eastern Pacific weakens
– Weaker trade winds
– Warm pool migrates eastward
– Thermocline deeper in eastern Pacific
– Downwelling
– Lower biological productivity: Corals particularly sensitive to warmer seawater
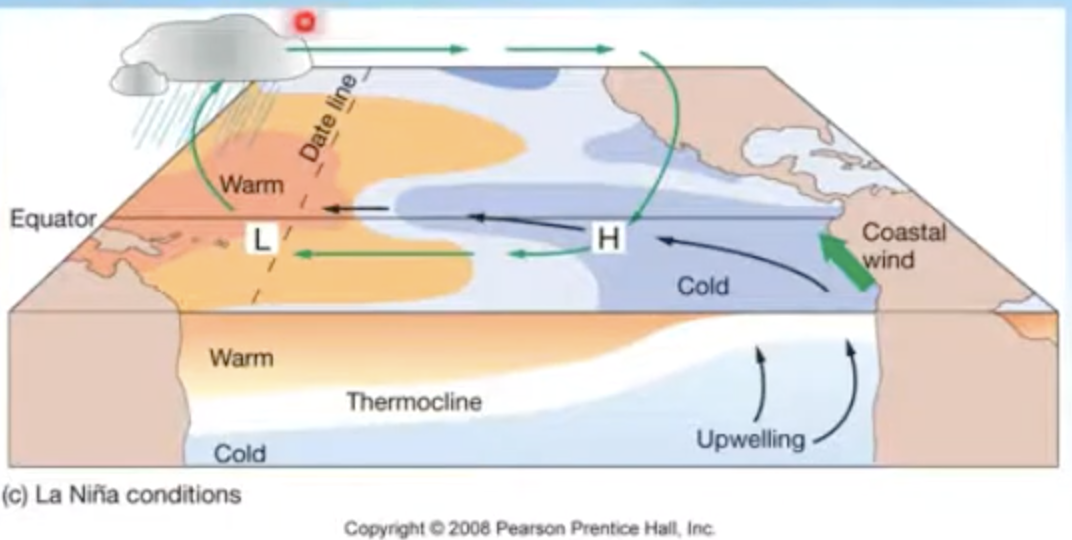
El Niño-Southern Oscillation (ENSO): cool phase (La Niña)
• Increased pressure difference across equatorial Pacific
• Stronger trade winds
• Stronger upwelling in eastern Pacific
• Shallower thermocline
• Cooler than normal seawater
• Higher biological productivity
ENSO events
• El Niño warm phase about every 2 to 10 years
• Highly irregular
• Phases usually last 12 to 18 months
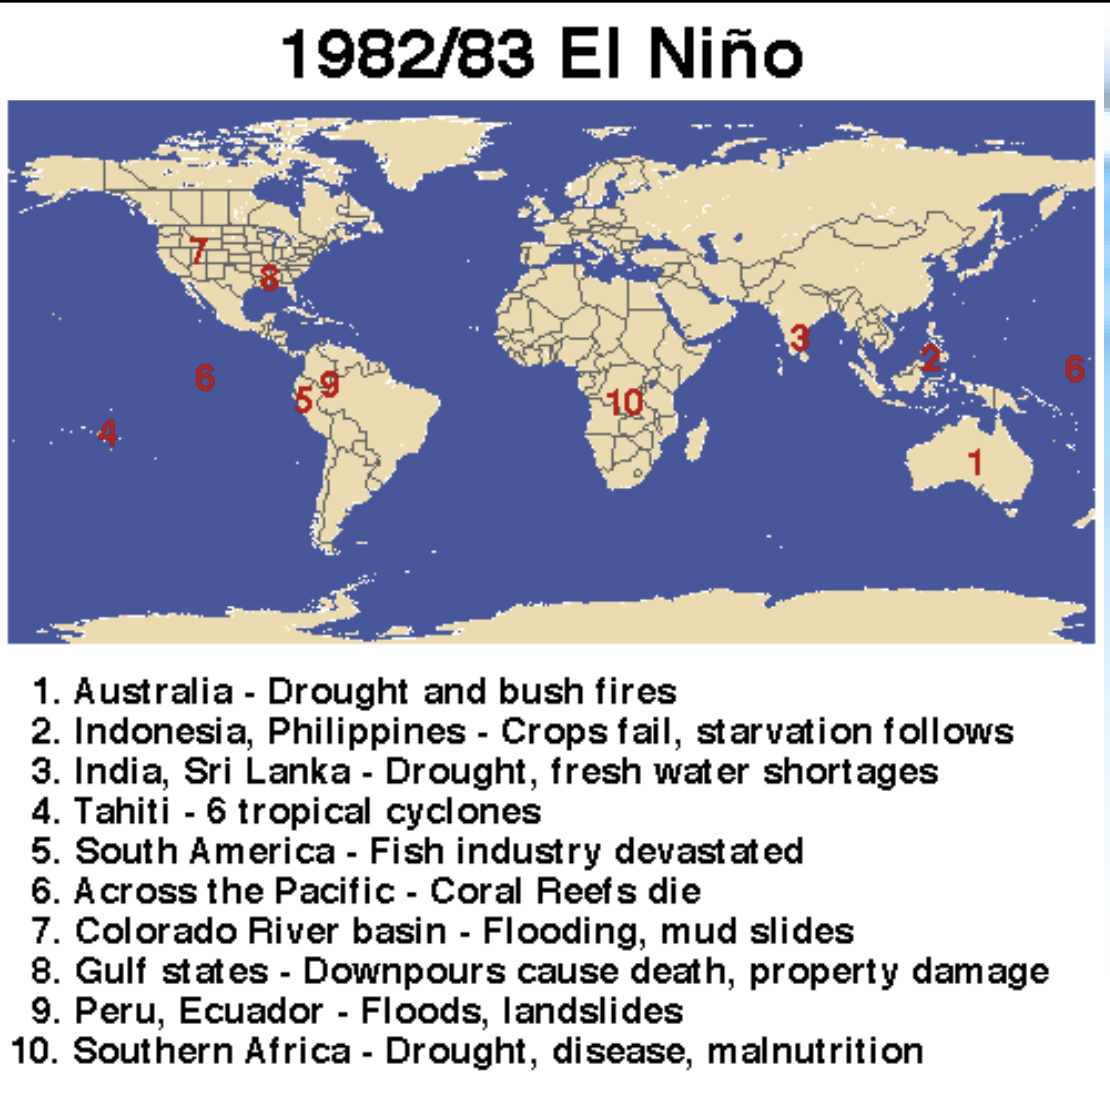
Effects of El Nino
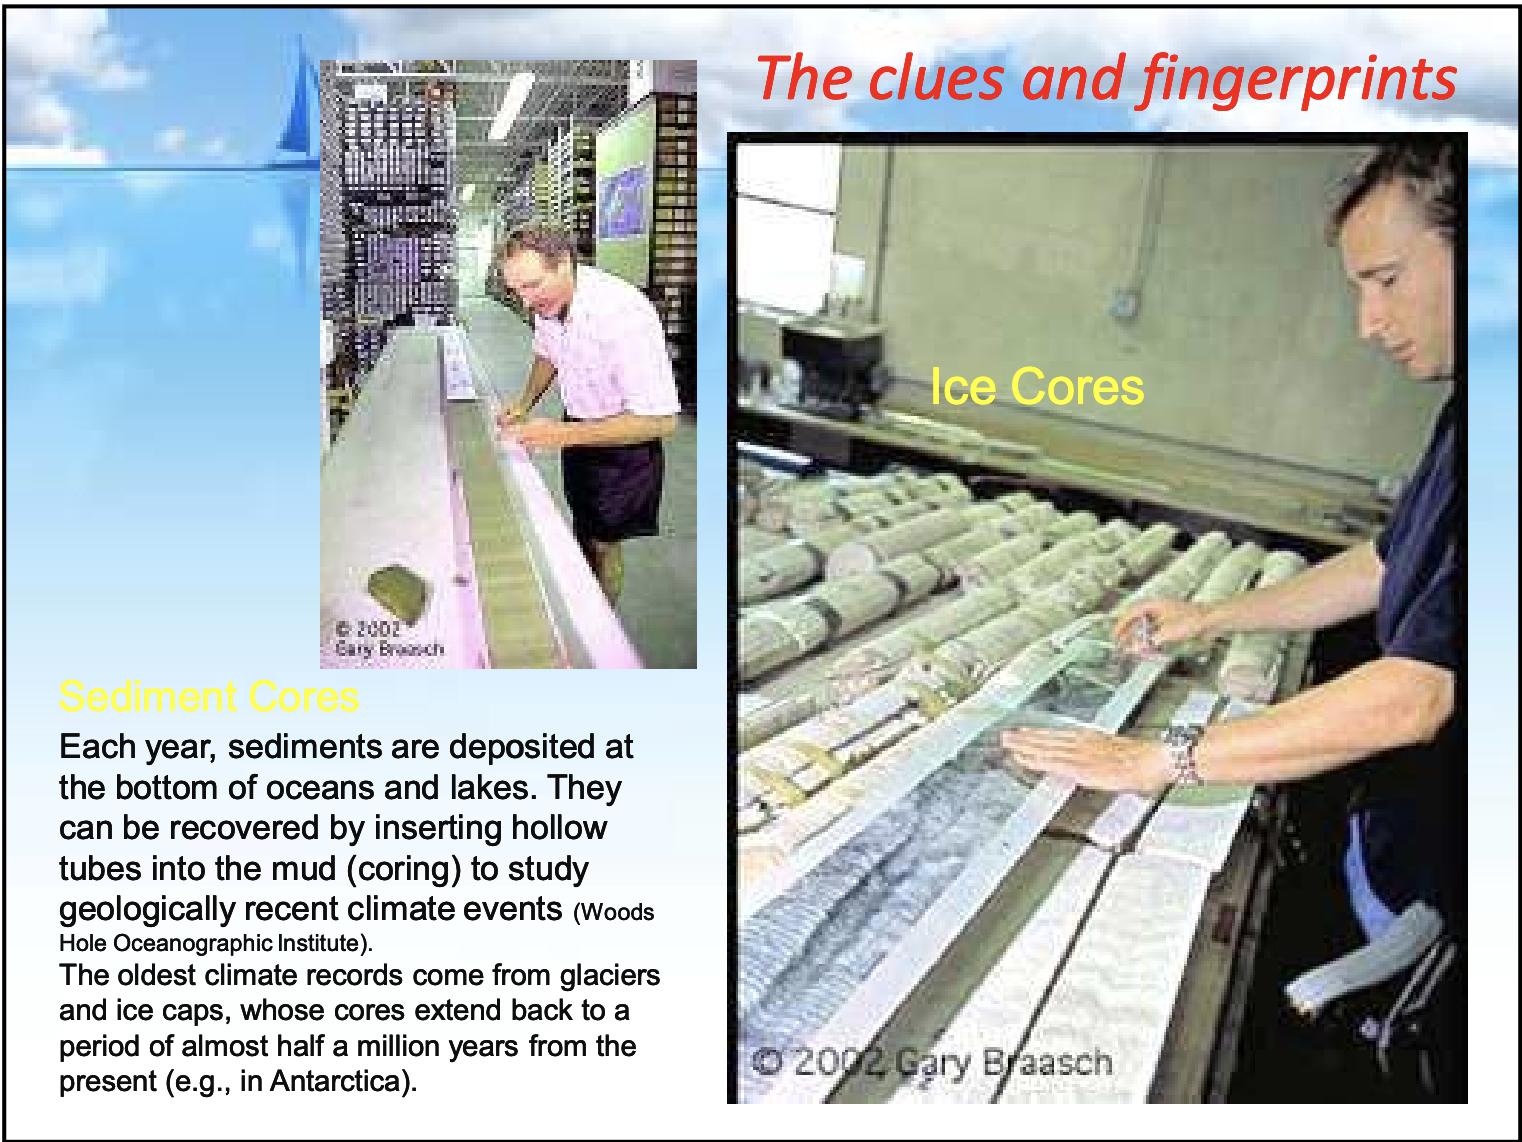
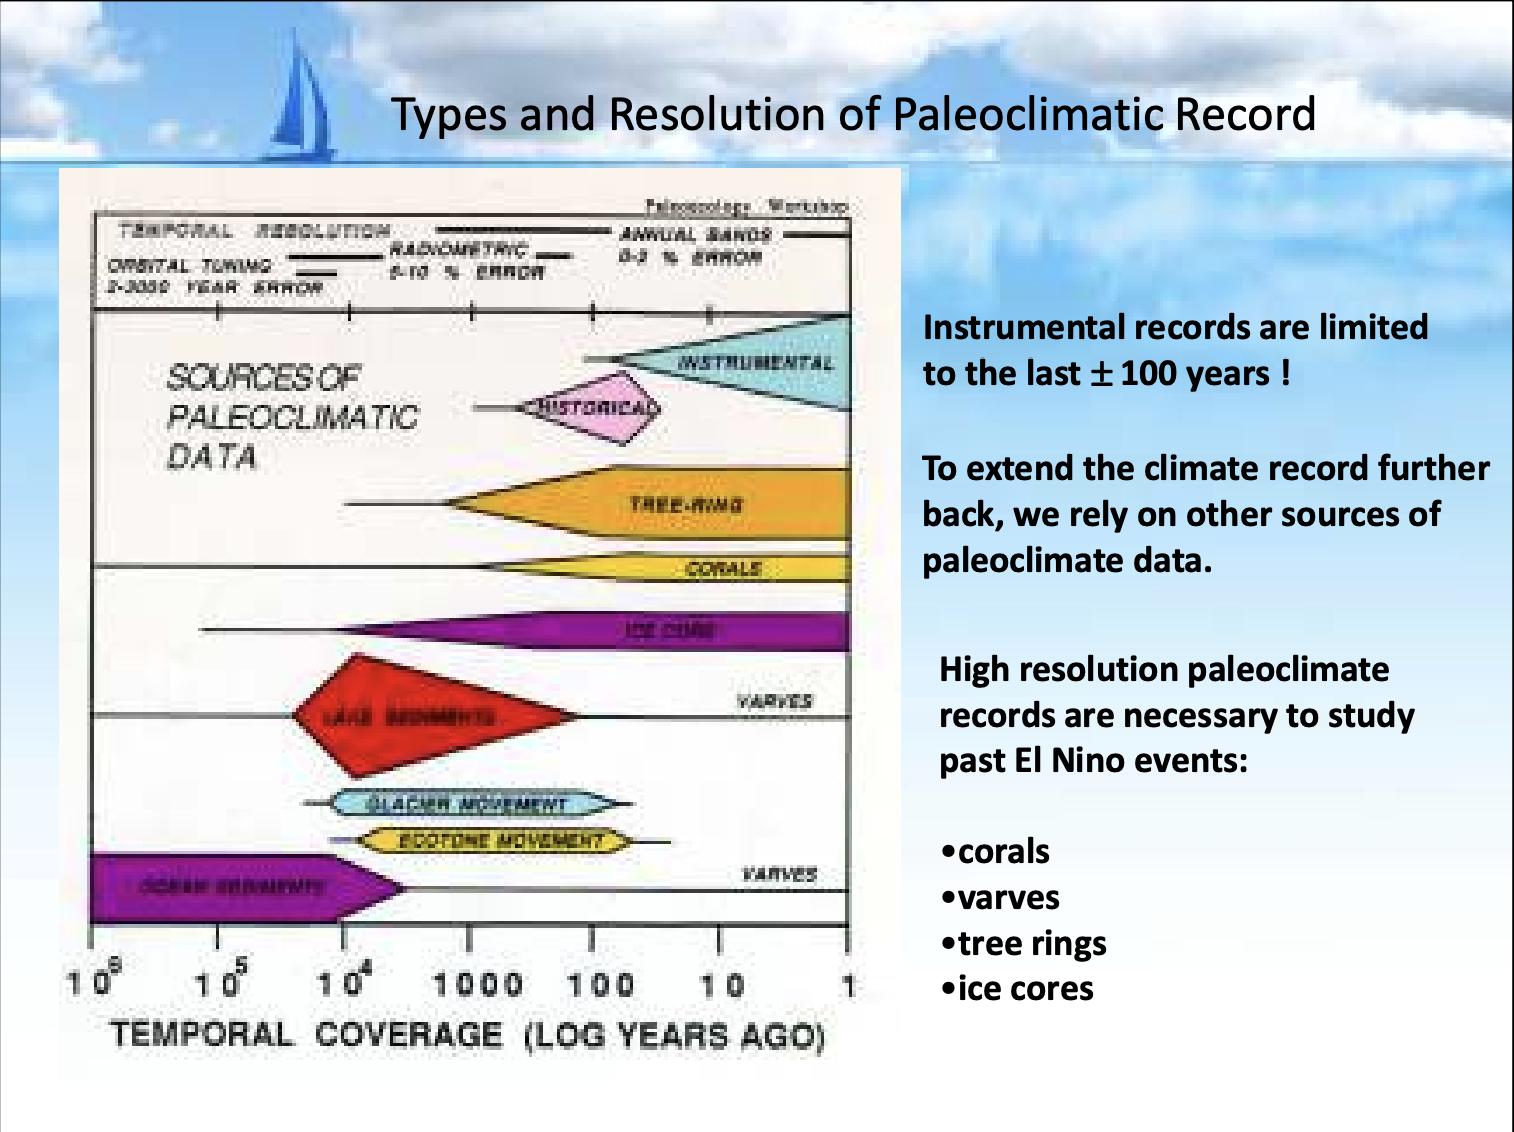
Types and Resolution of Paleoclimatic Record
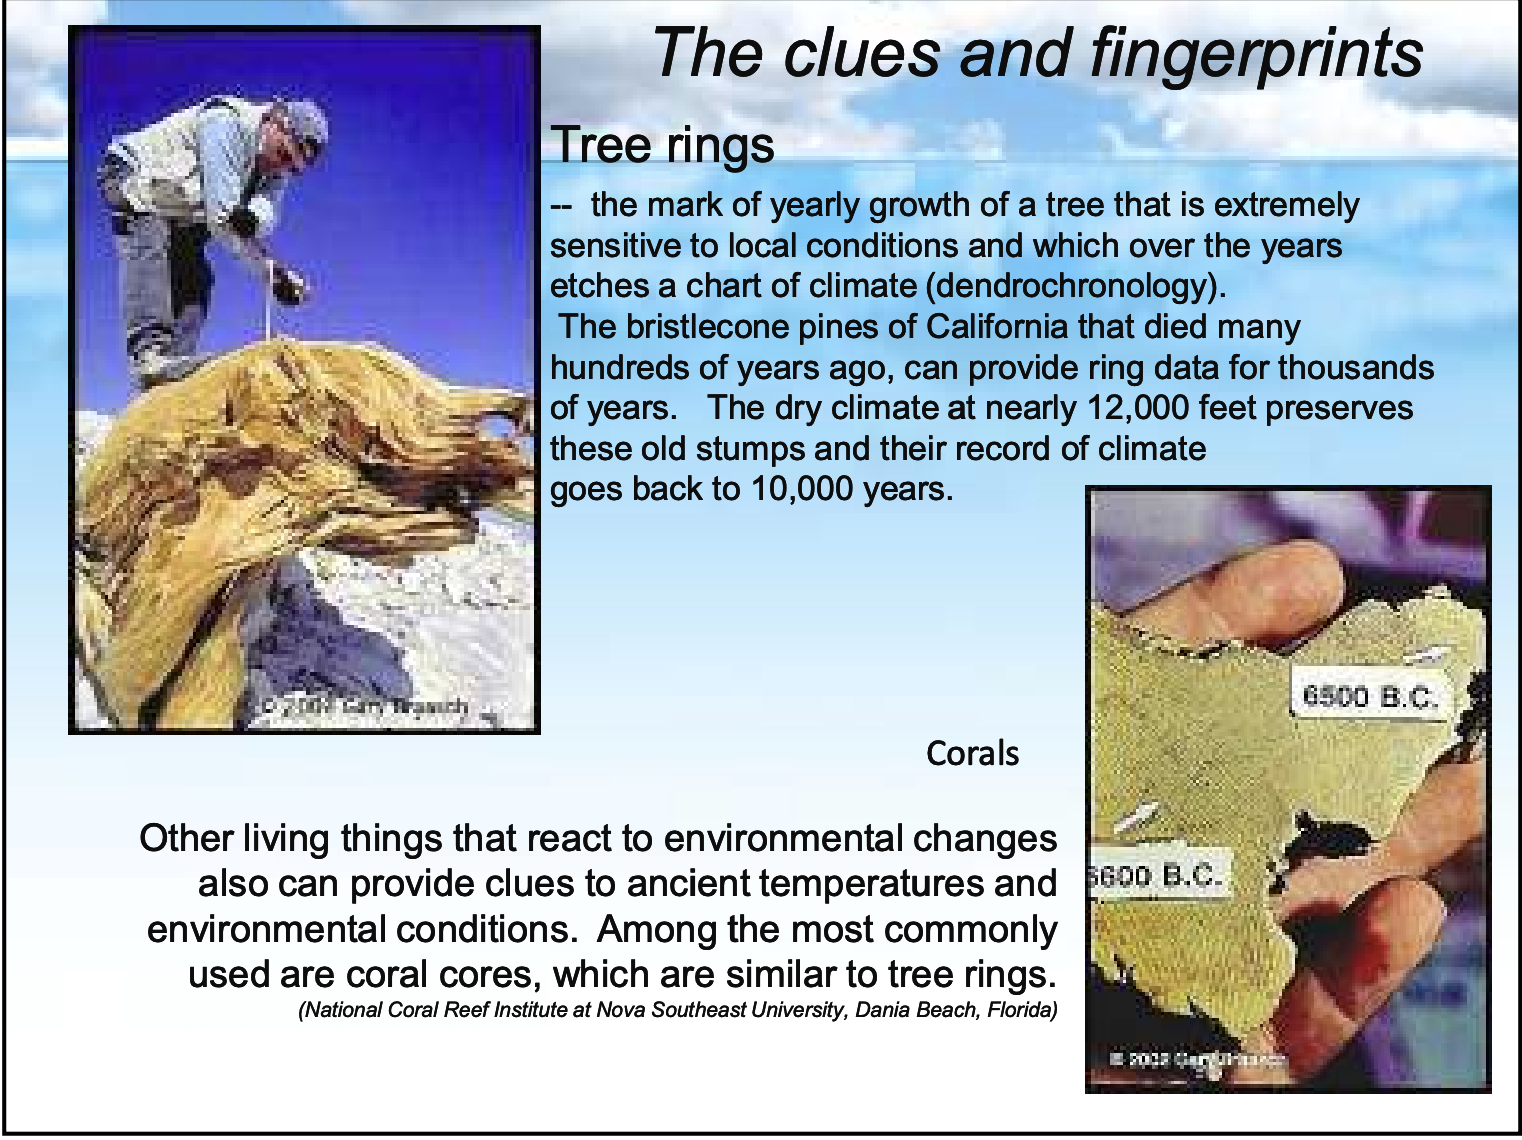
Evidence, clues, and fingerprints of ENSO
Evidence, clues, and fingerprints of ENSO