aggregate supply
1/18
There's no tags or description
Looks like no tags are added yet.
Name | Mastery | Learn | Test | Matching | Spaced |
|---|
No study sessions yet.
19 Terms
aggregate supply (AS)
the total amount of domestic goods and services supplied by businesses and the government, including both consumer goods and capital goods, in the economy at every give price level
the sum of the supply curves of all the industries in the economy
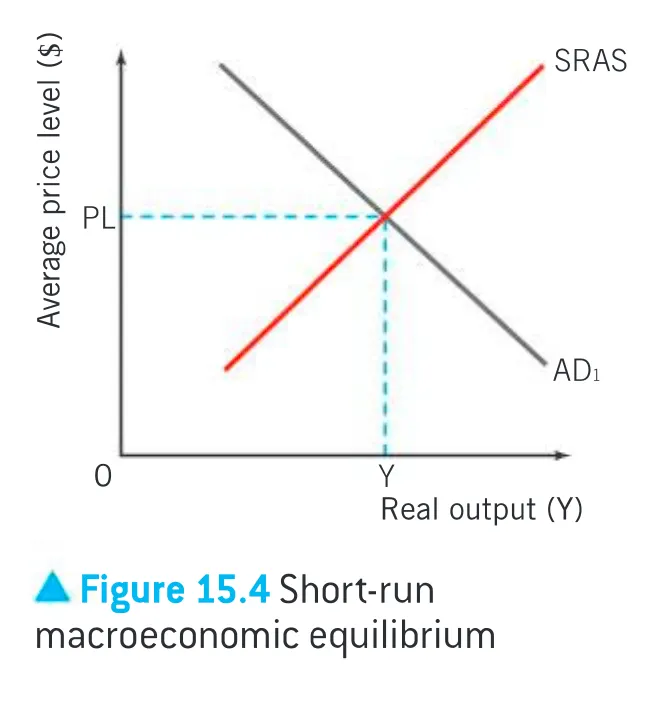
SRAS
there is a positive relationship between the price level and the amount of output that a country’s industries will supply
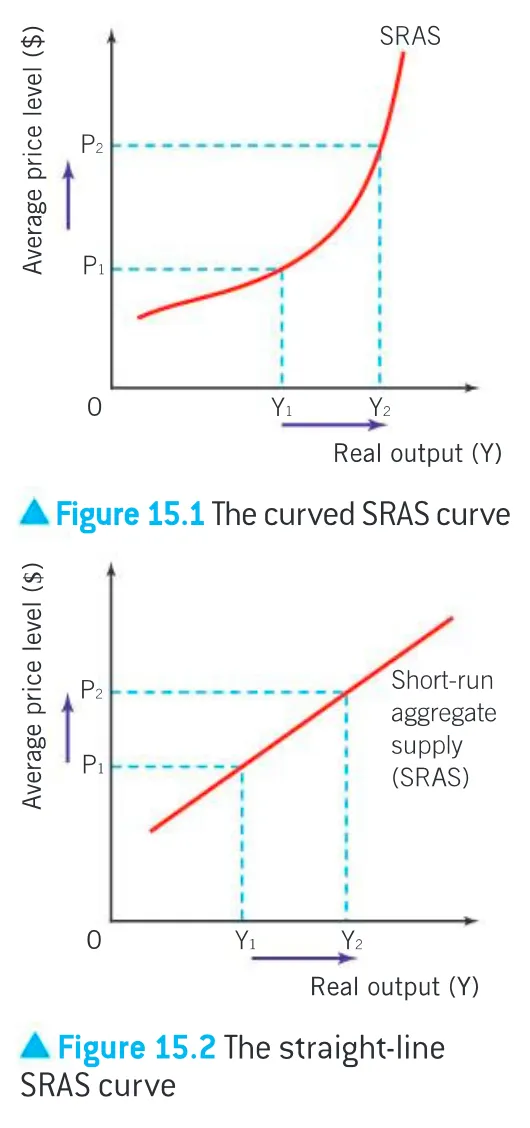
short run
defined as the period of time when the prices of the factors of production do not change
the price of labour - the wage rate - is fixed
an increase in output will be accompanied by an increase in average costs
in order to produce more, firms have to provide incentives to workers to produce a larger amount - most commonly done by paying overtime wages → which many be one and a half times the normal wage and so costs rise
industries will pass on this cost in the form of a higher price level
supply side shocks
a change in any of the factors other than the price level will result in the SRAS curve
factors that cause changes in the costs of production
sticky wages
in the short run
there isa direct relationship between the price level and the level of output and employment.
Falling prices lead to less output and less employment, while rising prices lead to more output and more employment.
When wages don't adjust quickly to changes in the economy, particularly during a recession (e.g. employers lay-off instead of cut pay).
what changes costs of production
change in wage rates
change in cost of raw materials
change in the price of imports
change in gov indirect taxes or subsidies
change in wage rates
an increase in wages will result in an increase in the costs of production to firms and therefore a fall in aggregate supply
ex: the gov raises the legal minimum wage → it would increase labour costs
ex: labour unions negotiate higher wages for manufacturing workers, then this would also result in a fall in the SRAS
a change in the costs of raw materials
an increase in the price of significant, widely used, raw materials such as oil
a change in the price of imports
if the capital or raw materials used by a country’s industries are imported, then a rise in import prices will increase the costs of production
this can occur due to changes in the exchange rate of a country’s currency
change in gov indirect taxes or subsidies
an increase in indirect taxes effectively increases the costs of production to firms and therefore results in a fall in the SRAS curve
since subsidies are payment from gov to firms, then an increase in gov subsides reduce firms’ costs of production, resulting in an decrease in an increase in the SRAS
indirect tax increases has more of an effect than subsidies
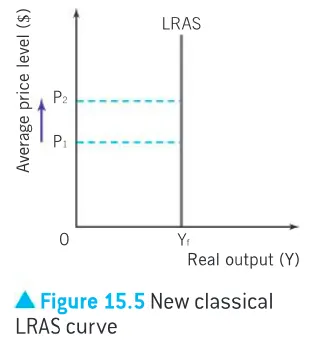
AD meets SRAS in short run
the economy will operate where aggregate demand is equal to aggregate supply (market equilibrium)
at the average price level (PL), all the output produced by the country’s producers is consumed. there is no incentive for producers either to increase output or raise prices
long run aggregate supply
the long run is the period of time in which wages are fully flexible and variable
there is considerable debate regarding the LRAS curve
there are two different schools of thought
new classical or monetarist → more widely used
Keynesian AS → developed by the John Maynard Keynes
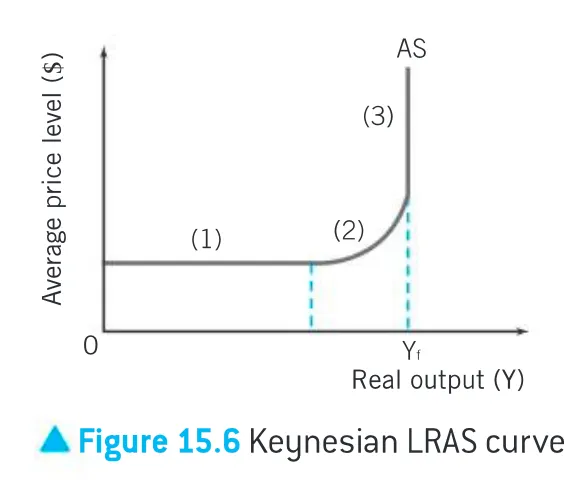
classical LRAS
belief in the efficiency of market forces and their view that there should be the very minimum of government intervention in the allocation of resources in the economy
in this view, the LRAS curve is perfectly inelastic or vertical at what is know as the full employment level of output
represents the potential output that could be produced if the economy were operating at full capacity and is annotated as Yf on a macroeconomic diagram
full employment does not mean zero unemployment → it means the natural level of unemployment
asserts that the potential output is based entirely on the quantity and quality (productivity) of the factors of production and not on the price level → thus the LRAS is independent of the price level
classical LRAS graph
the price level might rise from P1 to P2, but the level of output does not change
indicating that regardless of the price level, output will be the full employment level
Keynesian AS phases
1:
the AS curve will be perfectly elastic at low levels of economic activity.
producers in the economy can raise their levels of output without incurring higher average costs because of the existence of space capacity in the economy
there are high levels of unused factors such as unemployed labour and underutilised capital
should there be a need for greater output, these can be used to their fullest capacity at constant average costs
2:
as the economy approaches its potential output (Yf) and the space capacity is used up, the economy’s available factors of production become increasingly scarce
as producers continue to try to increase output, they will have to bid for the increasingly scarce factors
higher prices for the factors of production mean higher costs for the producers, and the price level will rise to compensate for the higher costs
shown as upwards sloping
3:
when the economy reaches its full capacity (Yf), it is impossible to increase output any further because all the factors of production are fully employed
this suggests that AS is perfectly inelastic and is shown in phase 3
this third phase aligns with the LRAS of the new classical economists
at this stage, output cannot be increased without an increase in the quantity or improvement in the quality (productivity) of the factors of production
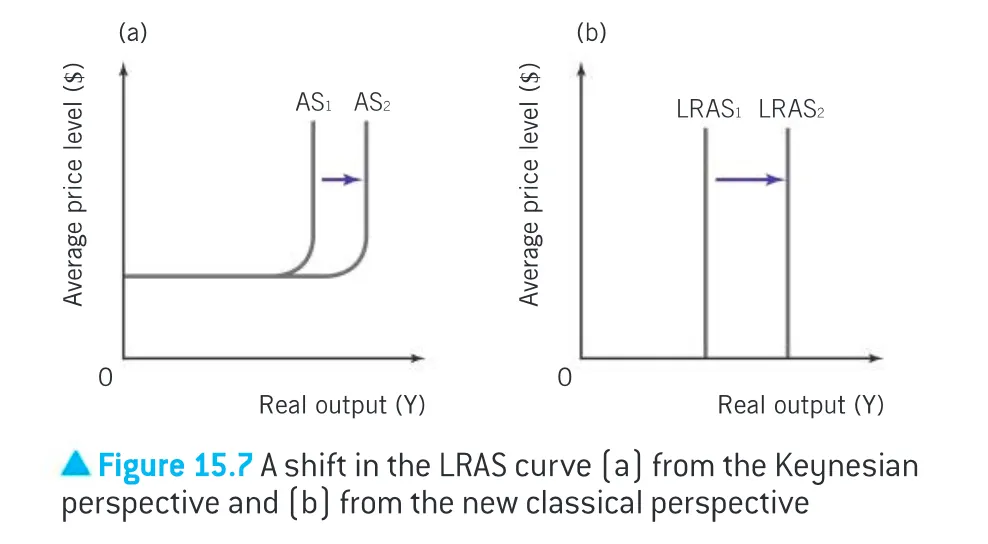
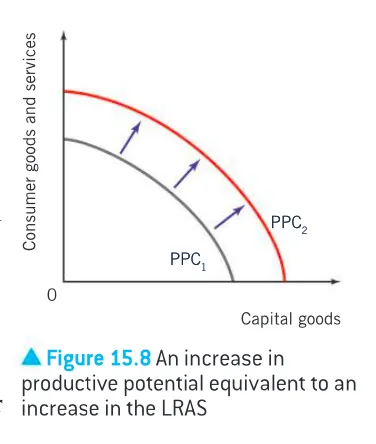
shift in AS/LRAS curves
an outward shift of a country’s AS/LRAS curve means that its productive potential has increased
a shift in the AS/LRAS can be likened to an outward shift of the production possibilities curve (PPC)
land: positive shift of LRAS
increase in quantity
land reclamation
increased access to supply of resources
discovery of new resources
improvement in quality (productivity)
technological advancements → discoveries
fertilizers
irrigation
labour: positive shift of LRAS
increase in quantity
increase in birth rate
decrease in the natural rate of unemployment
immigration
improvement in quality (productivity)
education
training
apprenticeship programs
capital: positive shift of LRAS
increase in quantity
investment
improvement in quality (productivity)
technological advancements
research and development