ap stats
1/80
Earn XP
Description and Tags
Name | Mastery | Learn | Test | Matching | Spaced | Call with Kai | Chat |
|---|
No analytics yet
Send a link to your students to track their progress
81 Terms
describe a distribution
SOCS:
Shape: the shape of the distribution is described. (symmetric, skewed left or right, unimodal, bimodal, uniform)
Outliers: Describe any outliers, gaps, clusters, or unusual features.
Center: what does the “typical” value look like- eyeball or find the median or mean
Spread: How much variability does the data have/range
outlier rule
Lower outliers: <Q1-1.5(IQR/Q3-Q1)
Upper outliers: >Q3+1.5(IQR/Q3-Q1)
IQR formula
Q3-Q1
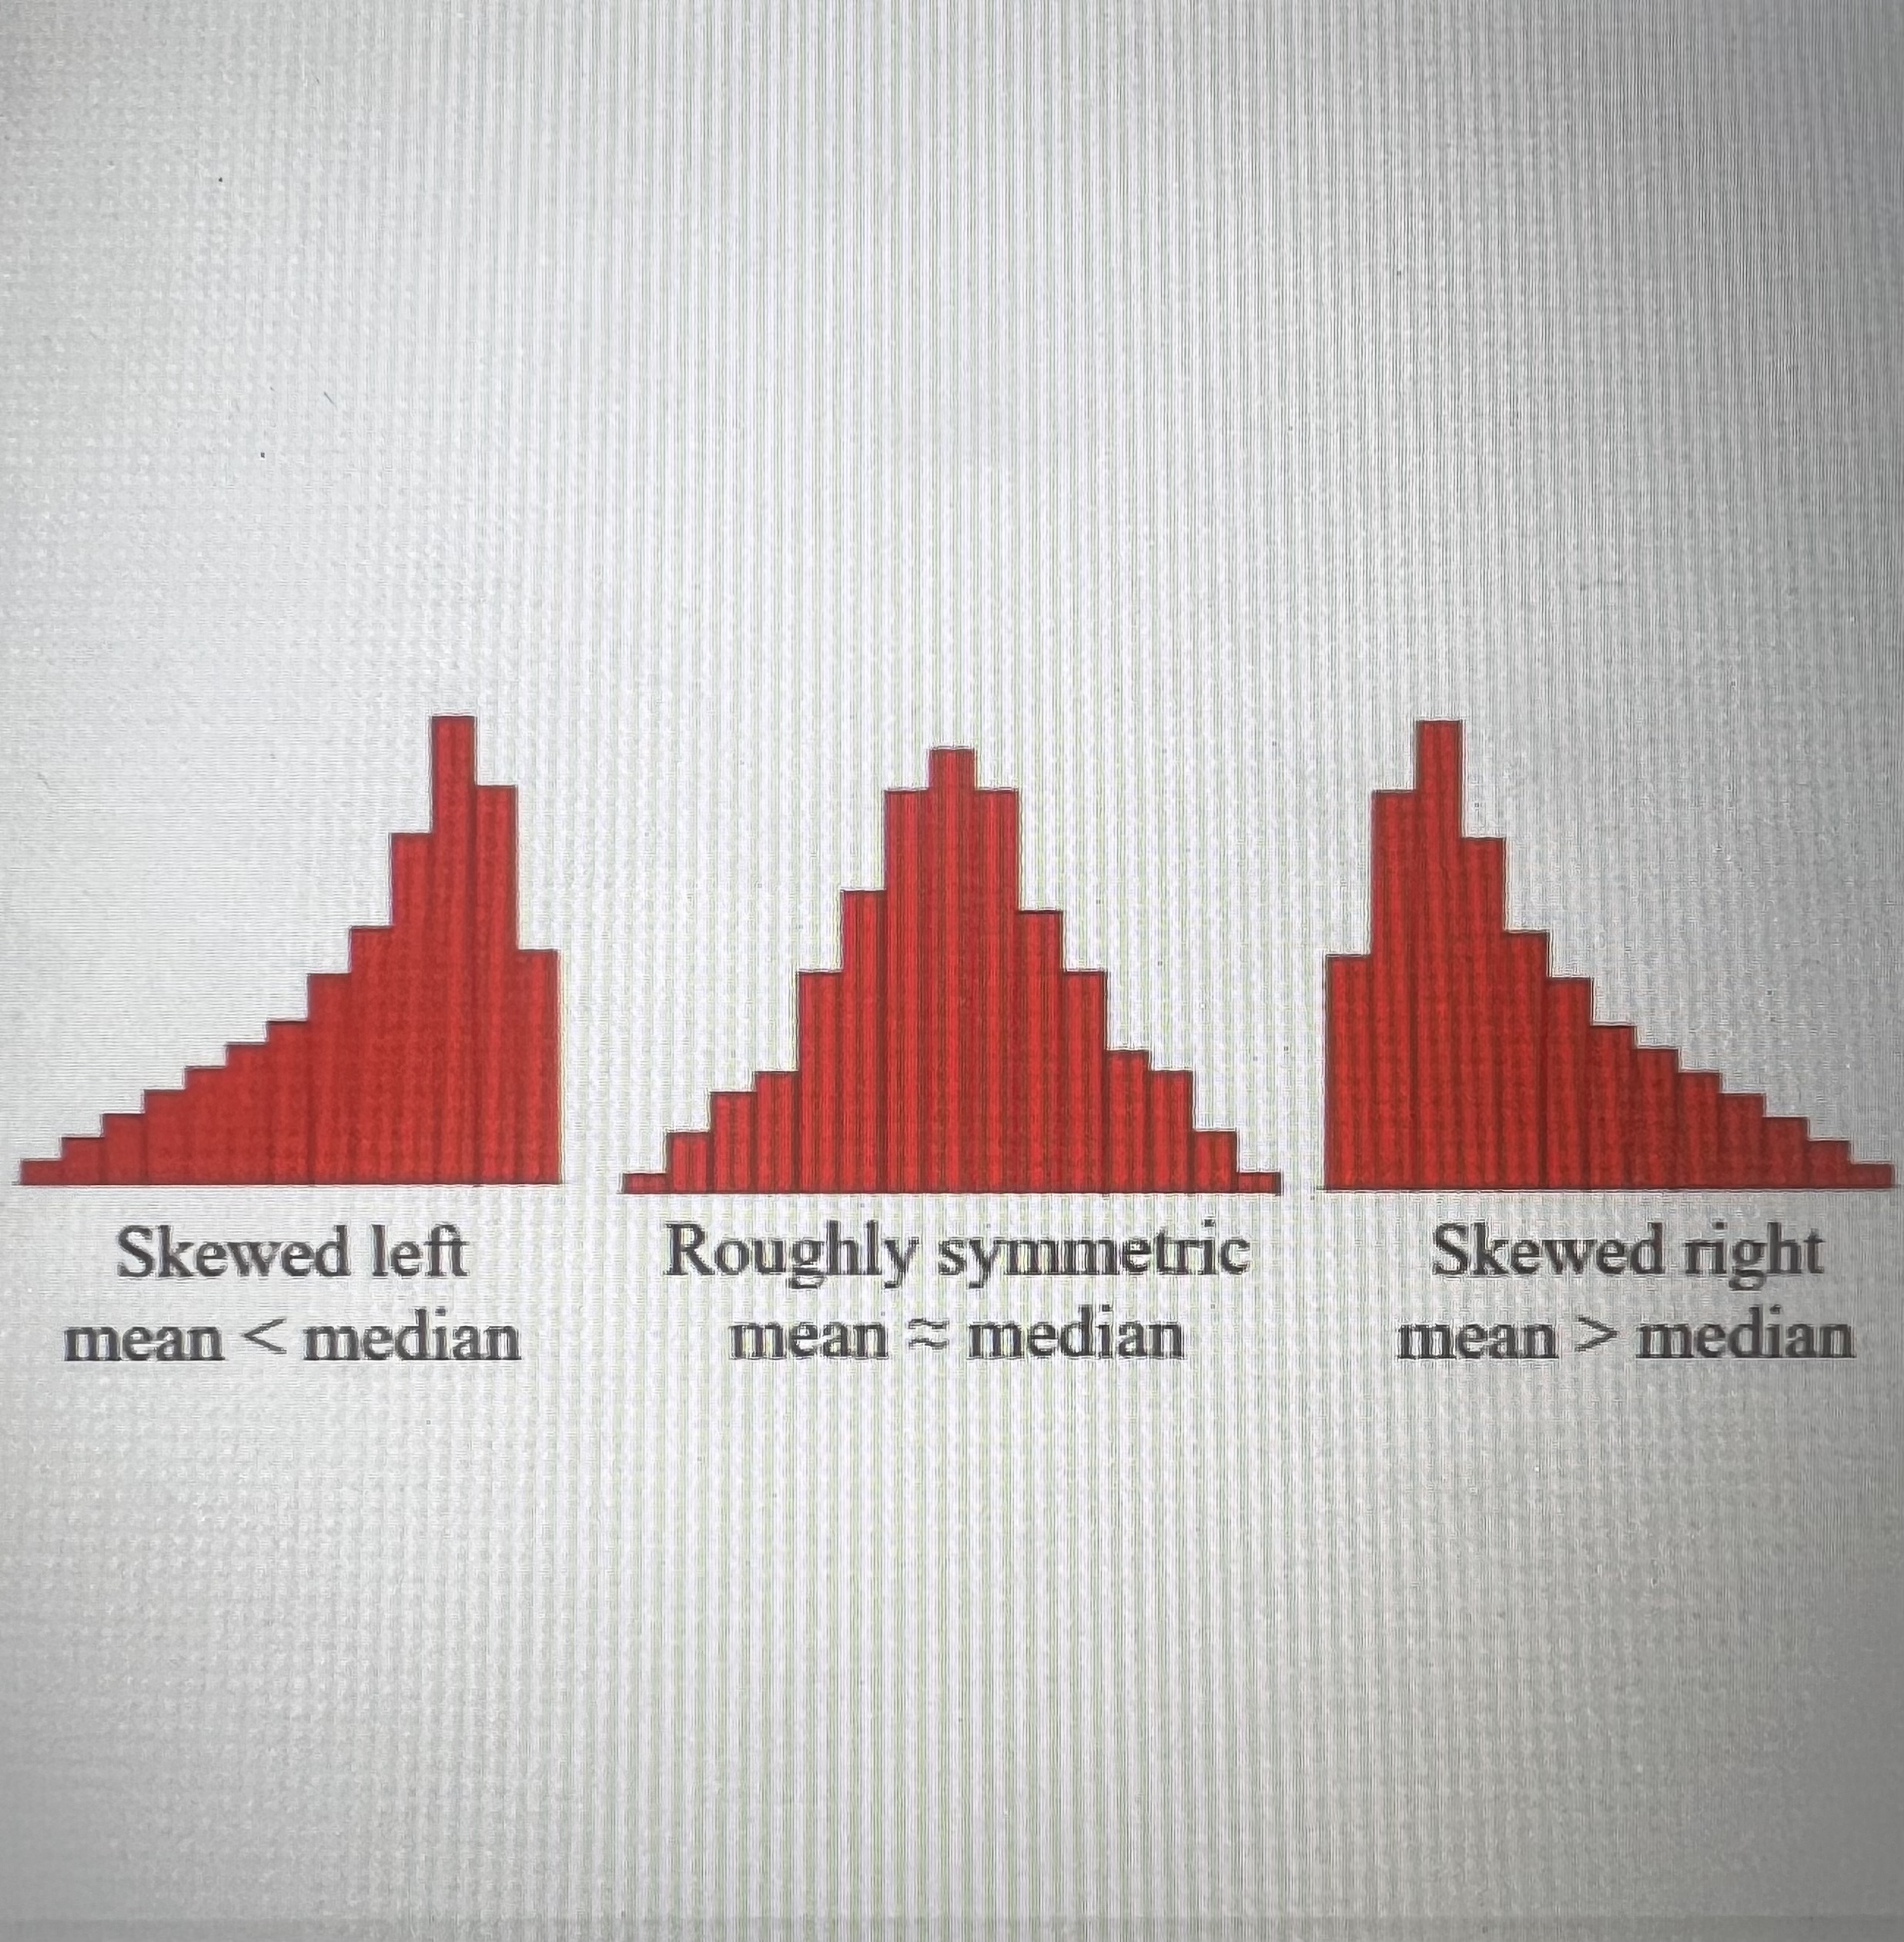
How can you use a graph to compare the mean and the median?
How do you interpret the standard deviation?
The standard deviation gives the typical distance that the values are away from the mean.
How do you describe the relationship between two variables? (ex-scatterplot)
DUFS:
Direction: positive or negative
Unusual values/outliers
Form: Linear or curved?
Strength: Weak, moderate, or strong?
How do you compare two distributions?
SOCS- remember to use comparison words!
Shape, Outliers, Center, Spread
How do you find the Mean, SD, & 5-Number Summary using your calc?
enter data into L1, leave FreqList blank, Calculate.
How do you calculate a Least Squares Regression Line using a calc?
enter x-values into L1 & y-values into L2; leave FreqList blank & calculate
What is the IQR?
Q1 & Q3 form the boundaries for the middle 50% of values in an ordered data set.
How do you calculate the percentile of a particular value in a data set?
Order the data
count the number of values that are less then or equal to the value of interest.
Count the number of values in the data set
Express it as #/___th percentile
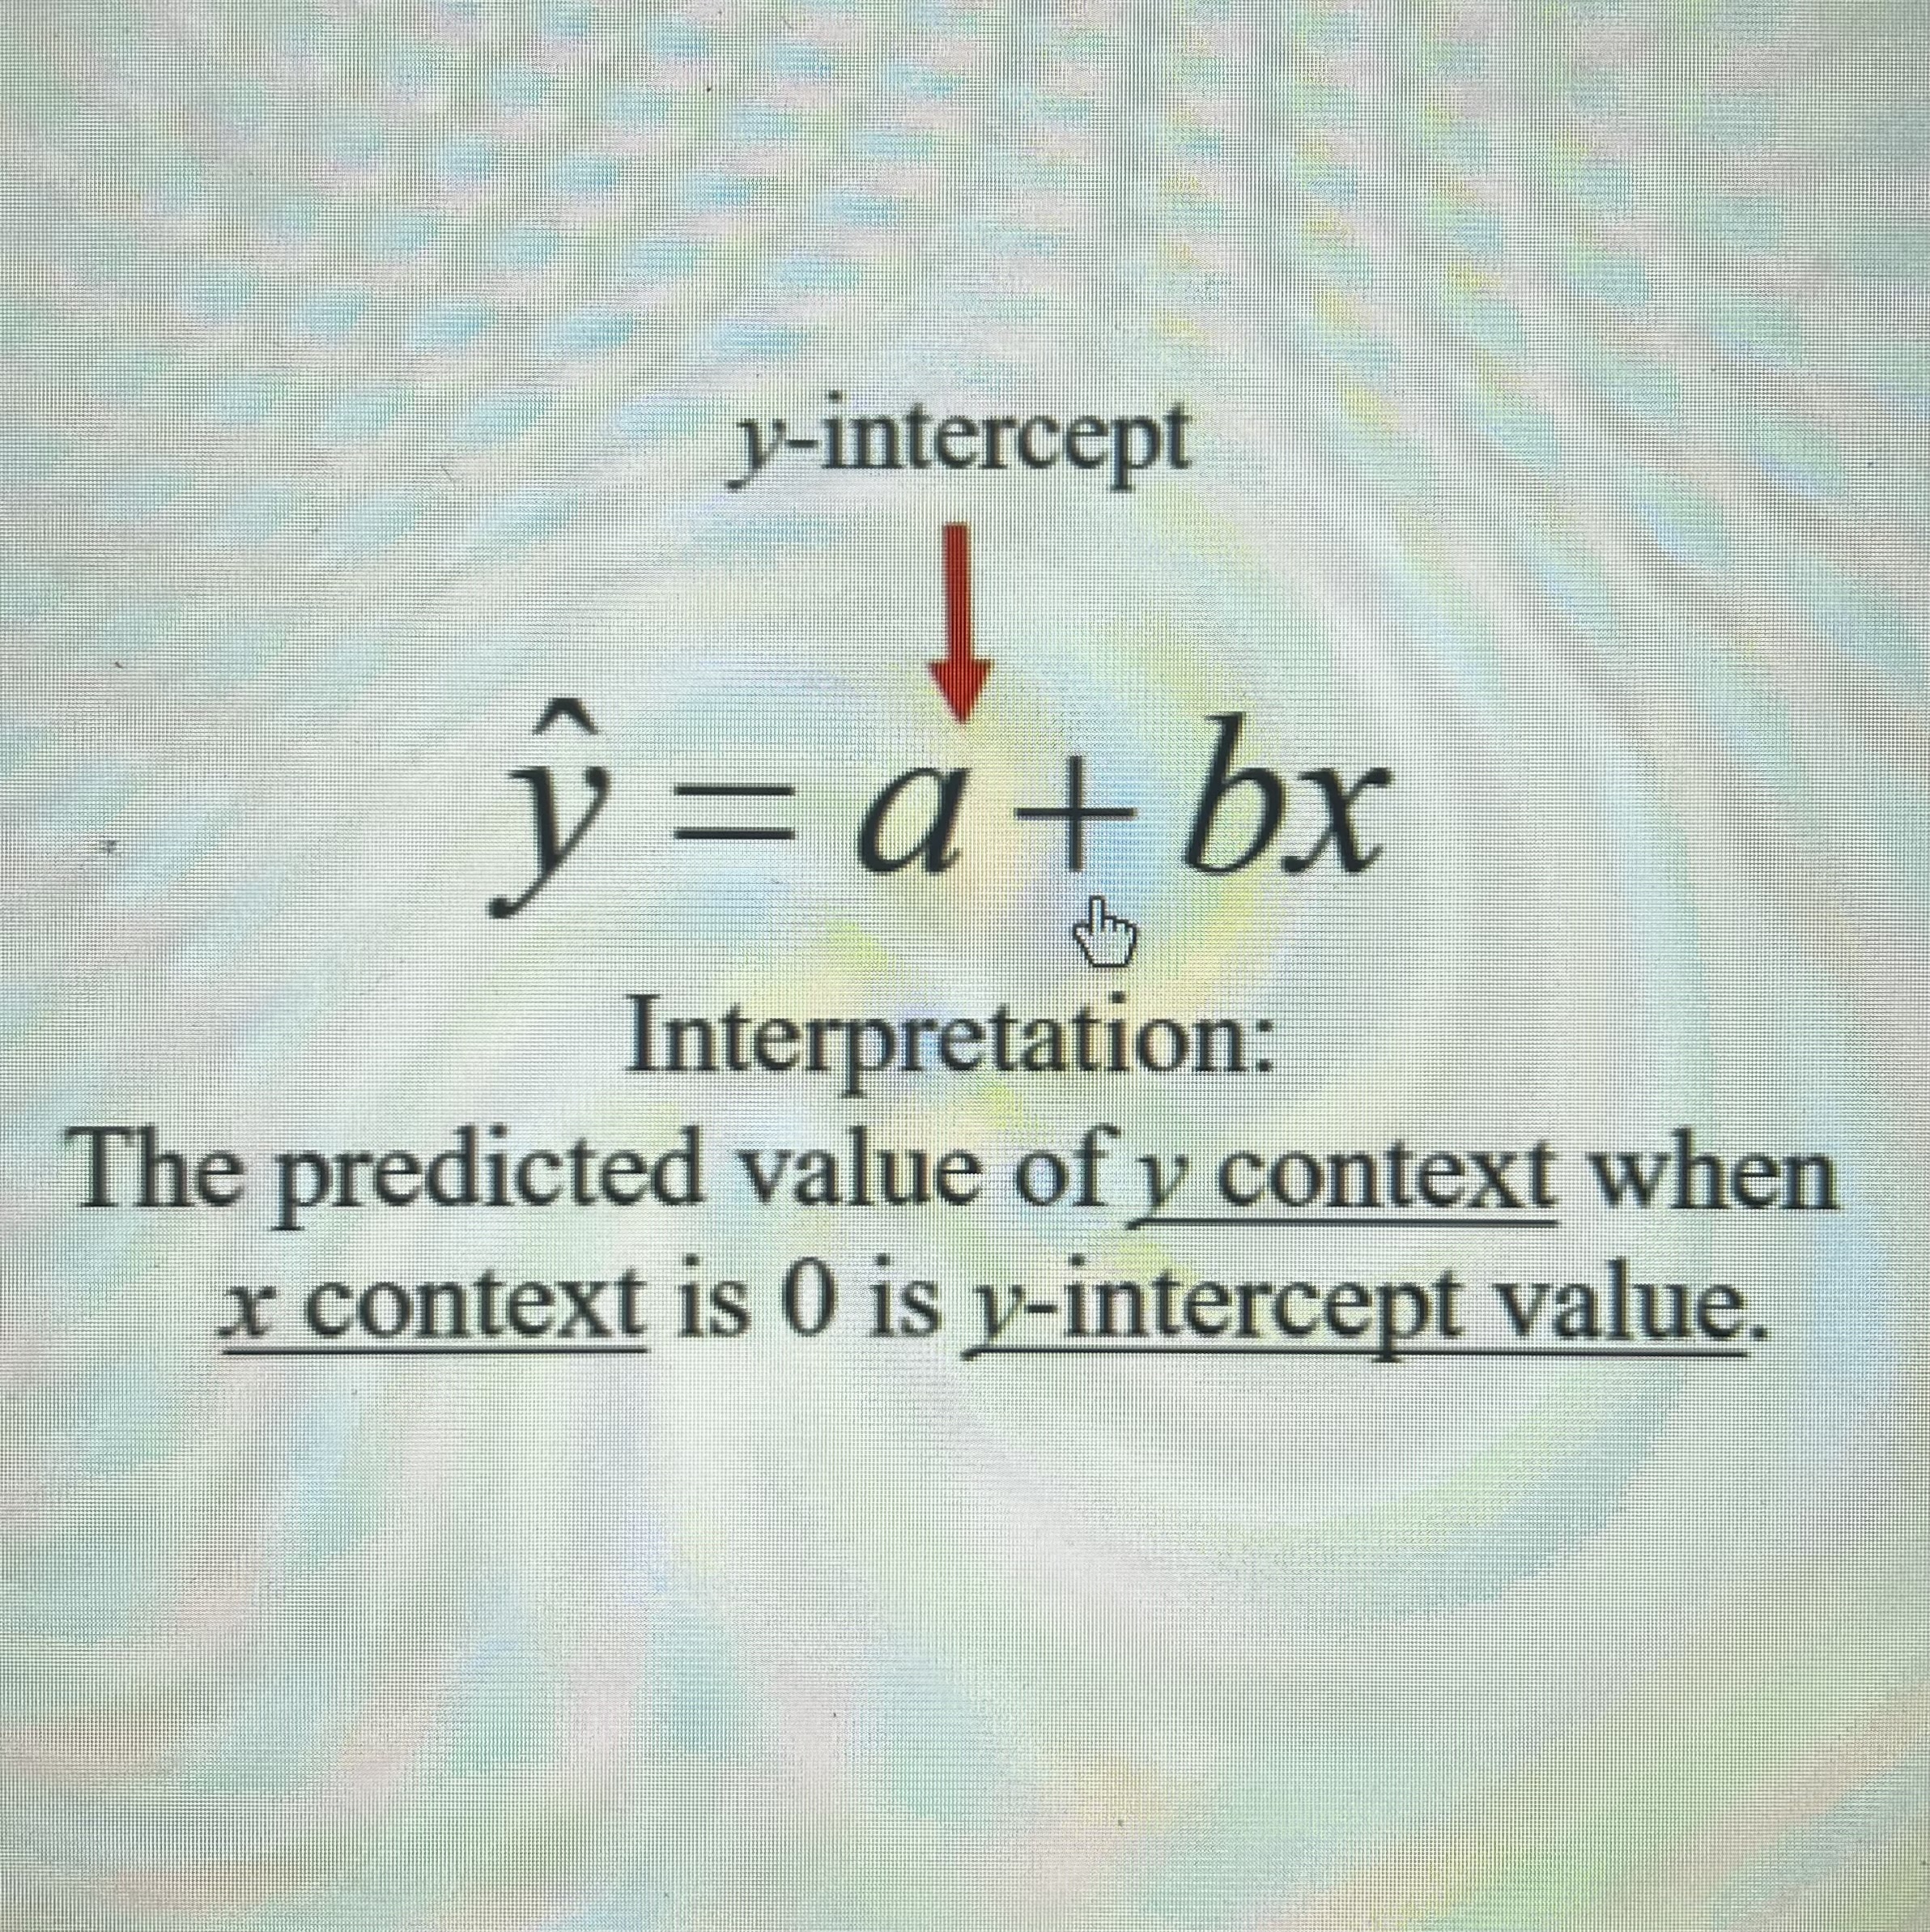
Interpret the y-interest of the Least Squares Regression Line
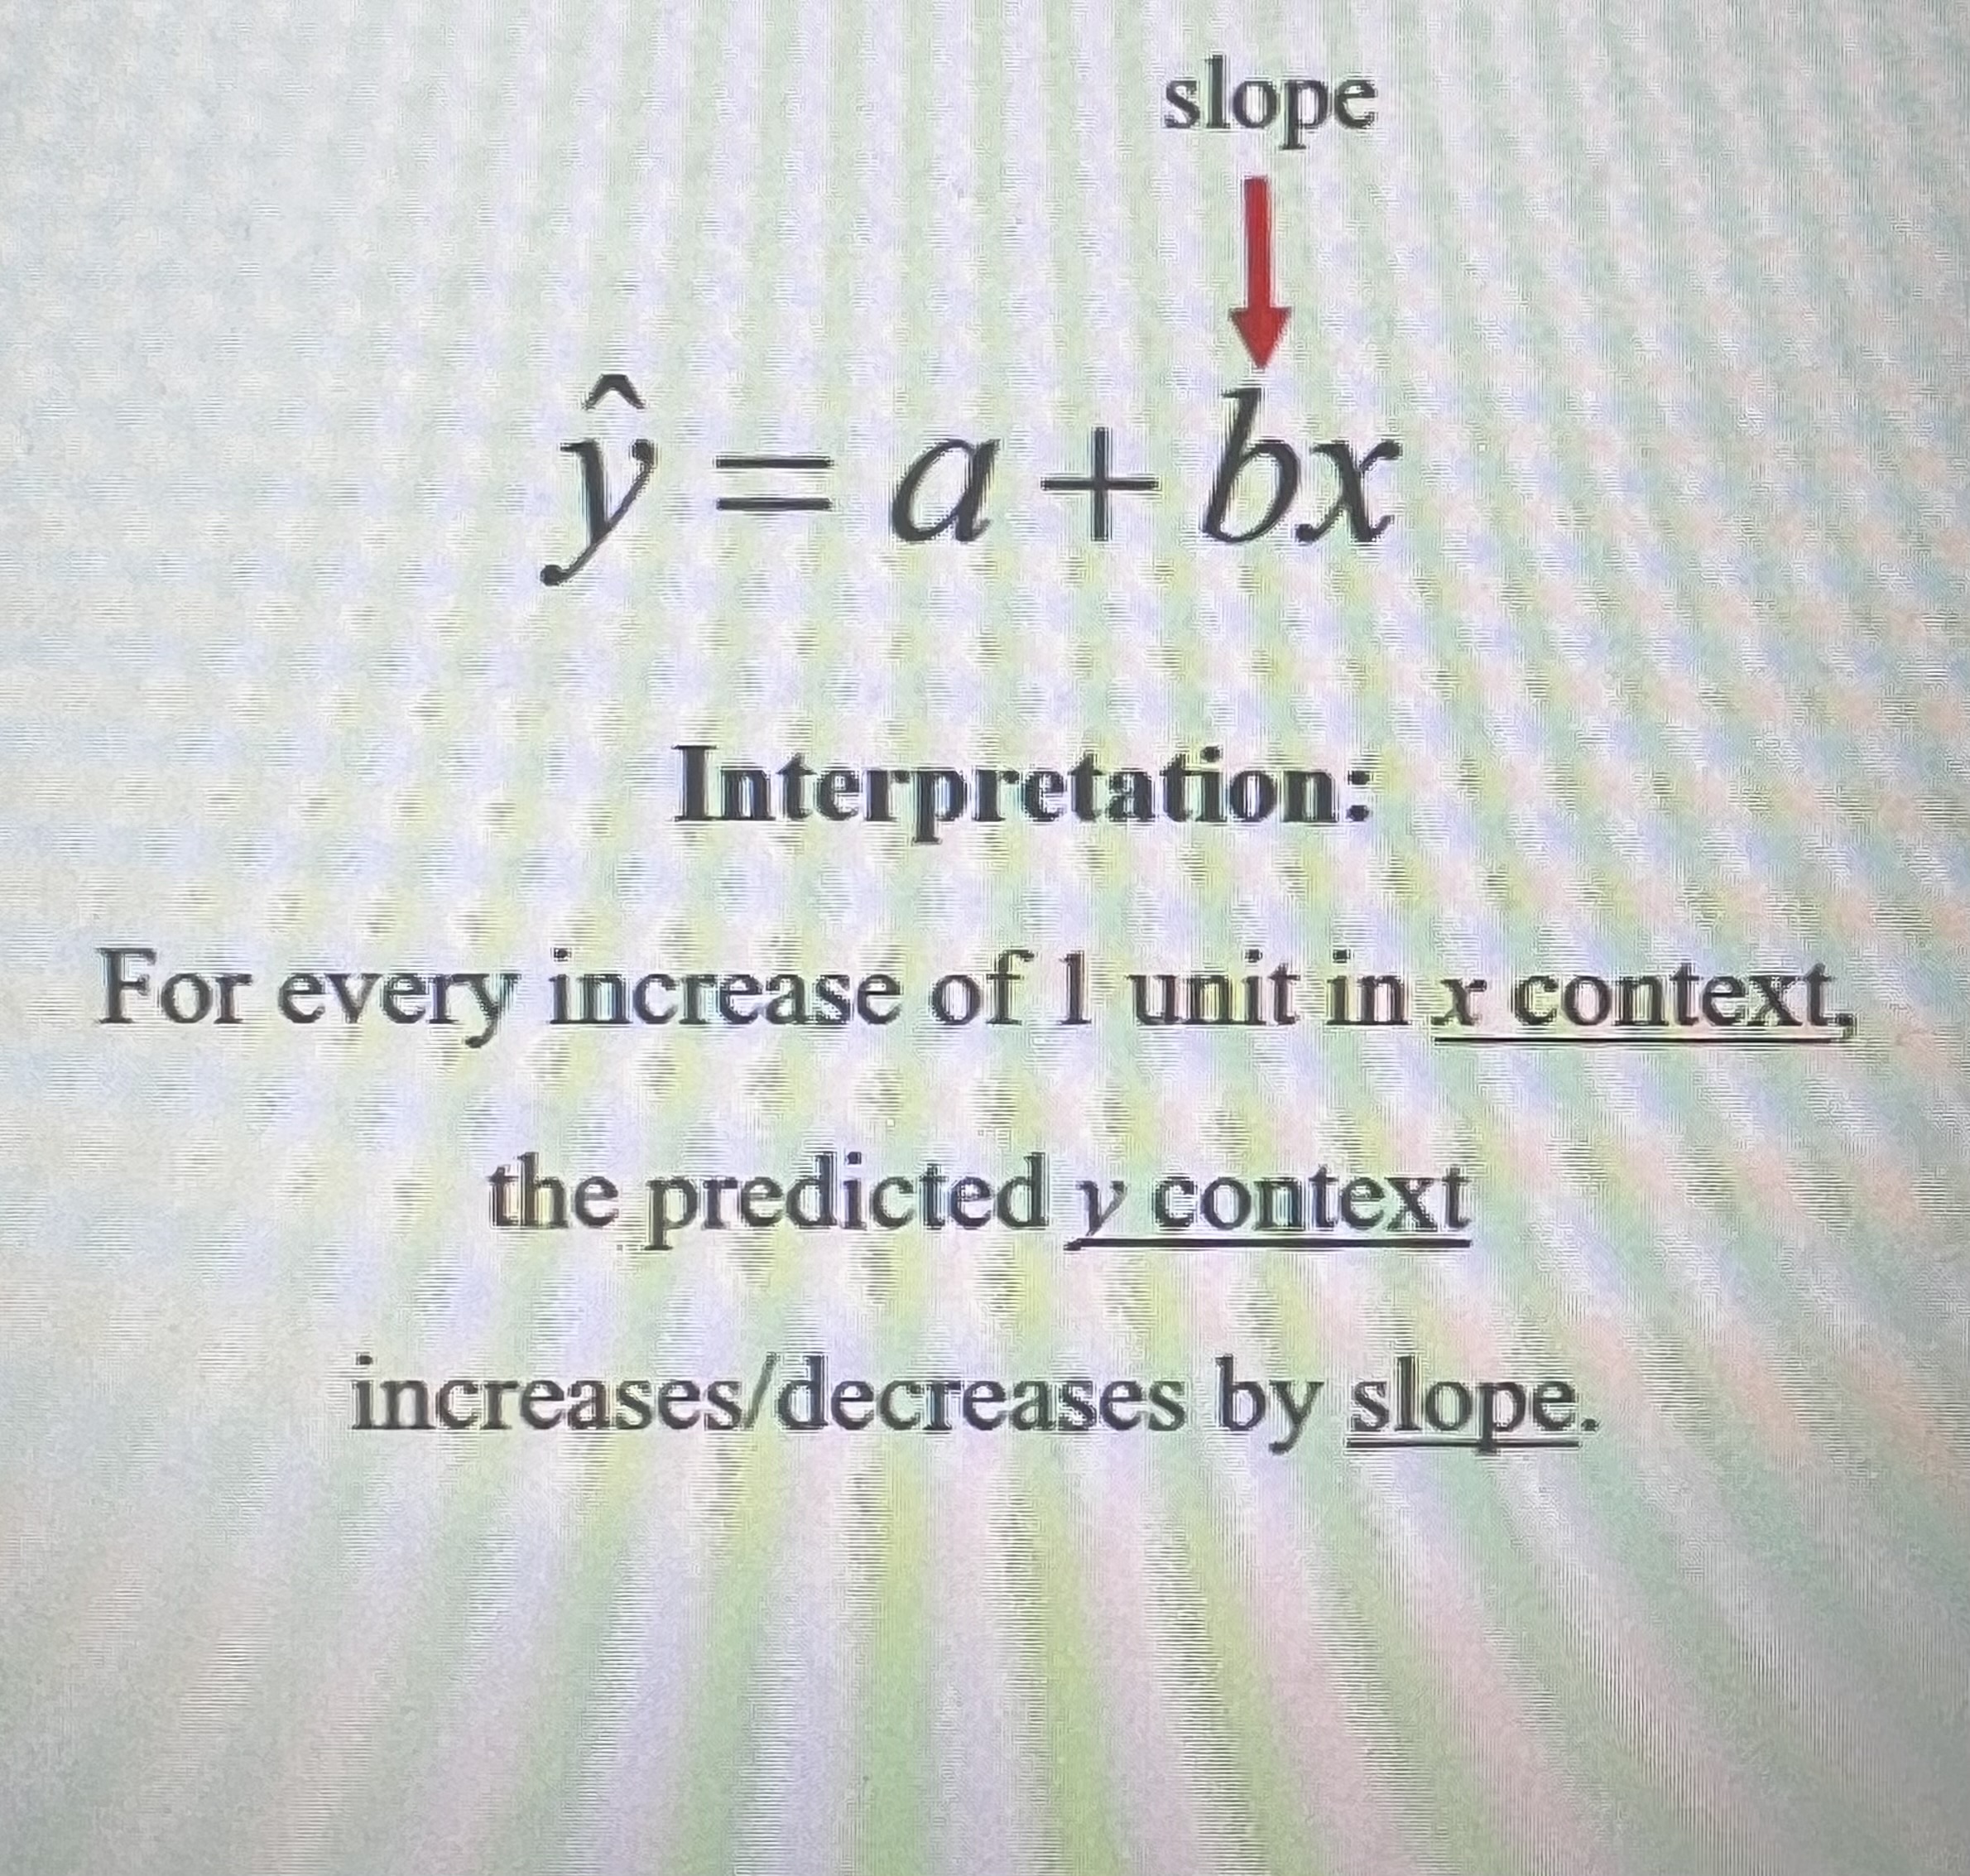
Interpret the slope of the Least Squares Regression Line
Interpret the coefficient of determination/ r²
the percent of the variation of y-context that is explained by the least squares regression line using x-context
Properties of correlation r
r is unitless.
r is always between -1 and 1.
r is greatly affected by regression outliers.
If the direction is negative, then r<0
If the direction is positive, then r>0.
The closer r is to -1 or 1, the stronger the relationship.
The closer r is to 0, the weaker the relationship.
Regression Outlier
a point that does not follow the general trend shown in the rest of the data and has a large residual.
Correlation r

High-Leverage Point (in regression)
has a substantially larger or smaller x-value than the other observations have.
Influential Point (in regression)
any point that, if removed, changes the relationship substantially. Outliers and high leverage point area often influential.
What is the difference between categorical and quantitative variables?
Categorical variables take on values that are category names or group labels.
Quantitative variables take on numerical values for a measured or counted quantity.
What is the difference between discrete and continuous variables?
a discrete variable can take on a countable number of values. The number of values may be finite or infinite.
ex: number of students, countable.
a continuous variable can take on infinitely many values, but those values cannot be counted.
ex:height, must be measured.
What is a control group and what is its purpose?
a collection of experiment units either not given a treat of interest or given a placebo.
its purpose is to provide a baseline to which the treatment groups can be compared, so it can be determined if the treatments have an effect.
What is single blind & double blind?
in a single blind, subject do not know which treatment they are getting, but the researchers do, or vice-versa.
in a double blind, neither researchers or subjects know which treatment a subject is getting.
What are 2 poor sampling methods?
convenience sampling
voluntary response sampling
Not random
What’s an explanatory variable? (or factor)
a variable whose levels are manipulated intentionally.
What’s a response variable?
an outcome from the experimental units that is measured after the treatments have been administered.
Nonresponse Bias
Selected people do not respond
Under coverage Bias
systematically excluding people from being able to be selected
Response bias
provided inaccurate responses
wording issues
worded dumb
Bias
the systematic tendency to over or under estimate the true population parameter
Can the results of a survey or experiment be generalized to a larger population?
the results can only be generalized to the population from which the sample/subjects were randomly selected
if not randomly selected, the results can only be generalized to people like the ones in the study.
Observation study vs experiment
Did the researchers impose a treatment?
NO- observation study
YES-experiment
When can we make conclusion about cause and effect?
Did the researchers randomly assign the subject to treatment groups?
YES- you can make conclusions
NO-NO, get fucked. you CANNOT say that the explanatory variable caused the change in the response variable.
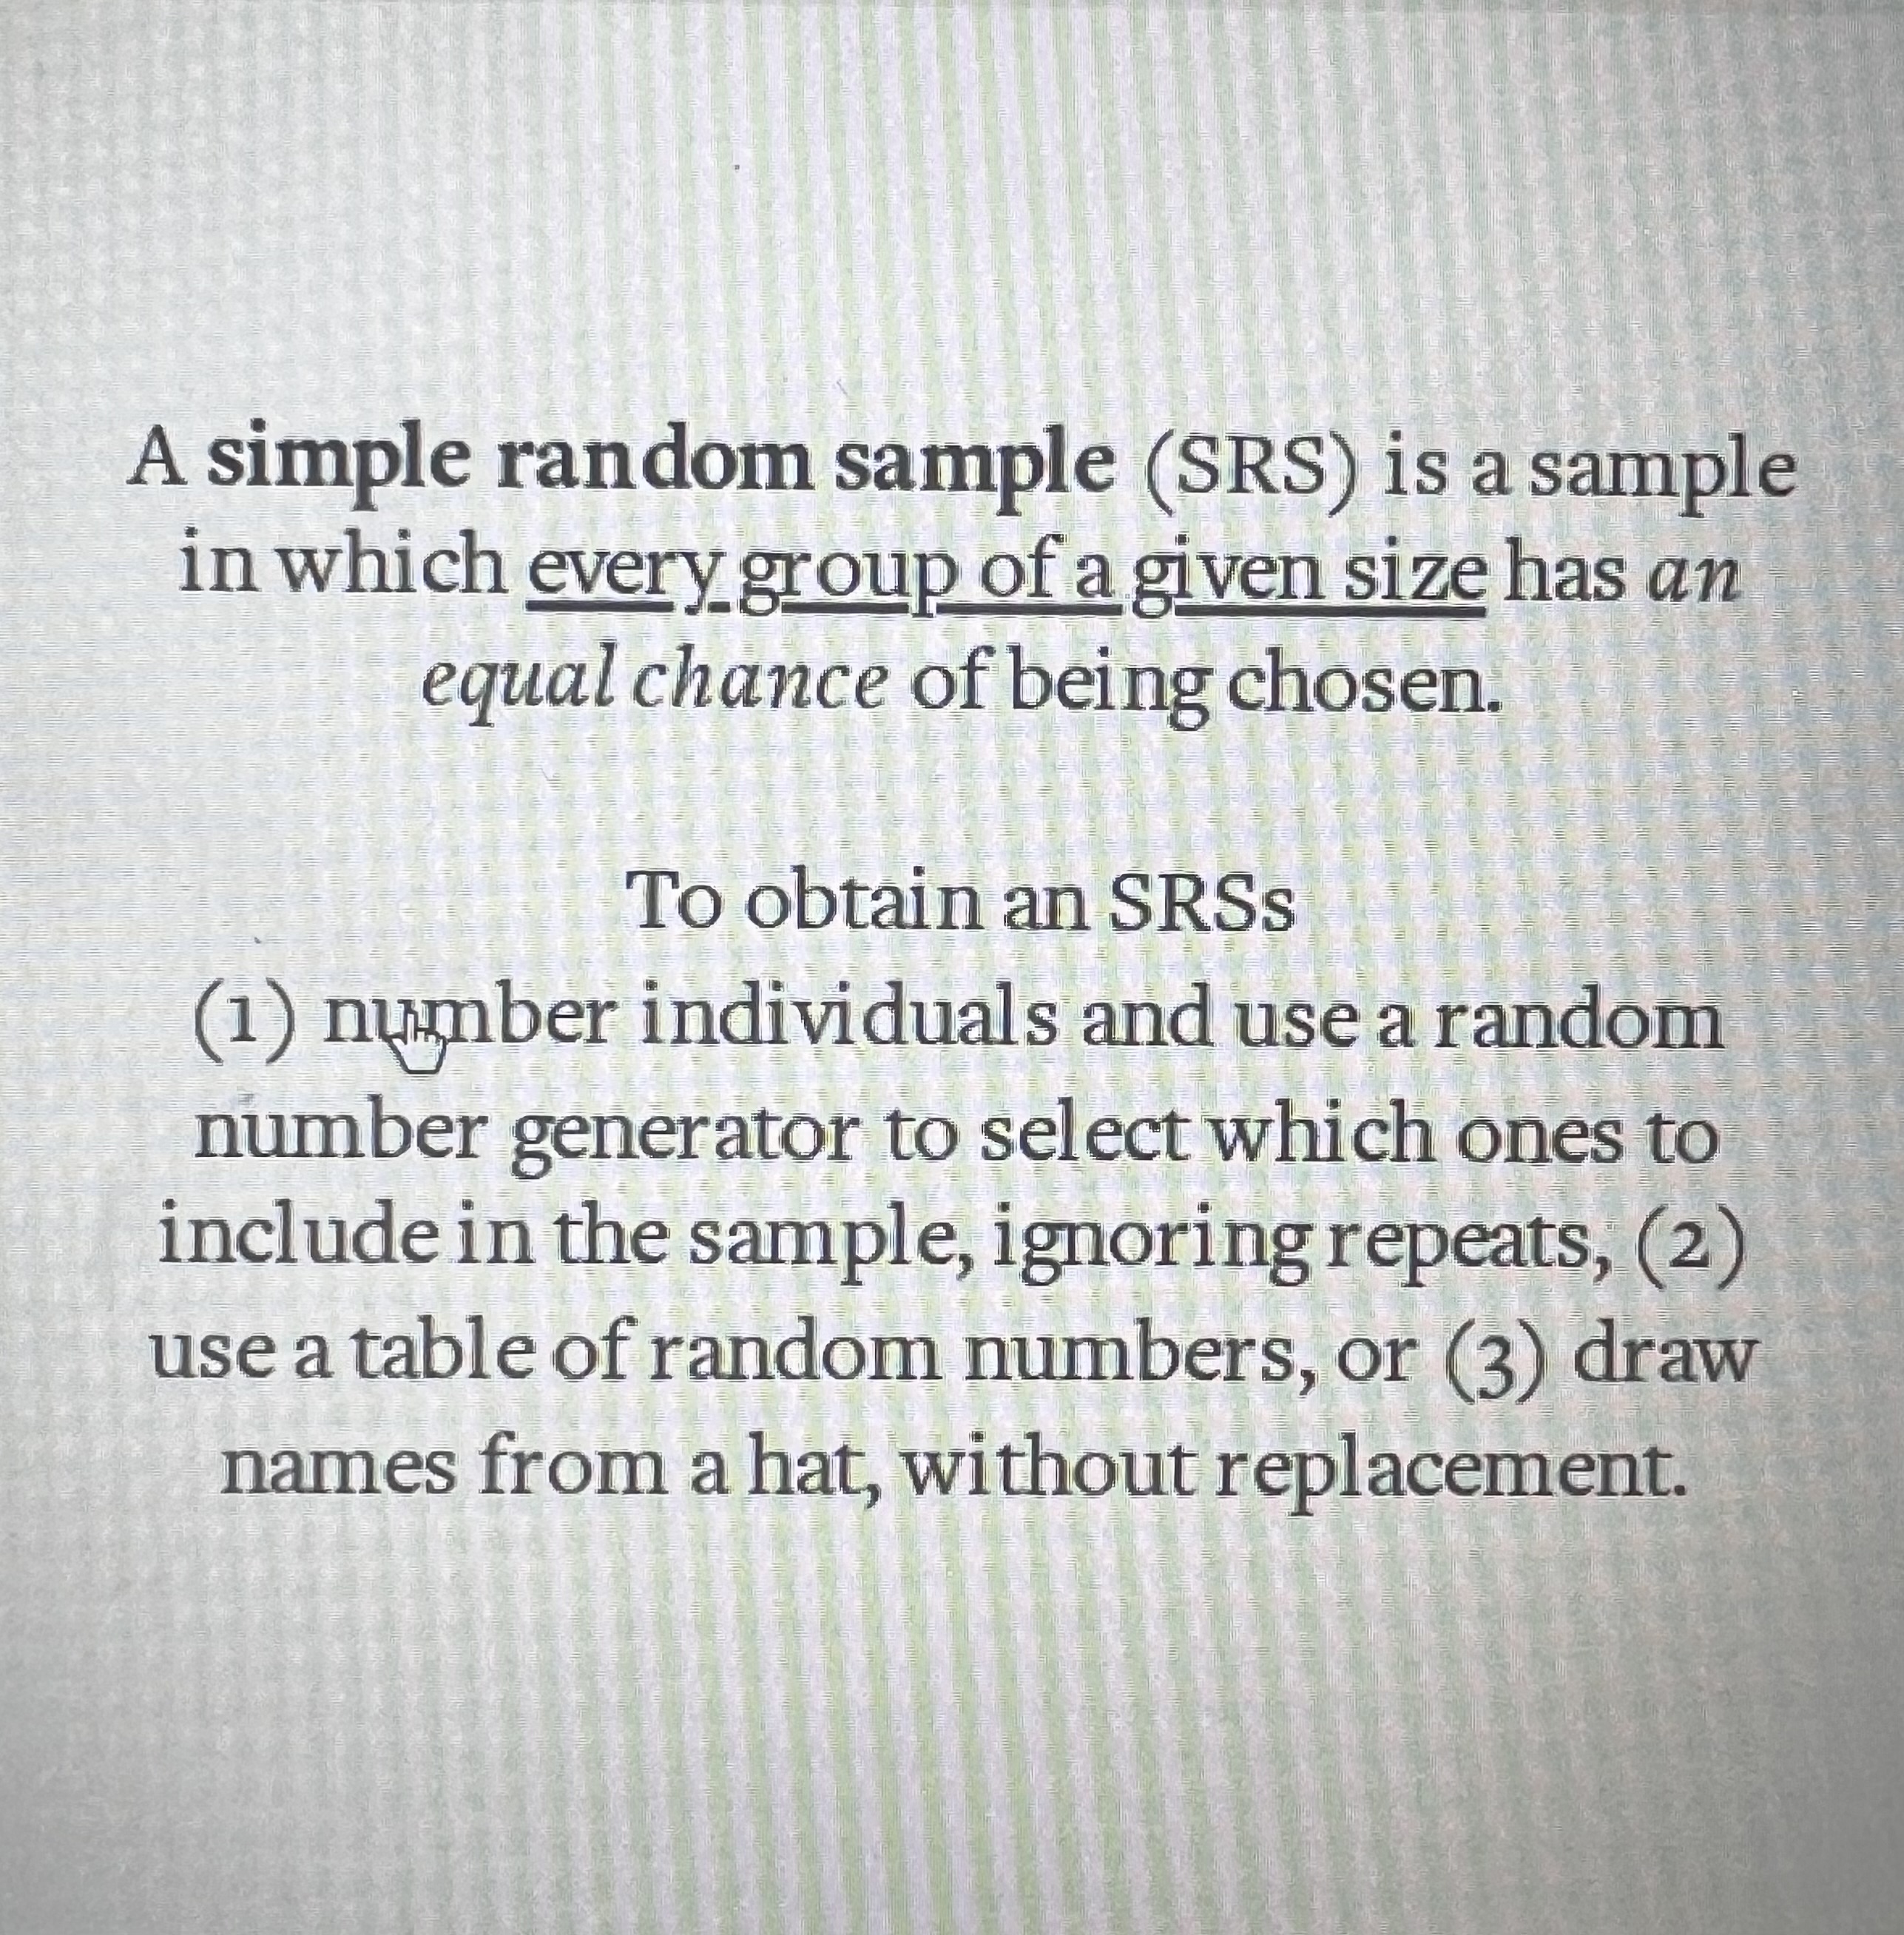
SRS
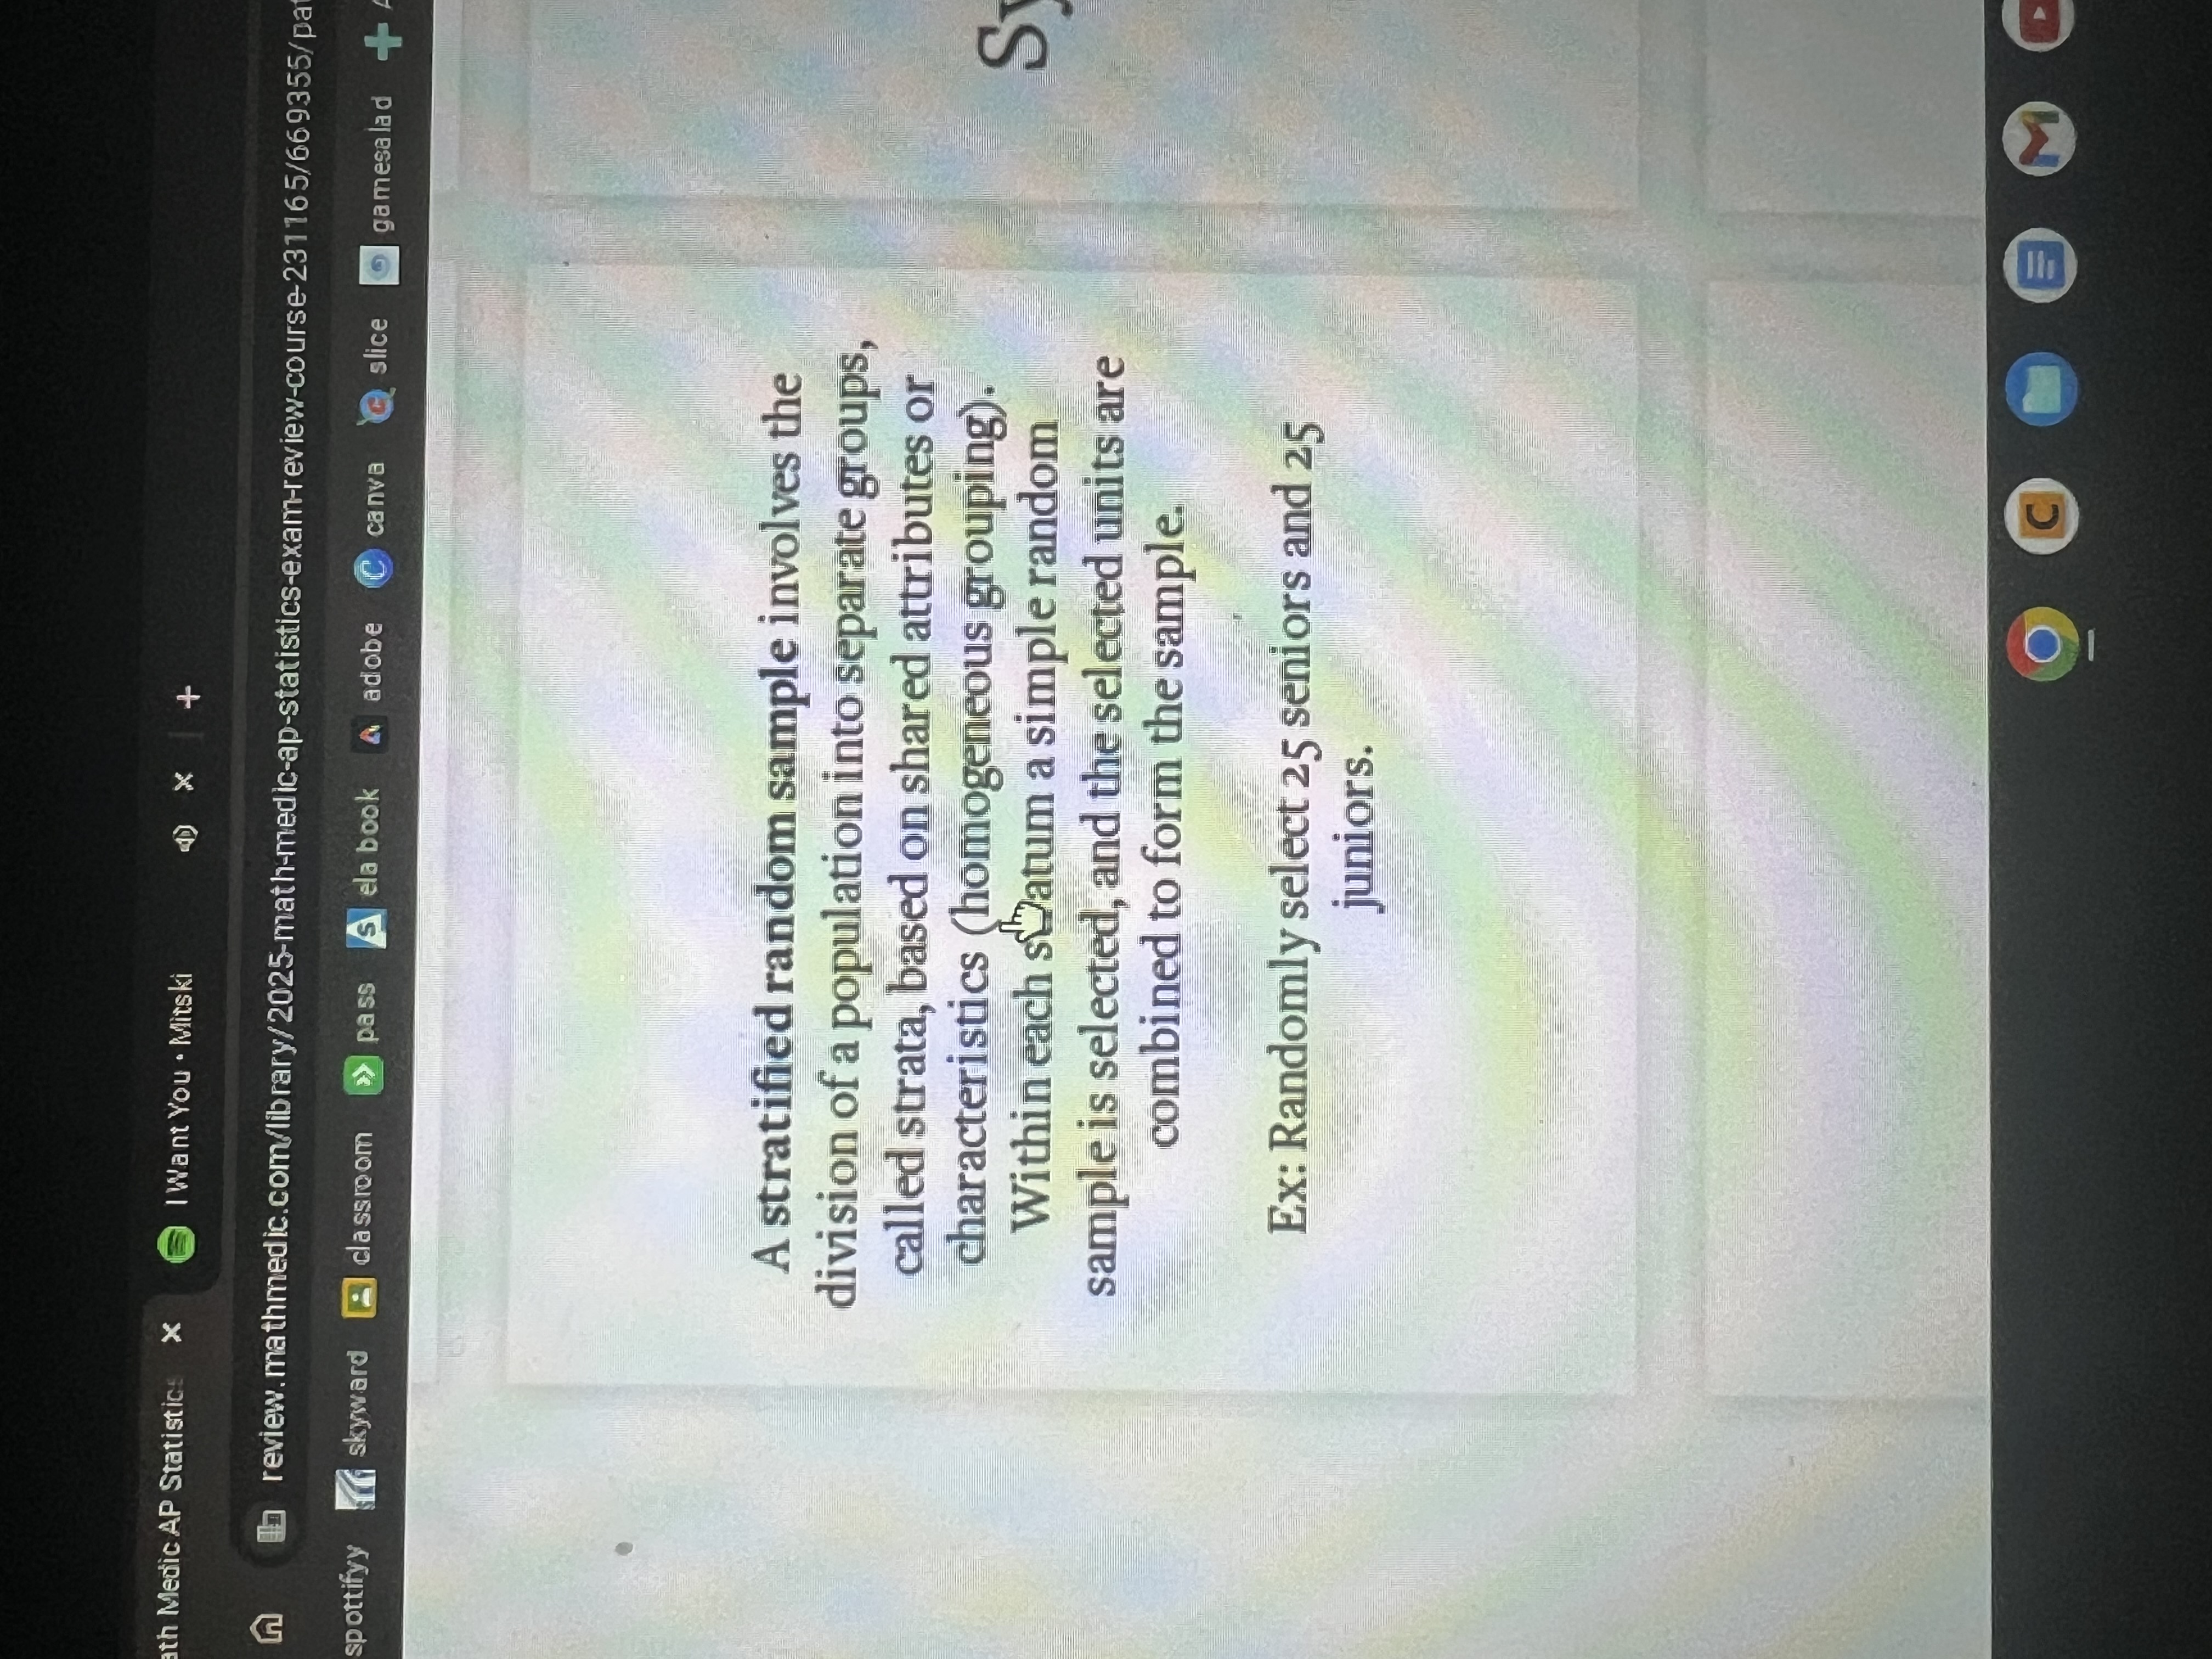
Stratified random sample
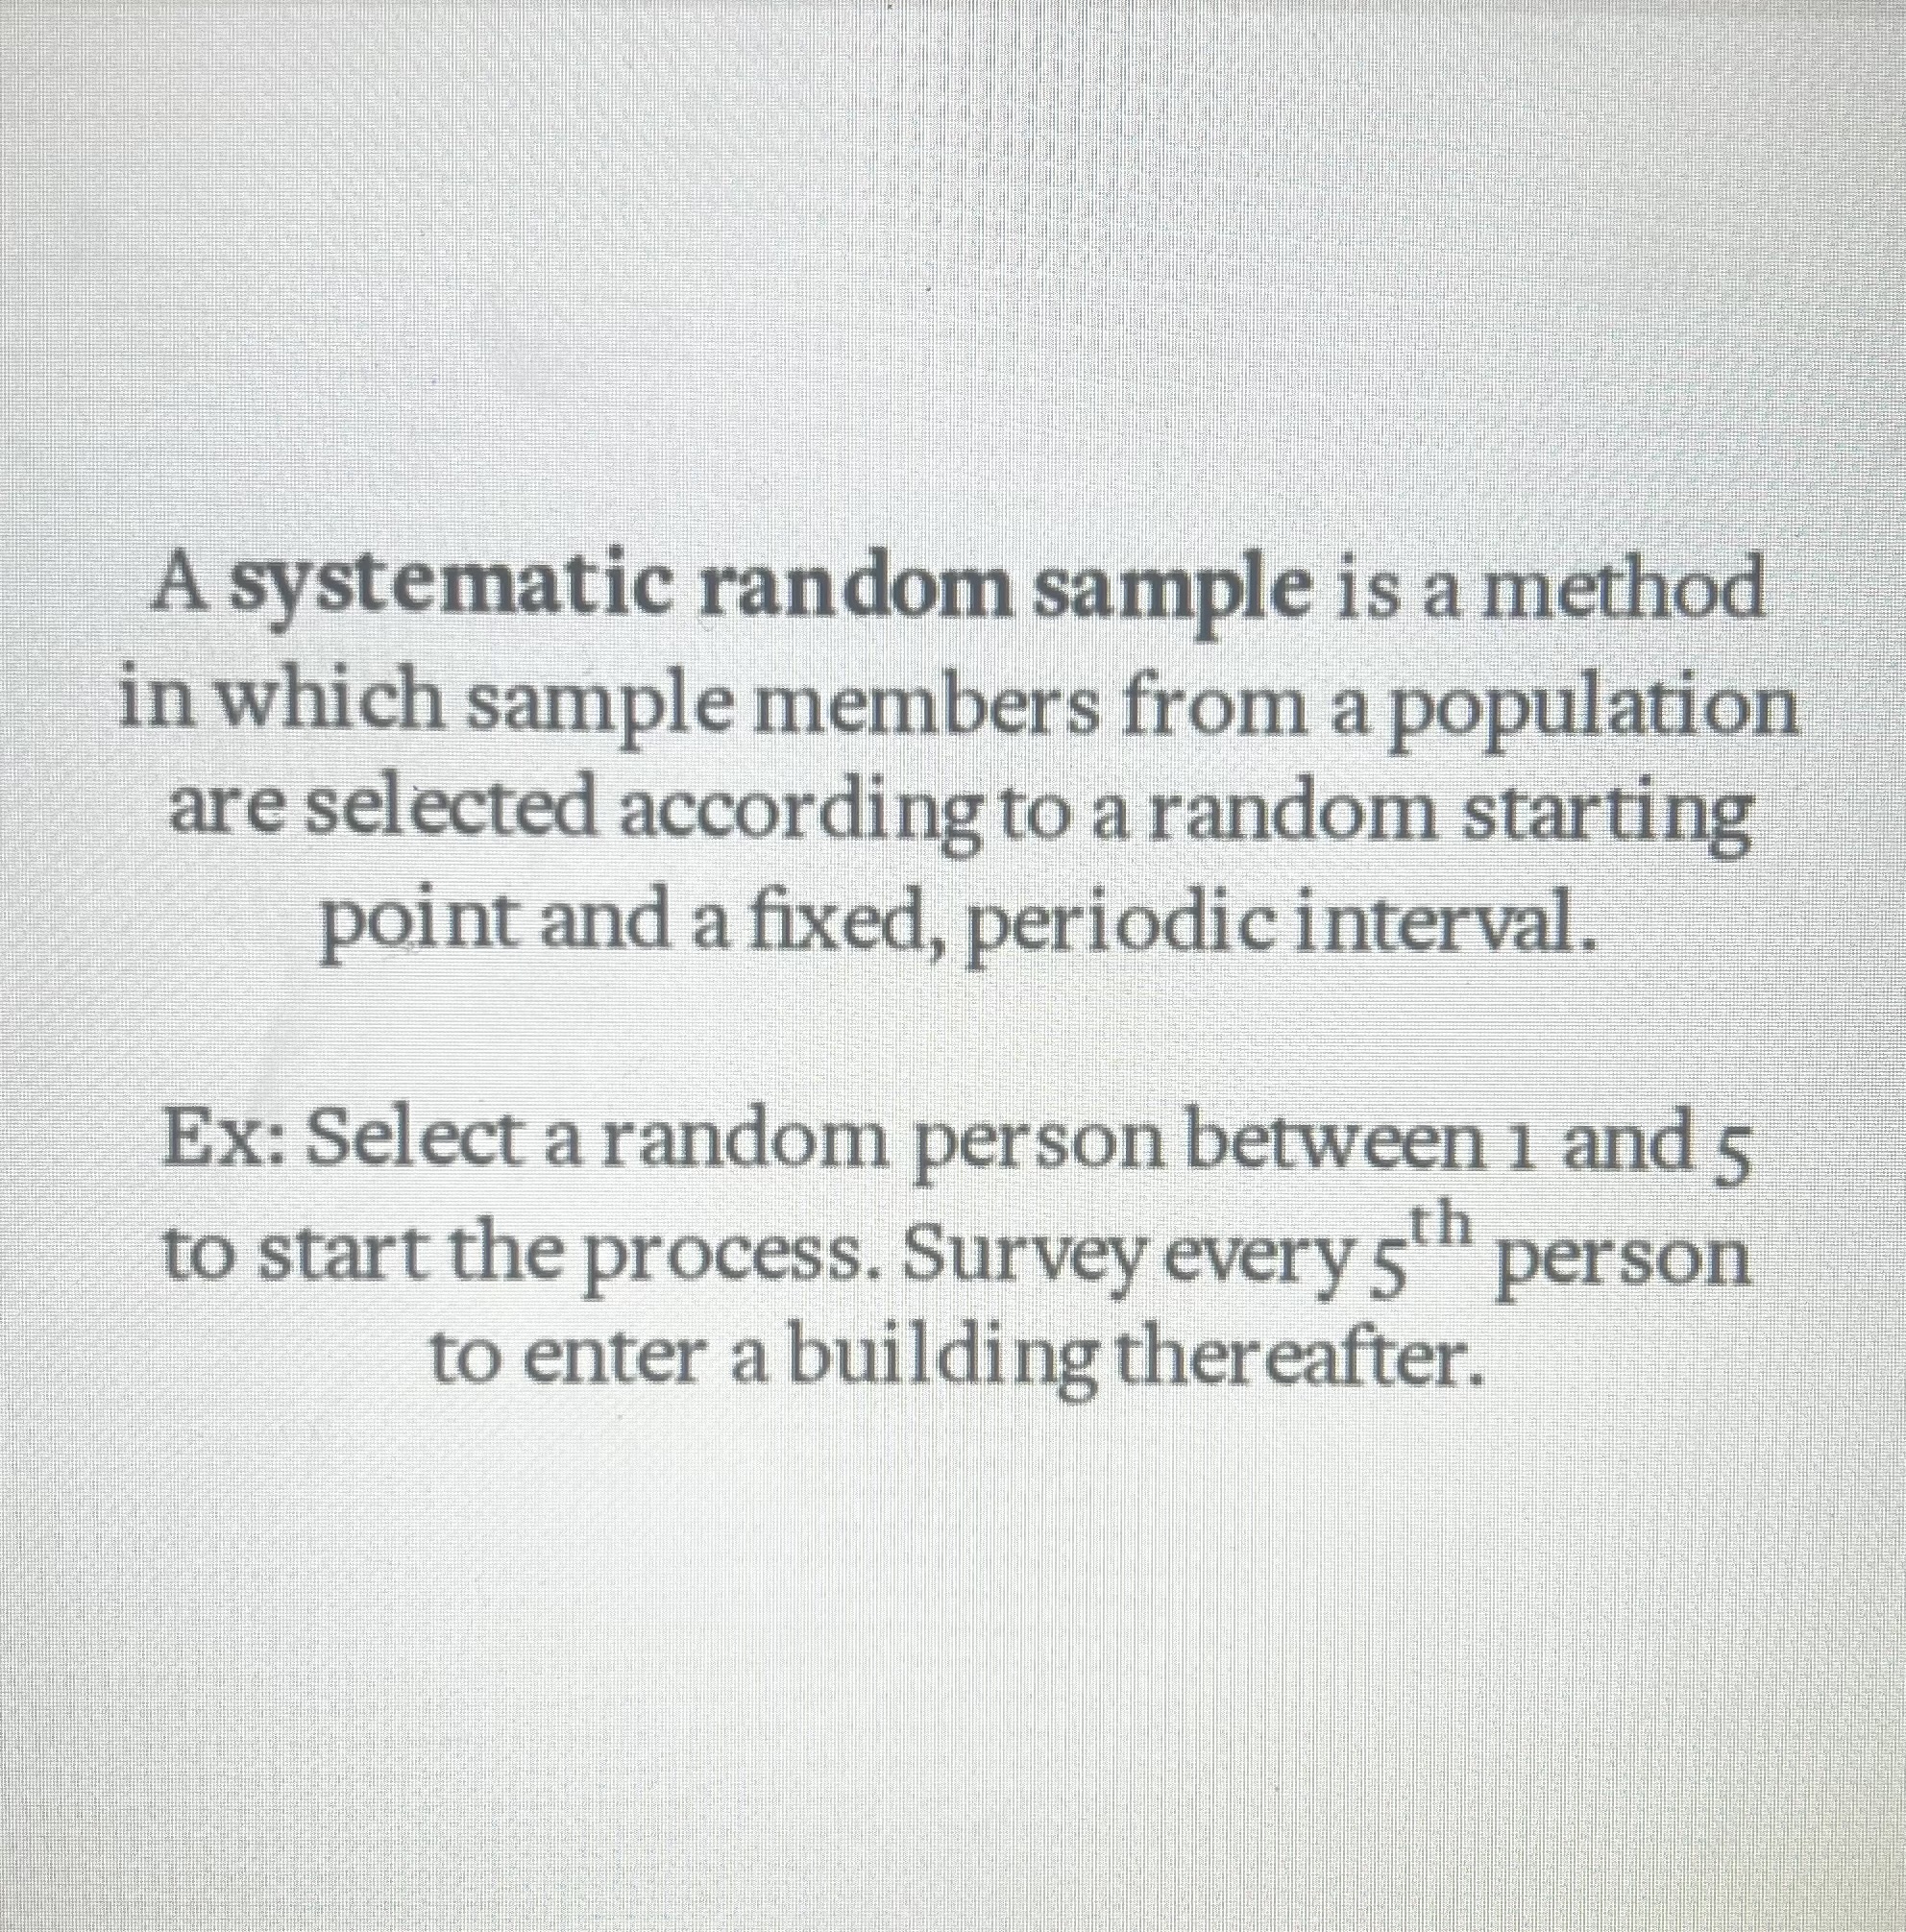
systematic random sample
confounding variable
a variable that is related to the explanatory variable and influenced the response variable and makes it challenging to determinate cause and effect
What should a well designed experiment include?
Comparisons of at least two treatment groups, one of which could be a control group.
Random assignment of treatments to experimental units
Replication (enough experimental units in each treatment group to be able to detect a difference)
Control of potential confounding variables where appropriate.
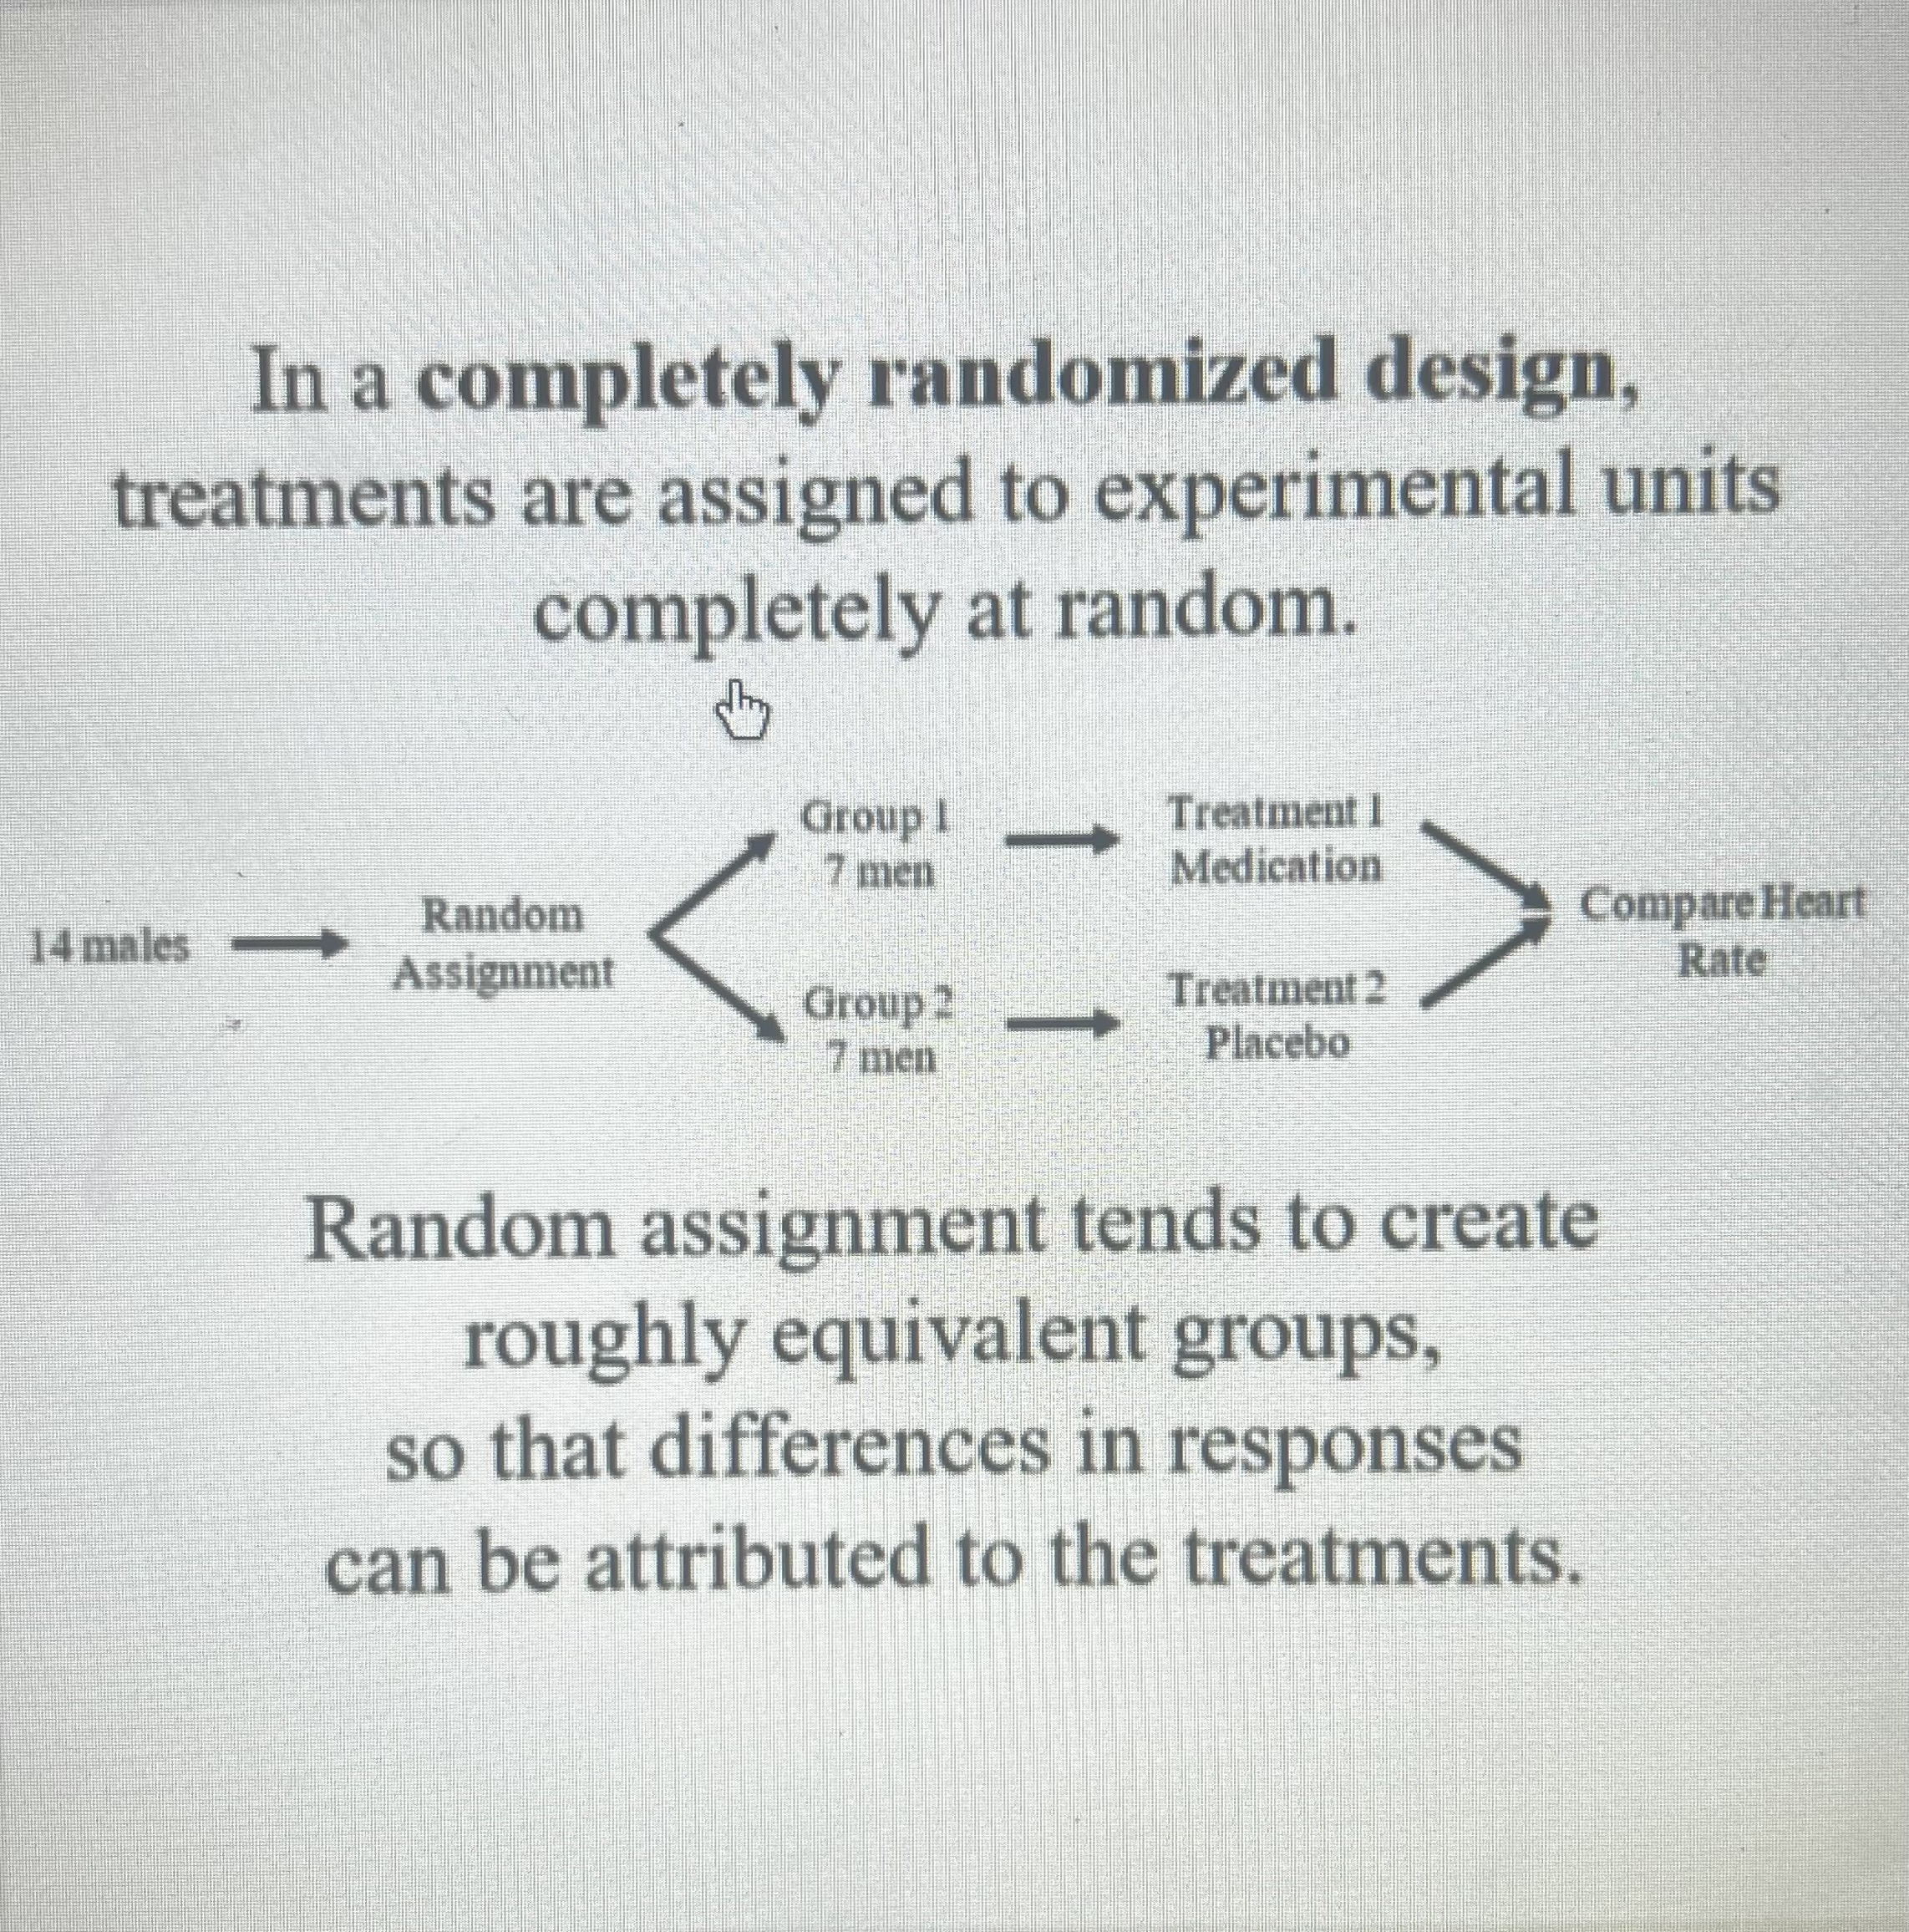
Complete randomized design
What is a randomized block design and what is its purpose?
Treatments are assigned randomly within each block. For each block, indians are similar to eachother with respect to at least one blocking variable.
Its purpose is to reduce the variability of results within each treatment group, and to eliminate the possibility of the blocking variable as a confounding variable.
Matched Pairs design
-a special case of a randomized block design. using a blocking variable, subjects are arranged in pairs matched on one or more relevant factors. Every pair recovers both treatments by randomly assigning one treatment to one, and the other to the other. alternatively, each subject may get both treatments
How would you carry out a random assignment by selecting from a hat
Write each subjects name on an equal sized piece of paper
Put all the slips of paper in a hat. Mix well
Select as many names as needed for each treatment group, without replacement.
Mutually Exclusive events (disjoint)
they cannot occur at the same time. P(A & B) =0
How do you calculate P(A & B)?
= P(A) times P(B|A)
what’s the difference between binopdf & binocdf?
binopdf calculates the probability of x successes
binocdf calculates the cumulative probability of x or fewer successes
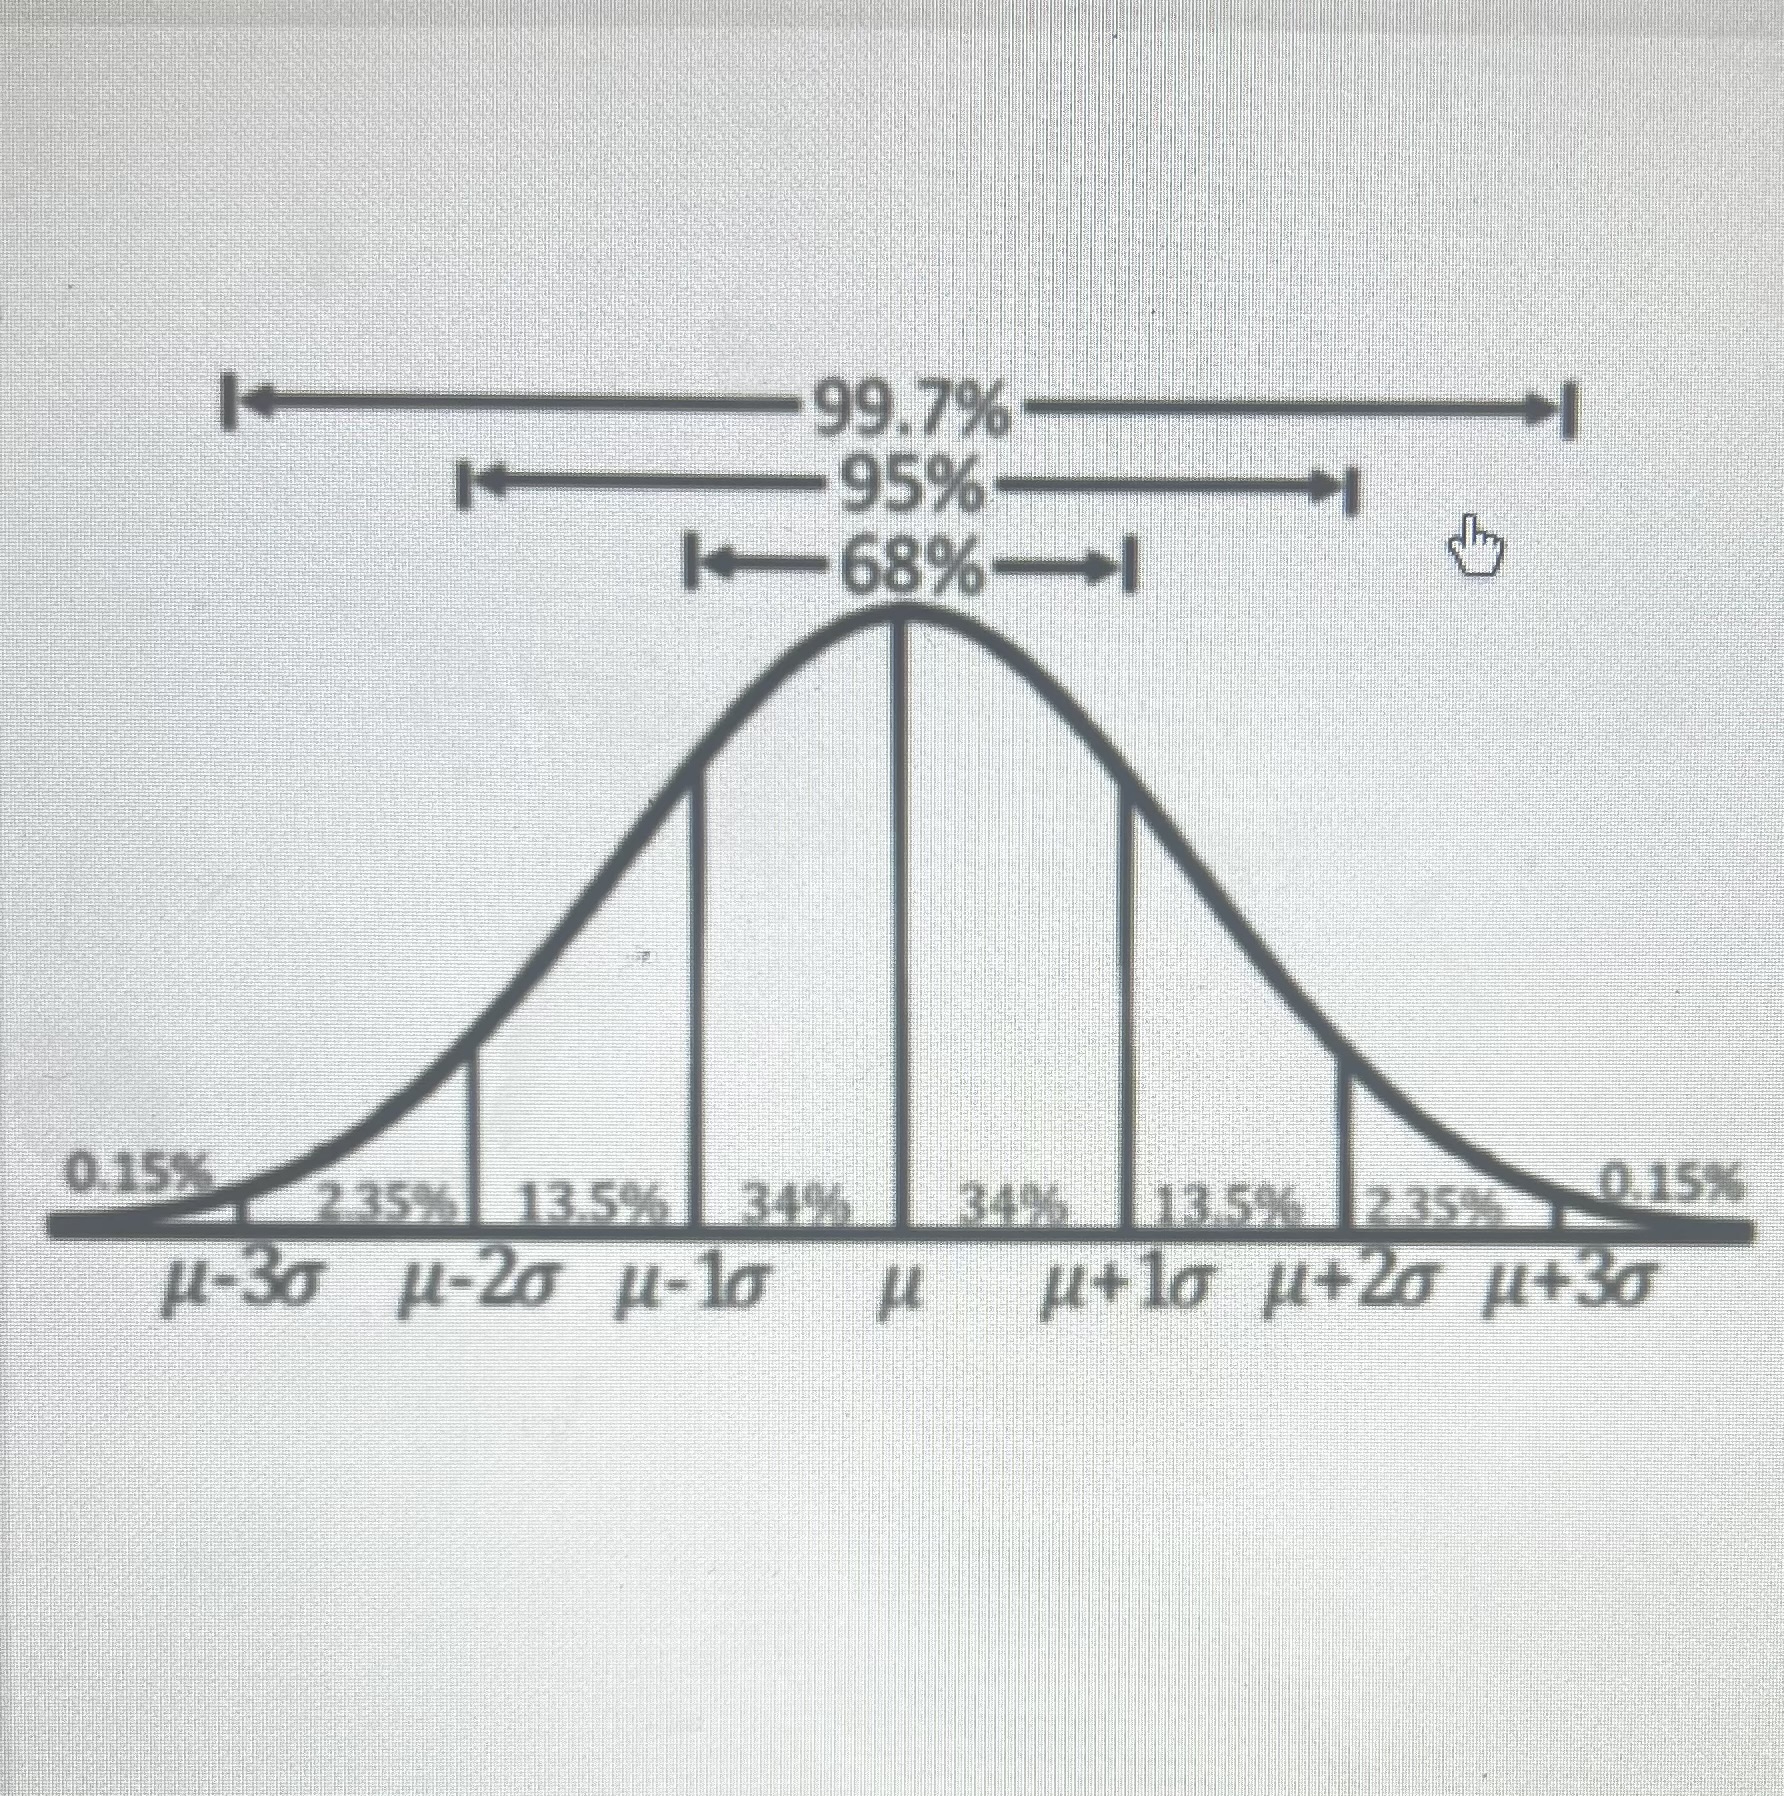
Empirical Rule
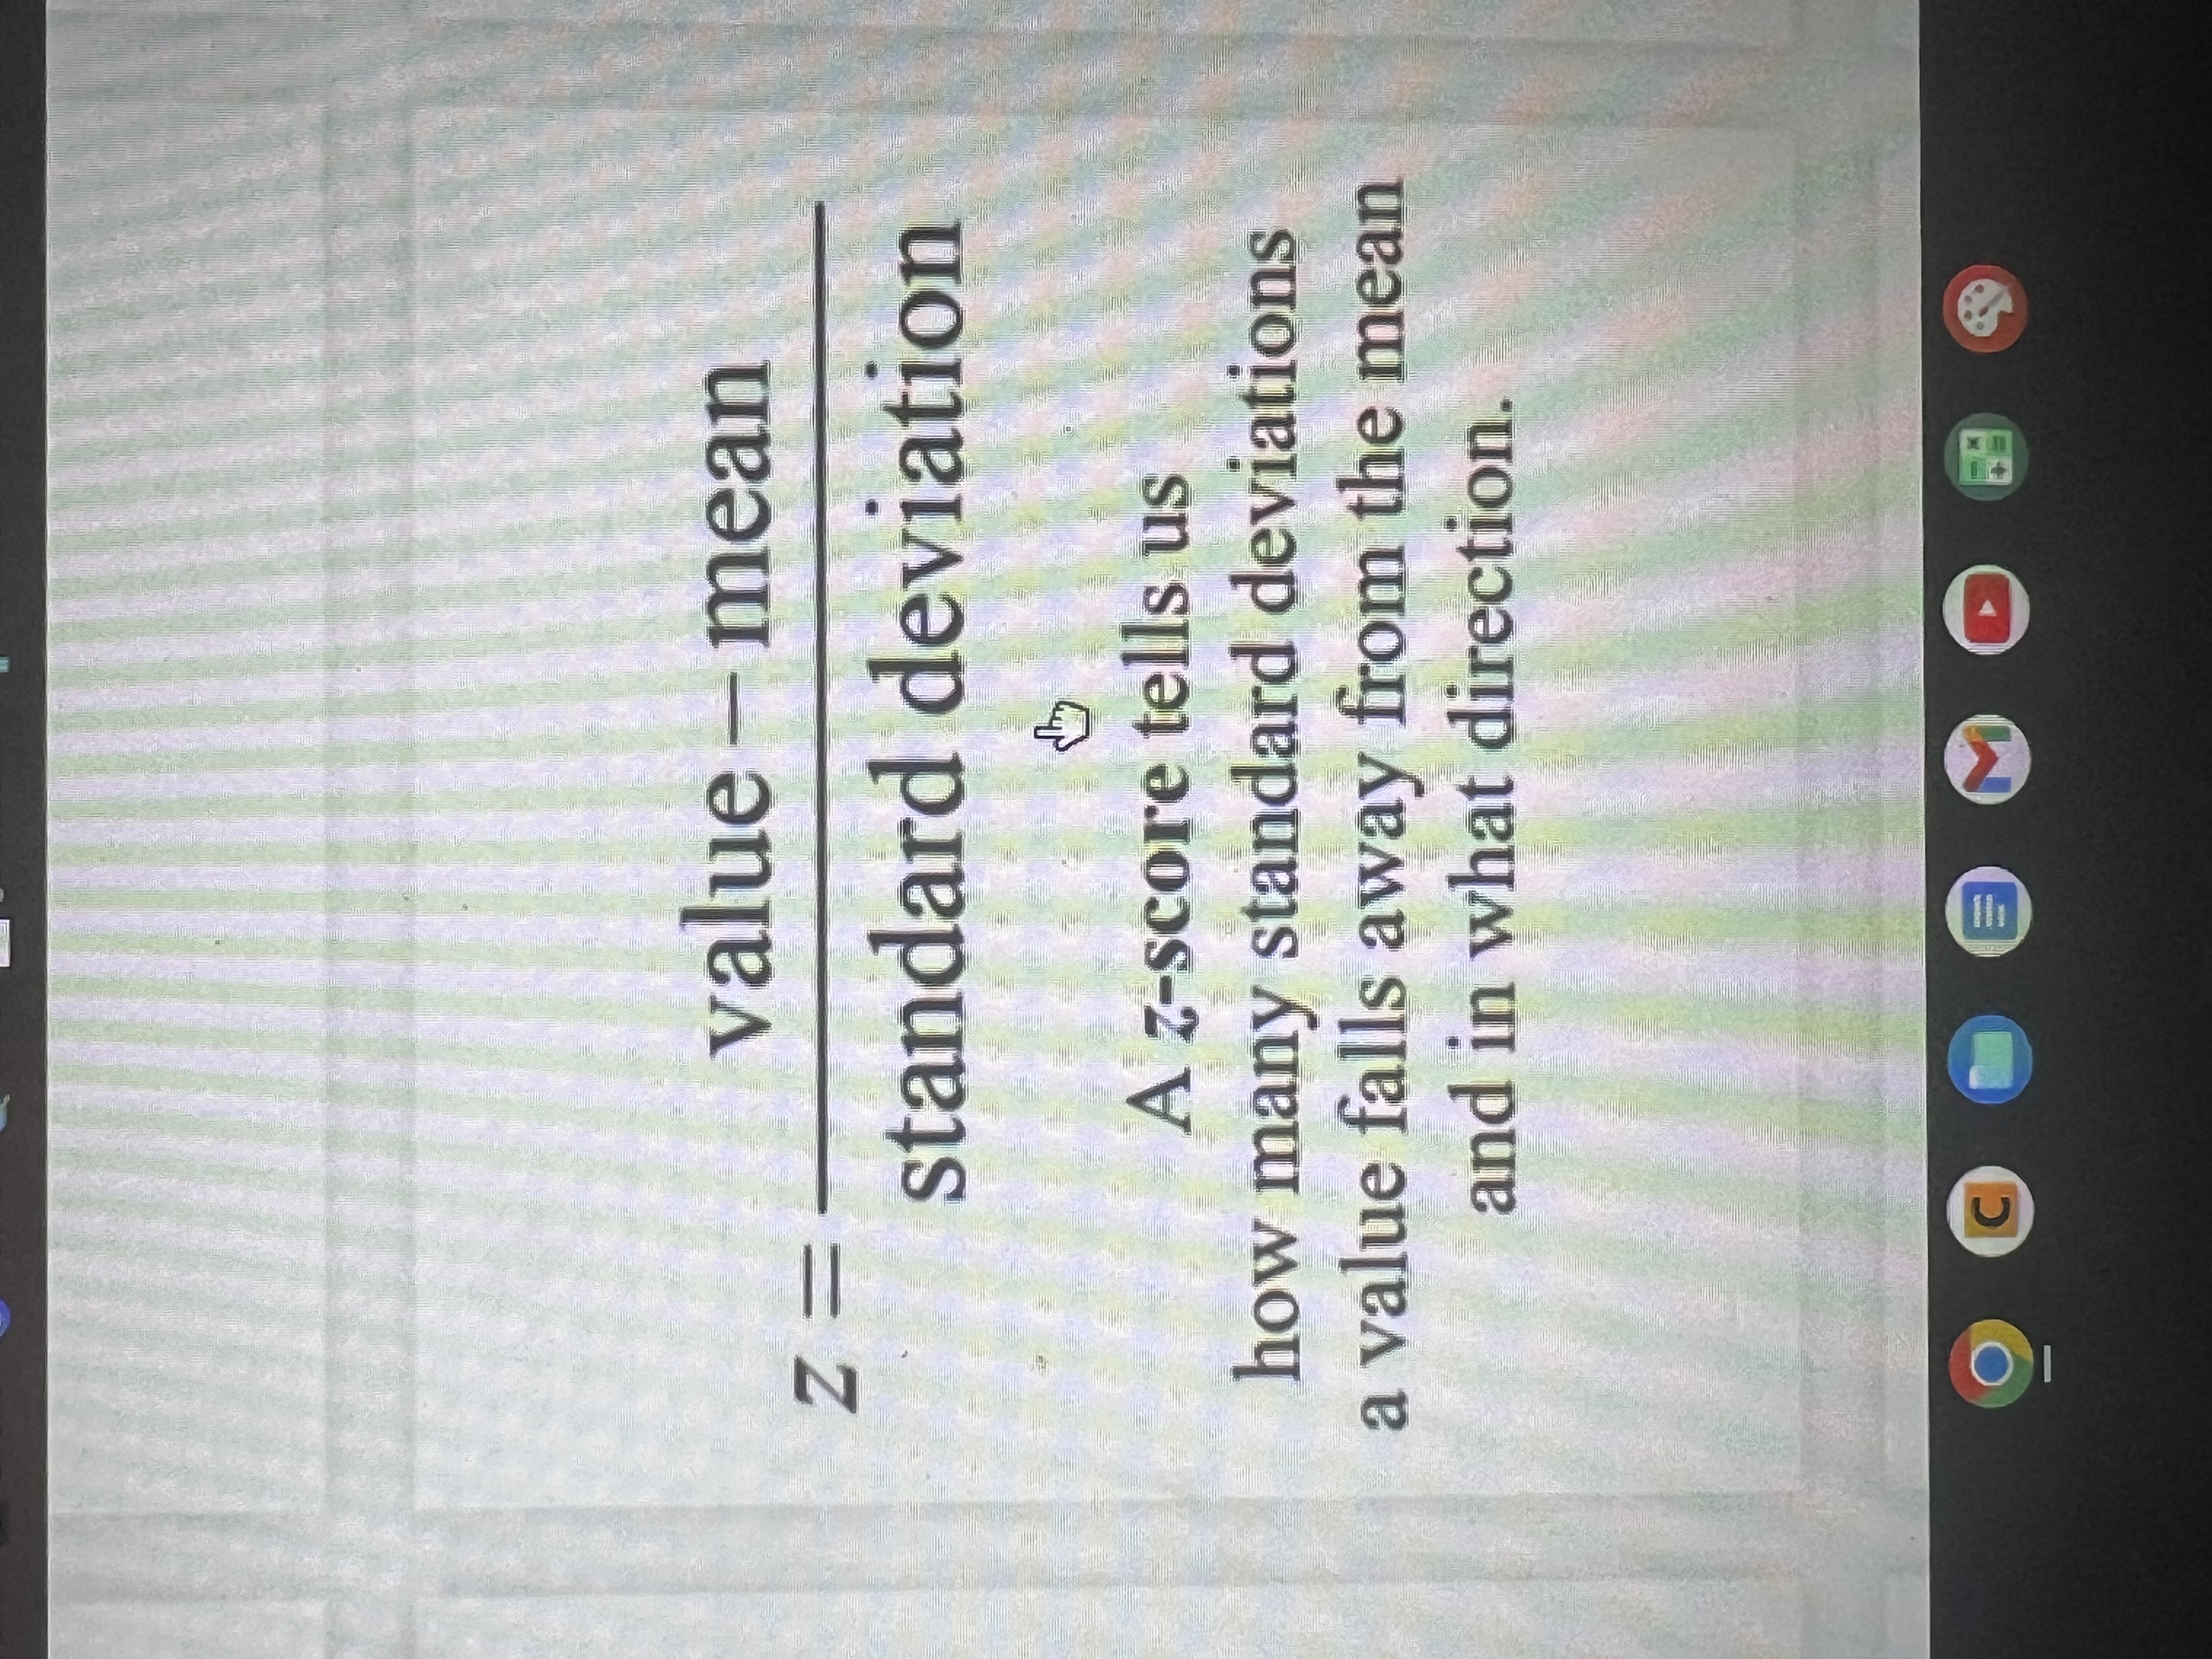
interpretation of a z-score
how many standard deviation a value falls away from the mean and in what direction
z-score formula
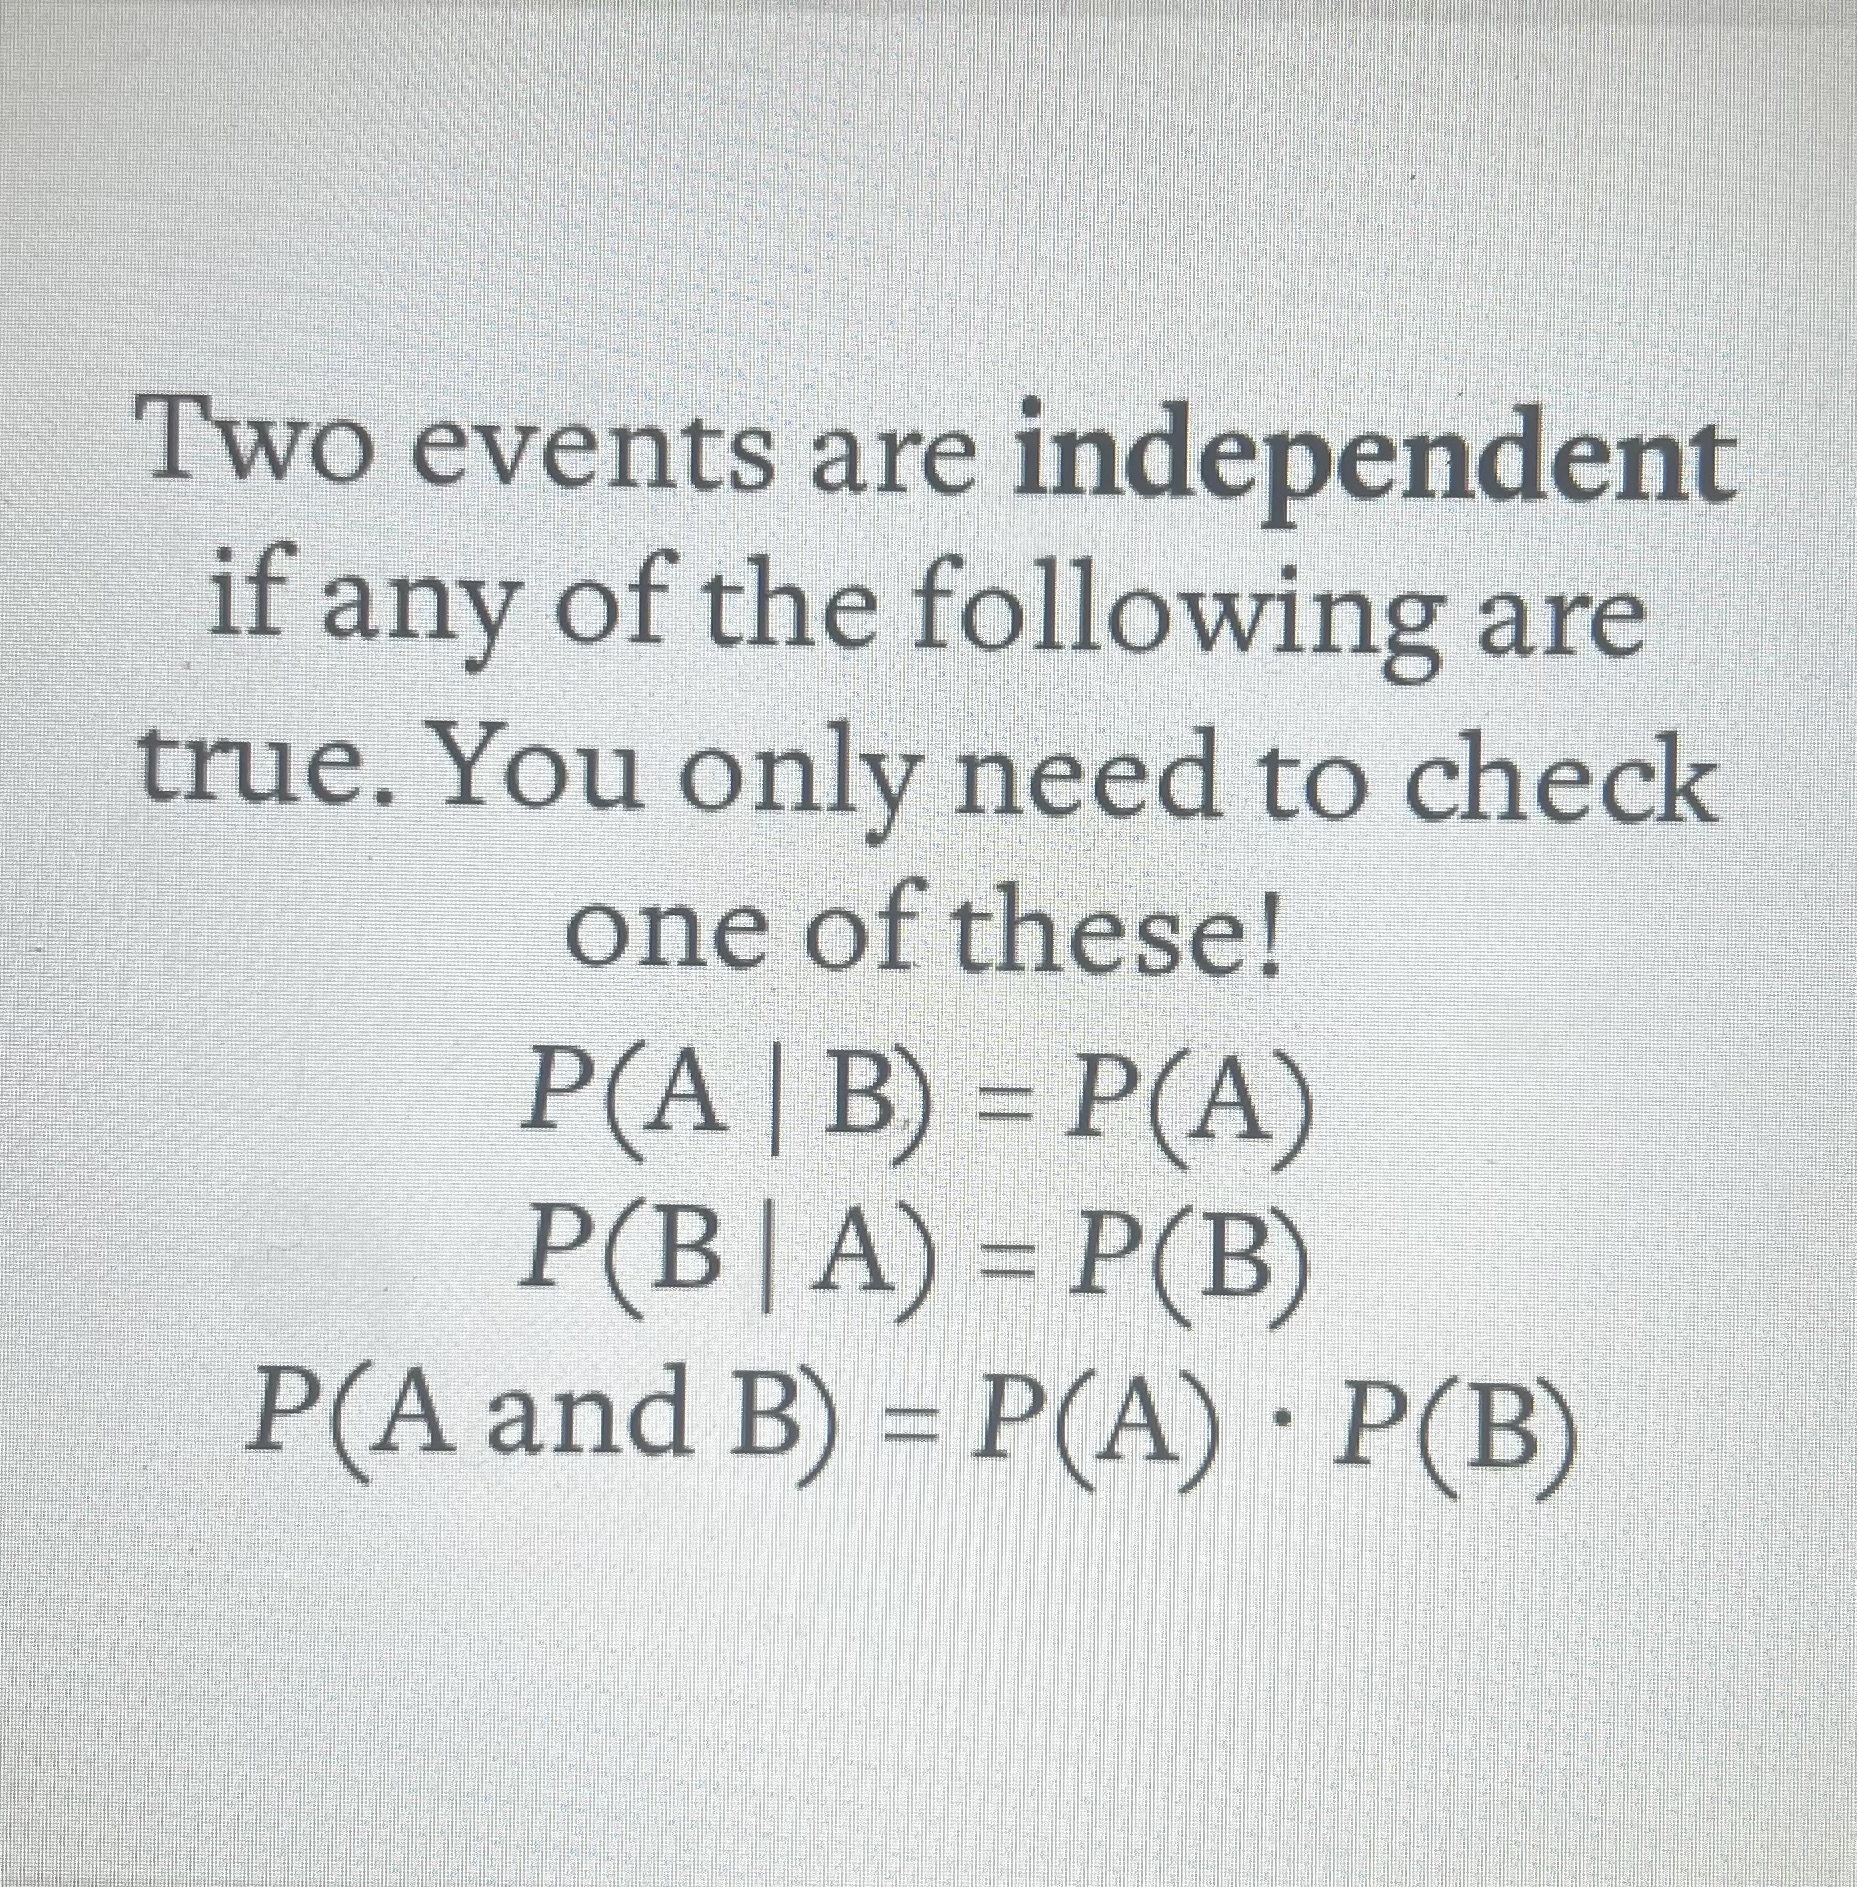
How can you tell if two events are independent?
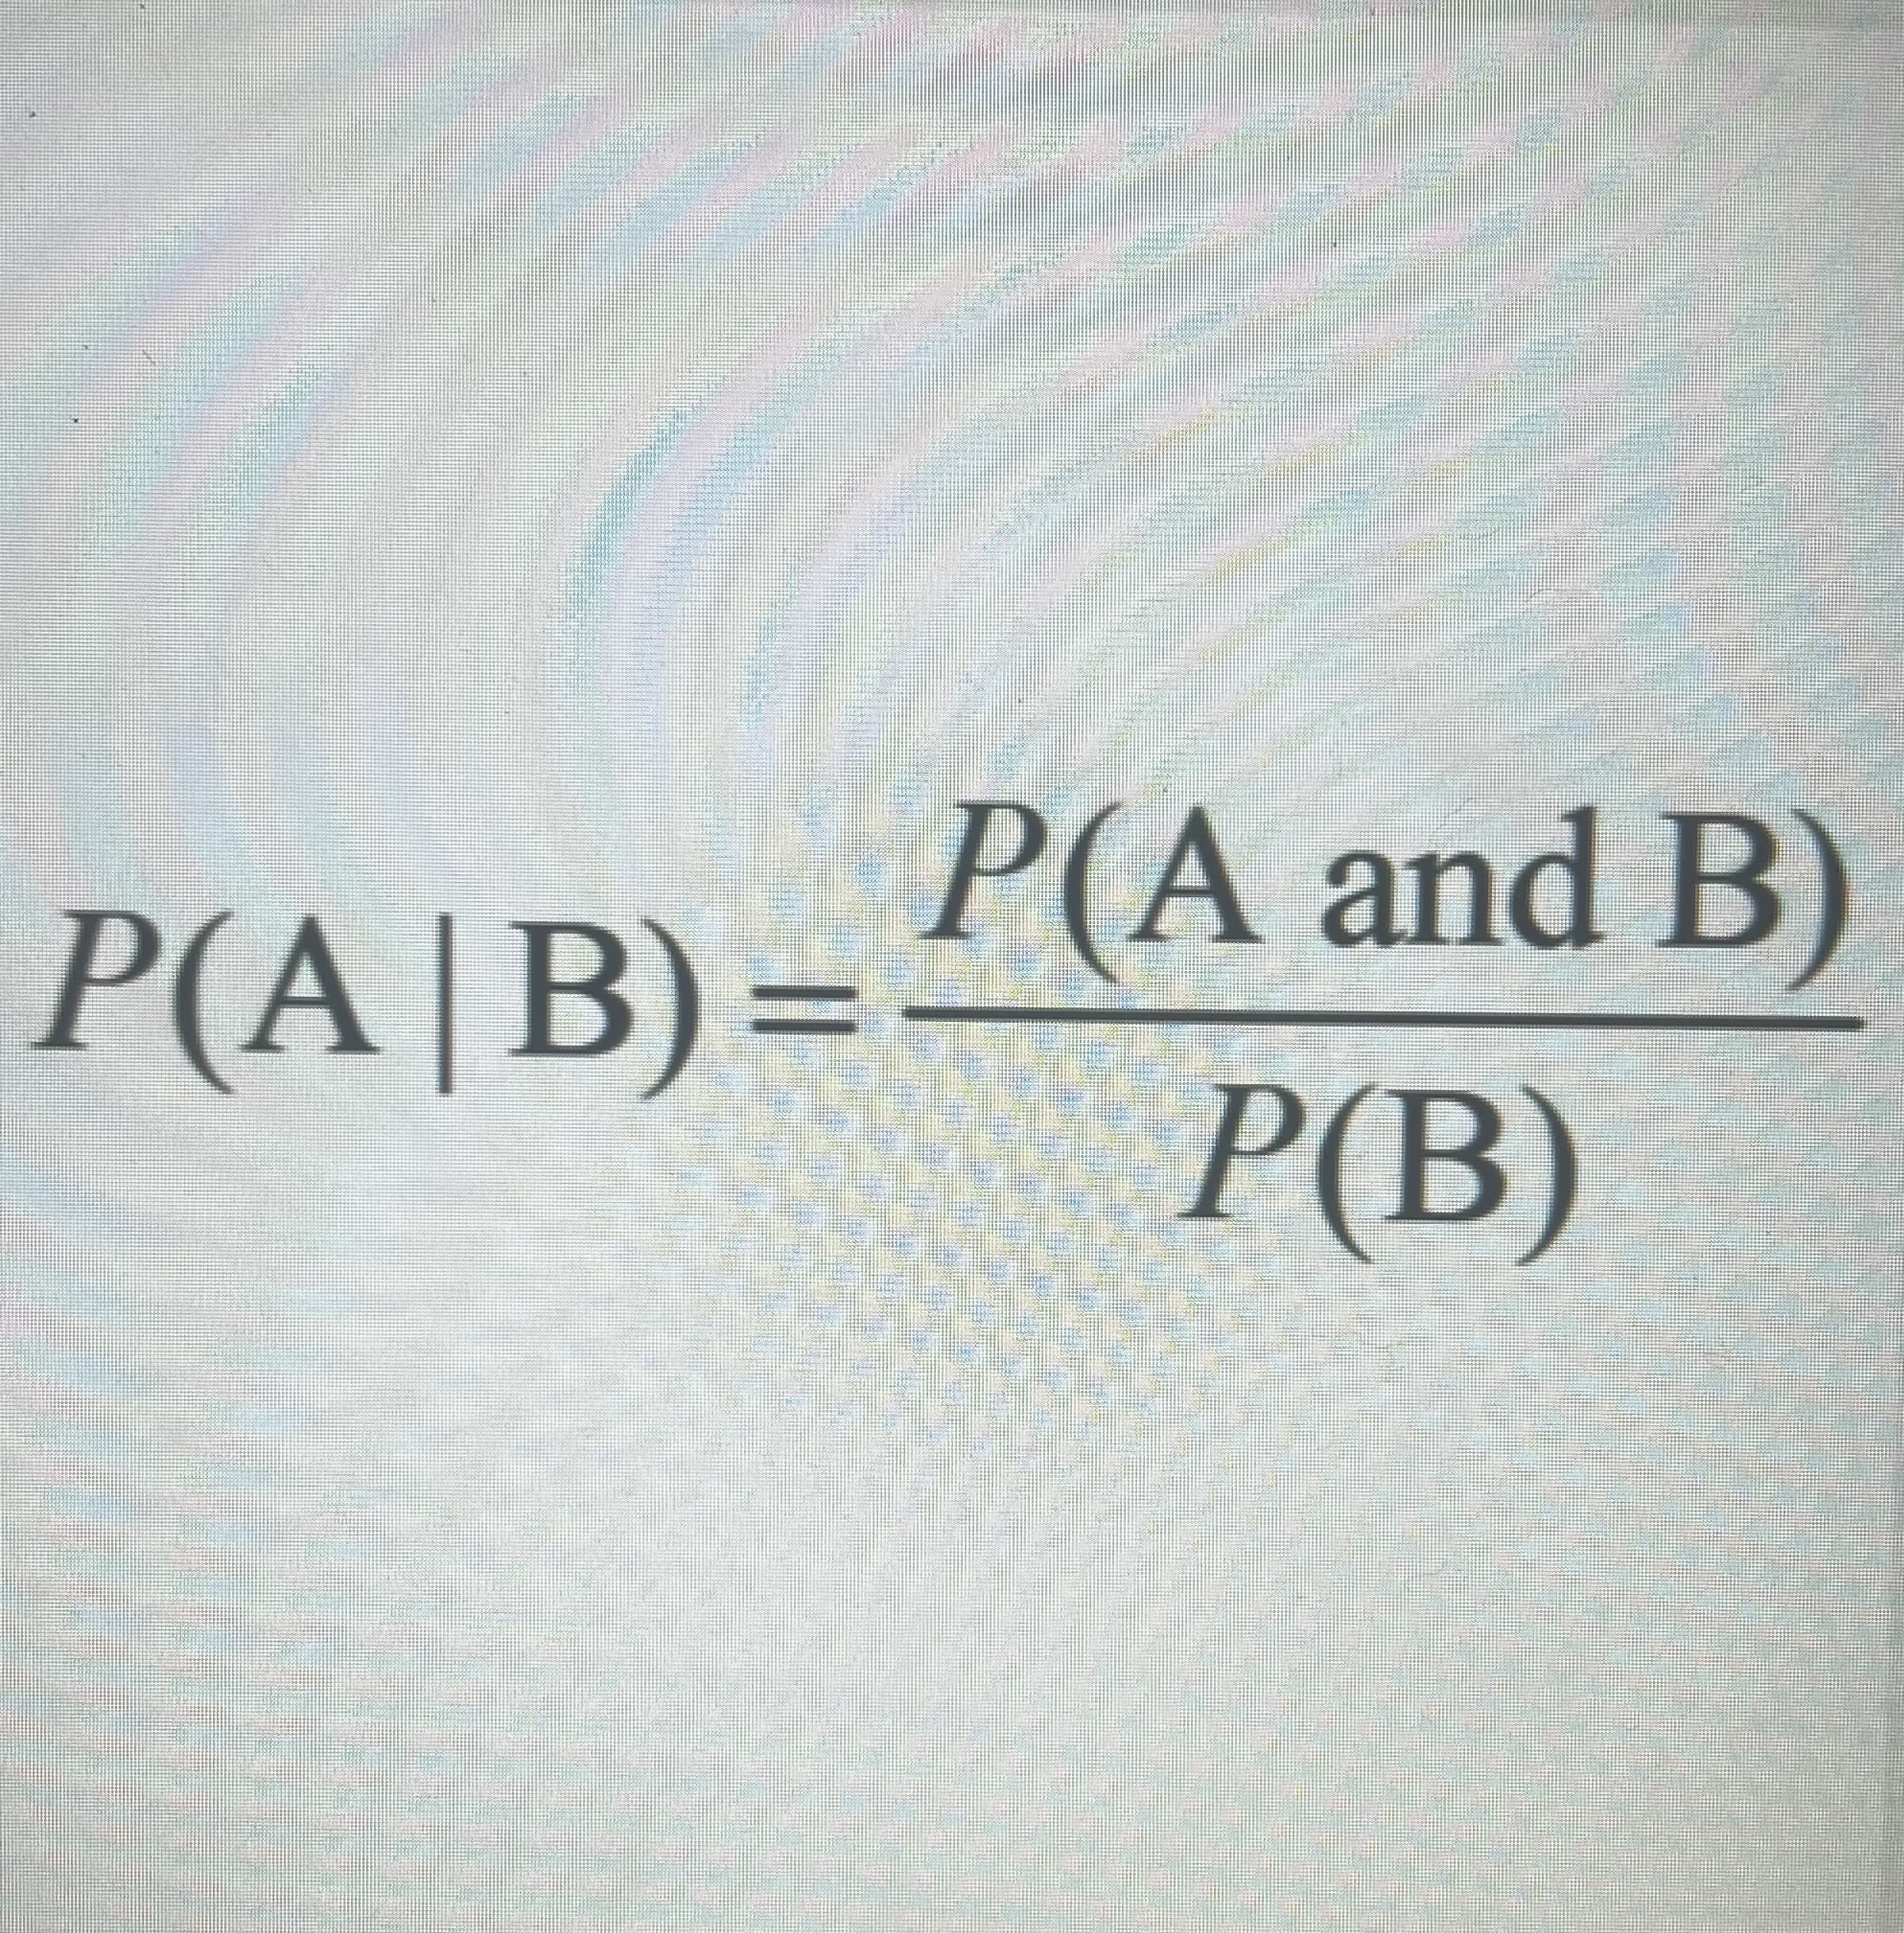
How do you calculate a conditional probability?
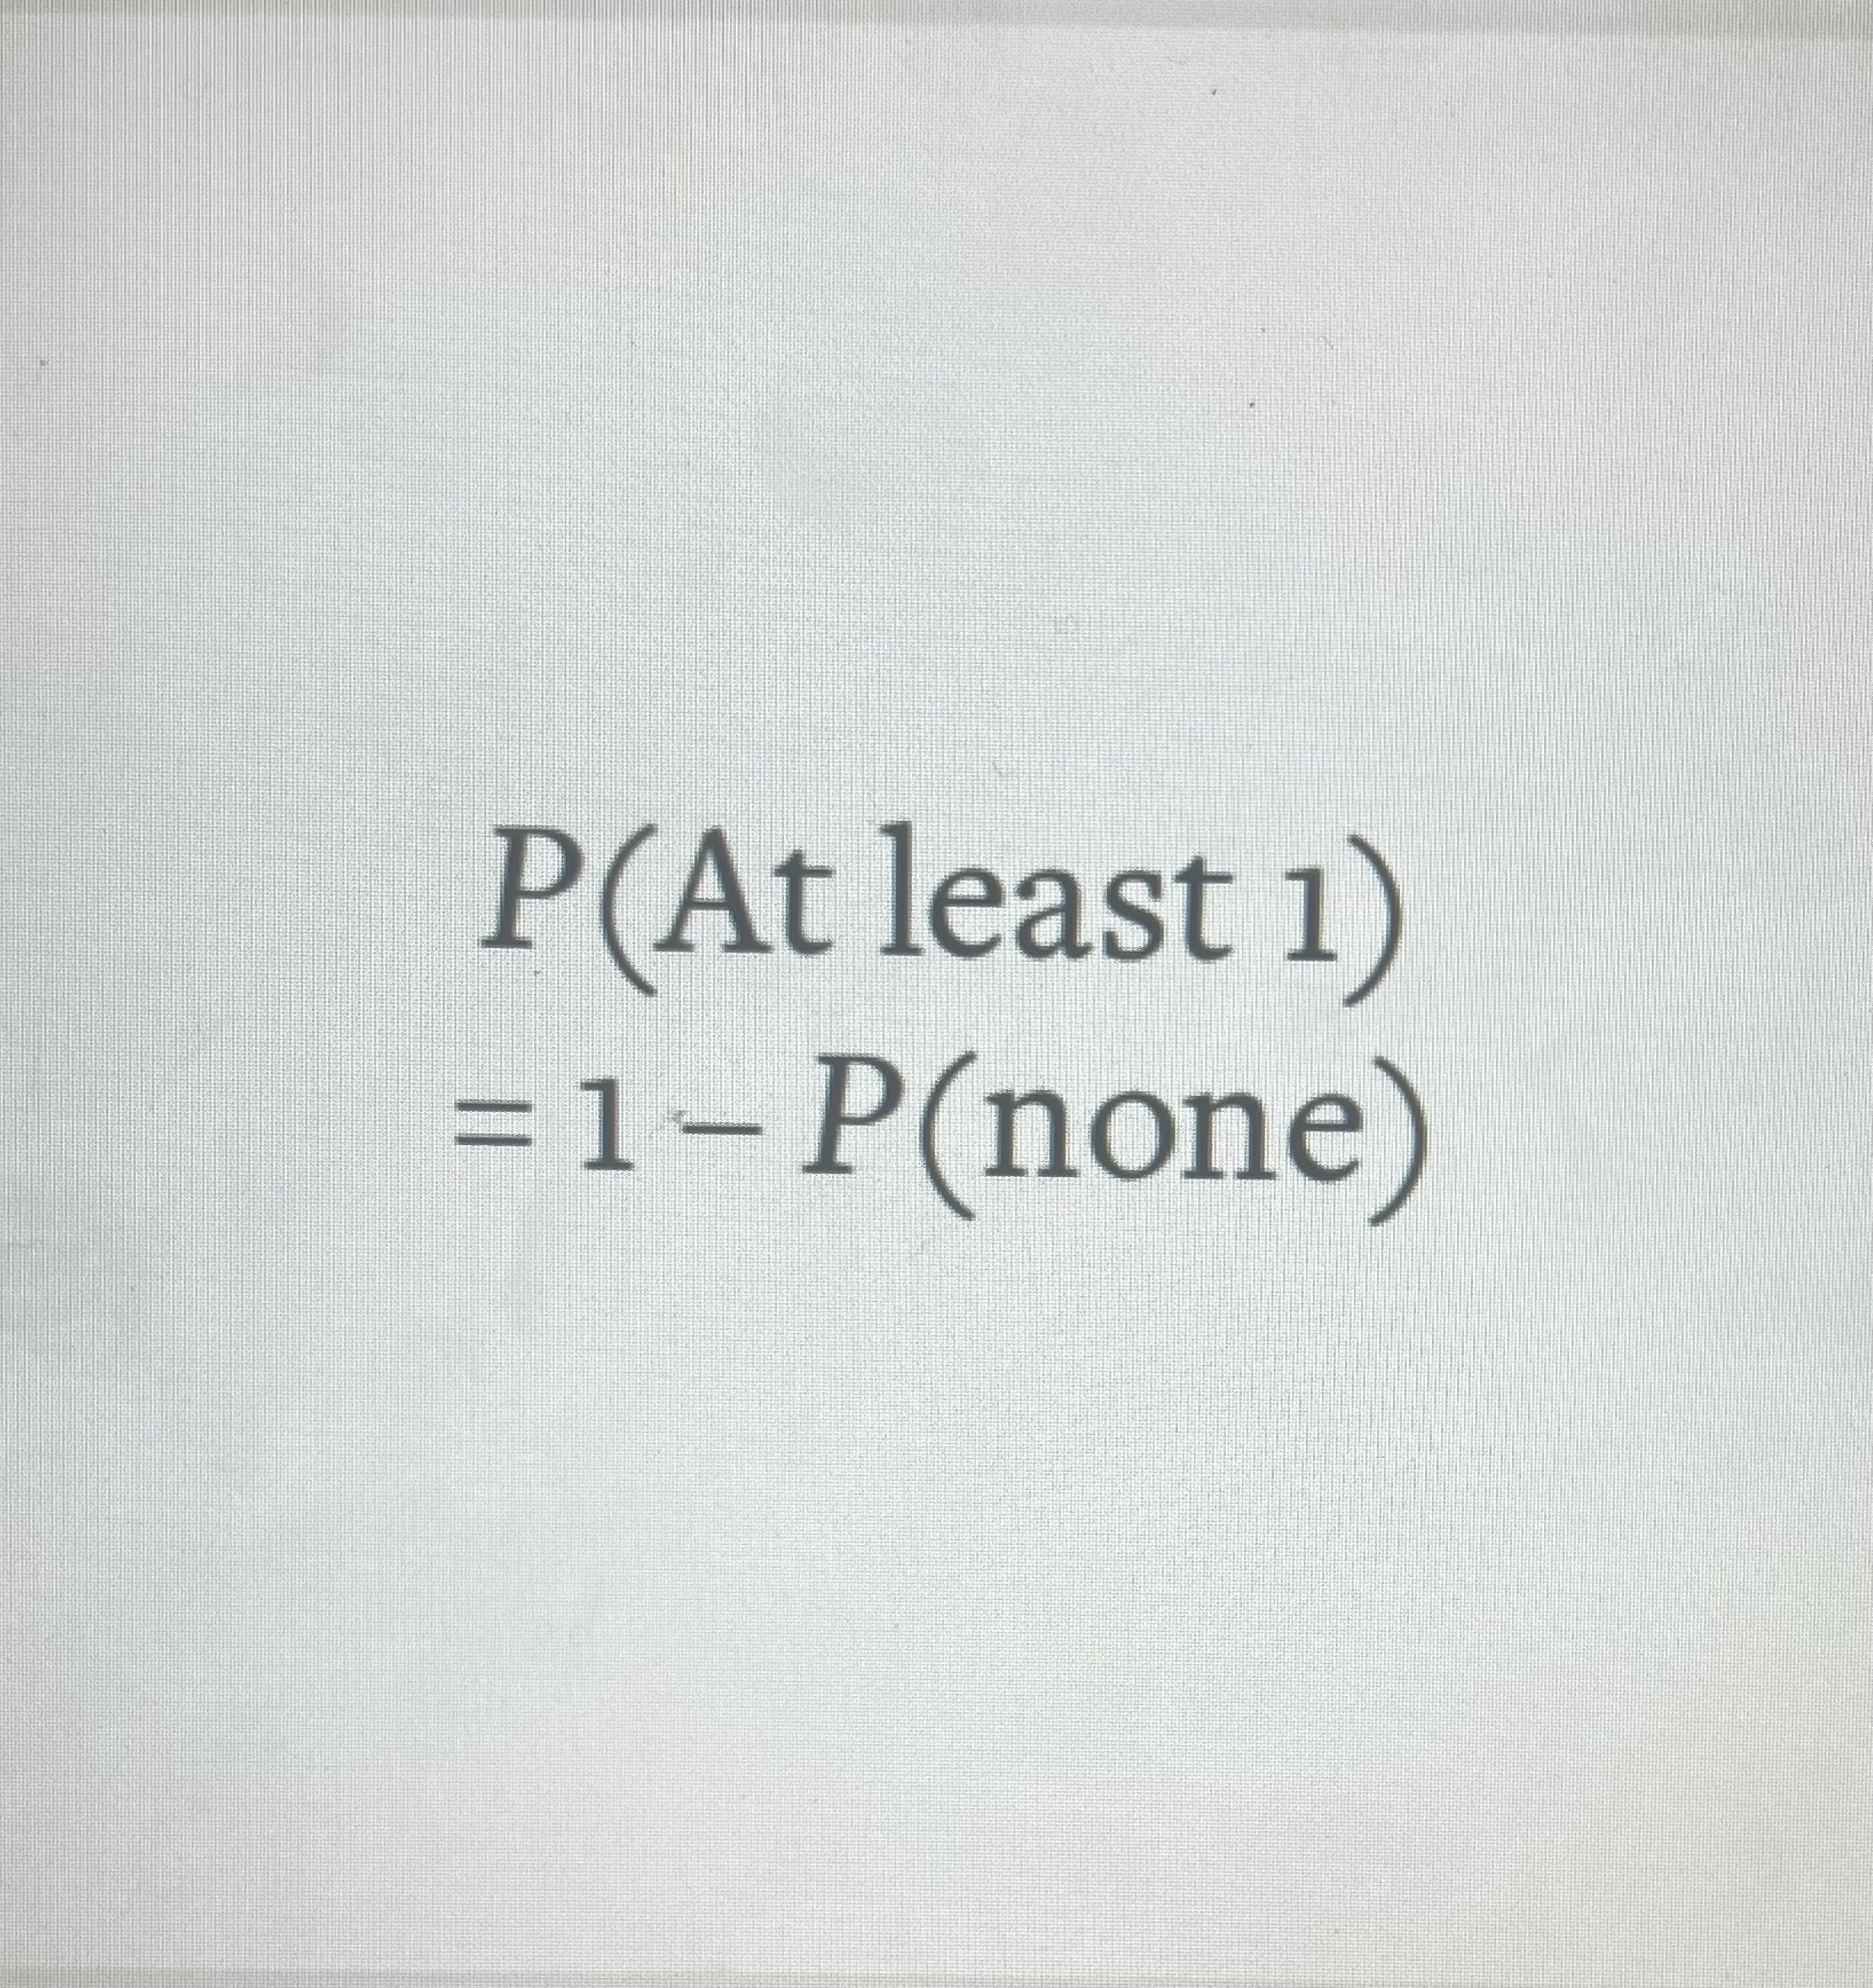
How do I evaluate the probability of “at least 1?”
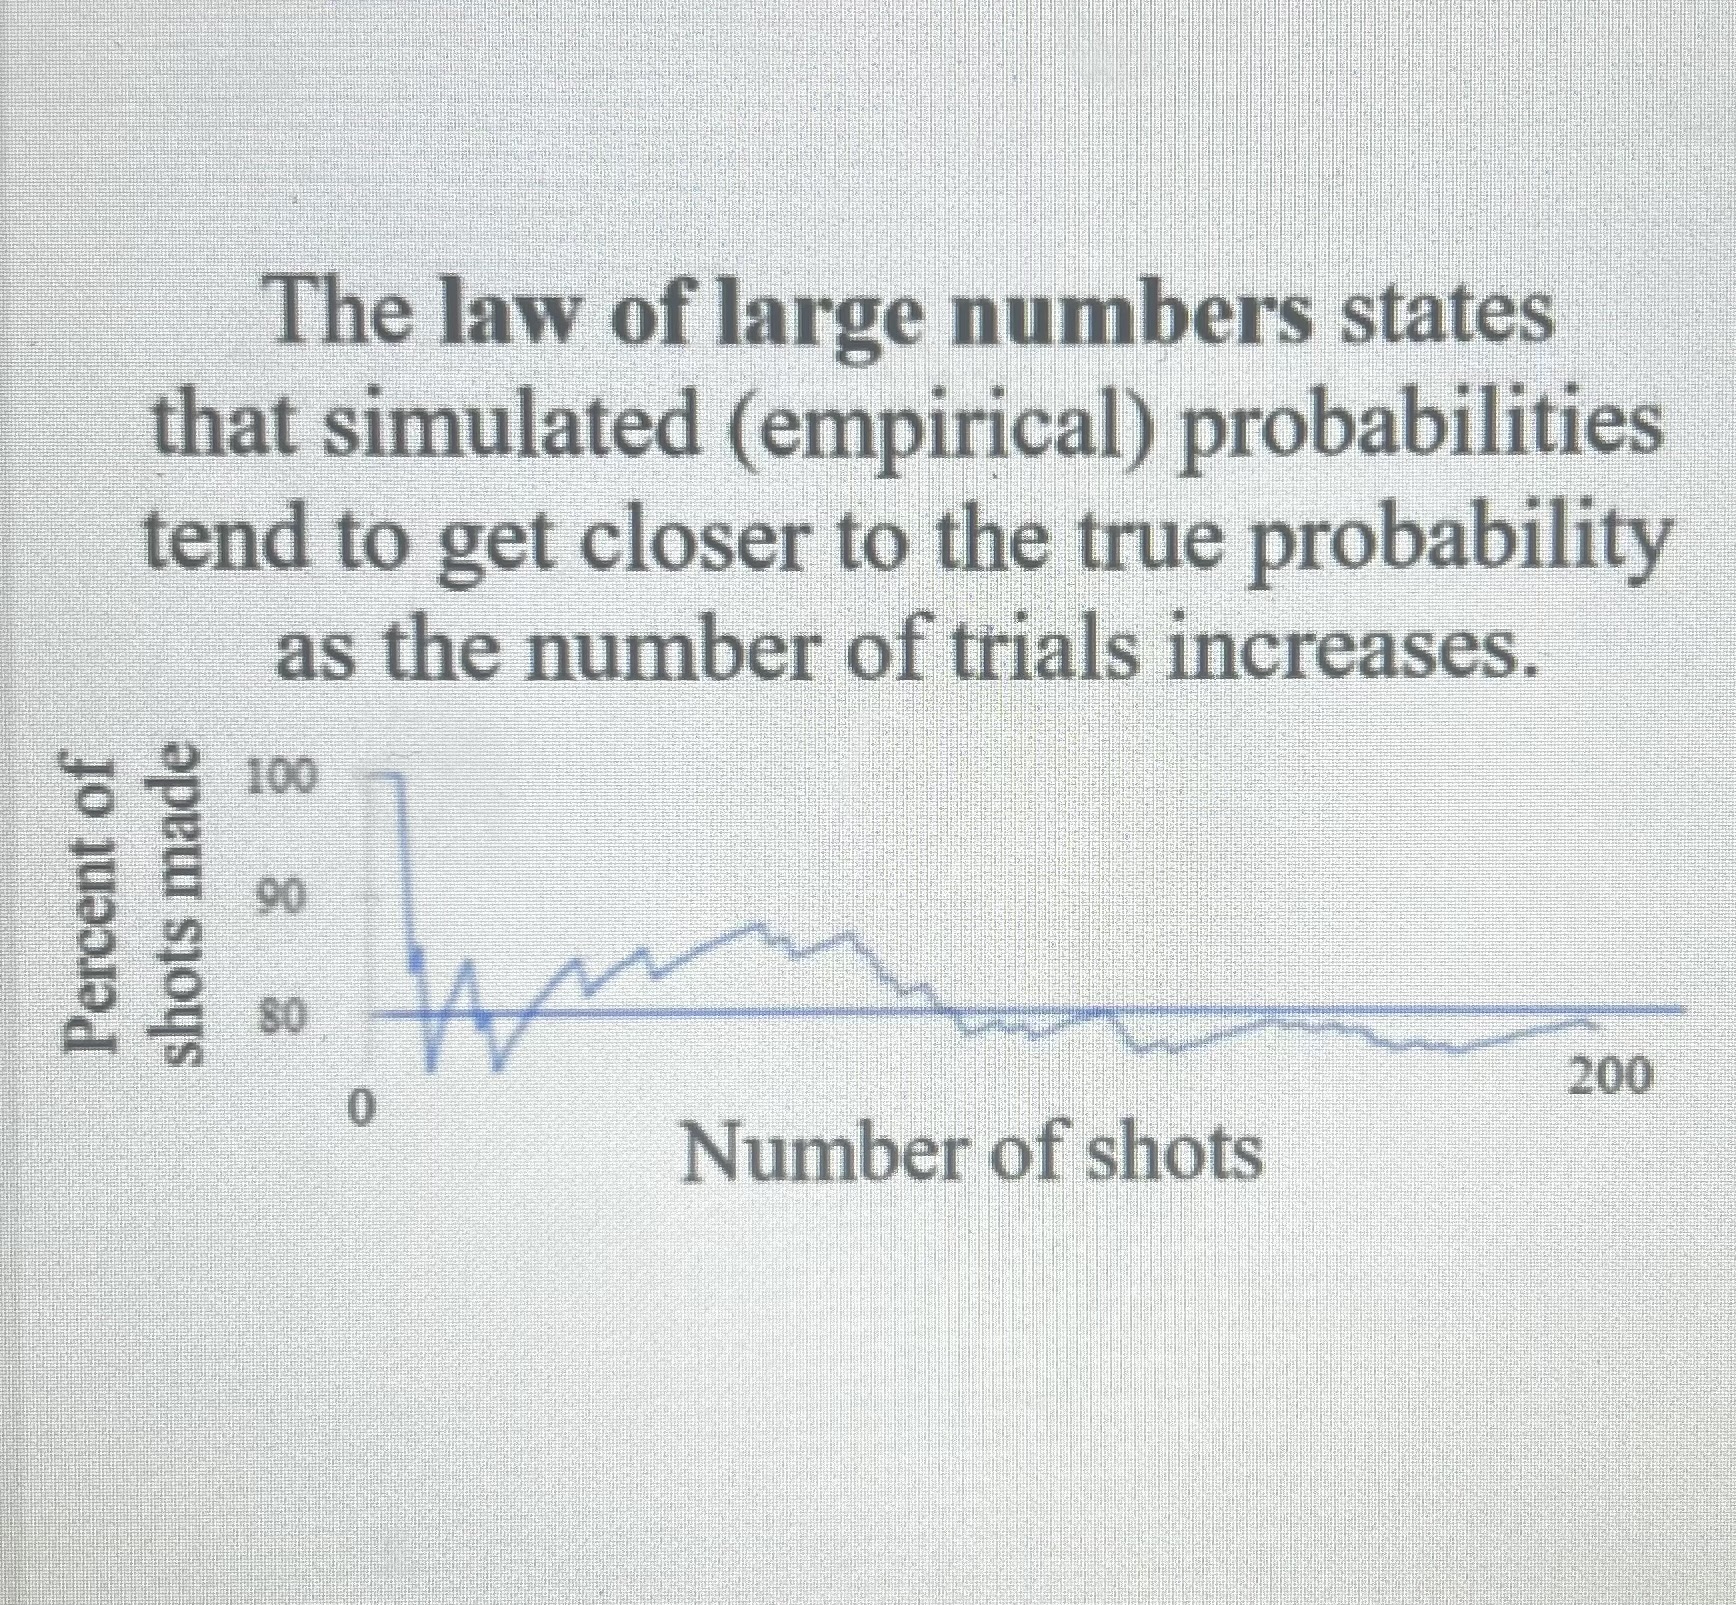
What is the Law of Large numbers?
What are the conditions for a geometric random variable?
BITS
Binary:two outcomes for each trial (success or failure)
Independent: each trial is independent of the next
Trails UNTIL a success (not a fixed number)
Same probability of success for each trial (p)
keep going until a success
Type I error
null hypothesis (Ho) is true and is rejected (false positive)
Type II error
alt hypothesis (Ha) is true and the null hypothesis is not rejected (false negative)
Power
the probability that a test will correctly reject the null hypothesis, given that the alt hypothesis is true.
P(Type II error)=1-P(power)
Conditions for a binomial random variable
BINS
Binary: two outcomes for each trial (success or failure)
Independent: Each trial is independent of the next
Number of trials is a fixed number (n)
Same probability of success for each trial (p)
Fixed number of trials
What is the difference between a parameter and a statistic?
a parameter is a number that describes the population. Ex- mew, p, standard deviation
a statistic is a number that describes the sample. Ex- x bar, p hat, s
Central Limit Theorem
when the sample size is sufficiently large, a sampling distribution of the mean of a random variable will be approximately normally distributed.
What is the difference between the population distribution, the sample distribution, and the sampling distribution?
the population distribution is the distribution of responses for every indian of the population.
the sample distribution is the distribution of responses for a single sample.
the sampling distribution is the distribution of values for the statistic for all possible samples of a given size from a given population
What decision do i make based on the p-value?
p-value < alpha, reject, there is convincing evidence
p-value > alpha, fail to reject, there is not convincing evidence
How do you calculate expected counts in a chi-square text for homogeneity/indp?