Module 7: Hypothesis Testing with One Sample
1/15
There's no tags or description
Looks like no tags are added yet.
Name | Mastery | Learn | Test | Matching | Spaced | Call with Kai | Chat |
|---|
No analytics yet
Send a link to your students to track their progress
16 Terms
Null Hypothesis
default assumption - no change, no difference, no effect - basically the opposite of what you want

Alternate Hypothesis
What you want - the desired outcome/expectation
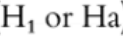
3 Forms of Alternative Hypothesis
Right tailed: mean(expectation) is higher/greater
Left tailed: mean(expectation) is lower/less than
Two tailed: mean(expectation) is different/not equal to
What does failing to reject the null value ACTUALLY mean?
Failing the null doesn’t mean its true; we just don’t have enough evidence to prove the null hypothesis is false
P-value
the probability (after finding a test statistic: z-score or t-score)
p-vakue and null hypothesis: reject or not criterias
If P value is large, we fail to reject the null hypothesis
If P value is small (smaller than 0.05), we reject the null hypothesis
Type 1 Error
“False Positive: Reject null hypothesis when it is in fact, TRUE
Type 2 Error
“False Negative: Fail to reject null hypothesis when null hypothesis is actually FALSE
Significance Level
the maximum probability of making a Type 1 Error that we’re willing to accept

What does lowering the significance level do but unadvertantly cause?
lowering alpha (significance level, prob of making type 1 error) lowers chance of getting a Type 1 error but increases the chance of getting a Type 2 error instead
efffects of increasing and diecreasing alpha (Significance level) in terms of null hypothesis
if increasing value of alpha, easier to reject null hypothesis
if decreasing value of alpha, harder to reject null hypothesis
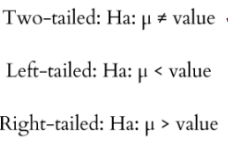
One Sample Z-test Conditions and Process
Conditions: The population SD is known, sample size is greater than or equal to 30
Step 1: State the Hypothesis
Step 2: Choose the significance level (usually given)
Step 3: Perform the z test formula (as shown)
Step 4: Find the p-value
Step 5: Making a decision, interpret results: If p less than or equal to alpha, reject null. If p is greater than alpha, fail to reject null
The larger the z score, the…
More evidence it has to reject null hypothesis
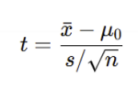
One Sample T-Test Conditions and Process
Conditions: Use when population SD is unknown or is random, normal distributed
Step 1: Generate/state null hypothesis and alternate hypothesis
Step 2: Find/identify significance level
Step 3: Use T formula for finding t value
Step 4: Find the p value; ensure to use df = n-1
Step 5: Compare result with the significance level
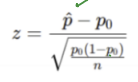
One Proportion Test: Conditions and Steps to use it
Conditions: Variables are categorical (yes/no, success/failure), TESTING A CLAIM ABOUT A POPULATION PROPORTION
Step 1: Generate/State null hypothesis and alternate hypothesis
Step 2: CHECK CONDITIONS BEFORE z test statistic and p value: sample is random, observations are independent, n x proportion AND n x (other than the proportion:q) are greater than or equal to 10
Step 3: Find z value using normal z formula
Step 4: Find p value
Step 5: Conclude Results and Refer to Question