PNB 3XE3 Midterm 2
1/47
There's no tags or description
Looks like no tags are added yet.
Name | Mastery | Learn | Test | Matching | Spaced |
|---|
No study sessions yet.
48 Terms
Family-wise error rate (FWER)
The probability of making at least one Type I error (false positive) across a family of related statistical tests
When alpha = .05, each test has a 5% chance of being wrong
If we run several tests, the chance of error accumulates
ANOVA
Analysis of variance
We use it when there are more than two levels
What types of variance does an ANOVA consider?
Total variability between individuals
Variability between groups
Variability within groups
Total variability between individuals
Regardless of group membership, each data point is measured relative to the grand mean
Between groups variance
How similar is each group mean to the grand mean?
If all the groups came from the same population then they should all have similar group means
Variation due to the independent variable
Within group variance
How similar/messy are the scores within each group?
This is the random variability we cannot account for (“residual variance”, “error variance”, “random error”)
What does an ANOVA do?
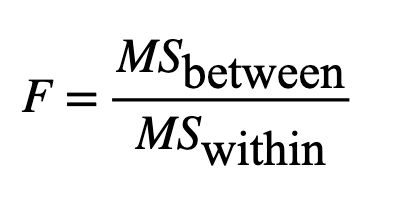
An ANOVA compares the BETWEEN group variability to the WITHIN group variability
How is an ANOVA similar to a t-test? How is an ANOVA different from a t-test?
Both tests measure a ratio of the difference between means (variability between groups) over the amount of variability within each group
A t-test compares the means of two groups, whereas an ANOVA compares the means of three or more groups (or conditions)
One-way ANOVA
Determines whether there are significant differences among the means of three or more independent groups that differ along one factor (IV)
One-way ANOVA hypotheses
Null hypothesis: all group means are equal
Alternative hypothesis: at least one group differs from the others
What does it mean that ANOVA is an omnibus test?
It doesn’t test specific pairwise differences
F-statistic
F-test steps
Compute the F-statistic
Determine the F critical value Fα, (dfbetween, dfwithin)
Based on the chosen significance level (α) and TWO degrees of freedom (dfbetween and dfwithin)
Compare
If Fobs > Fα, (dfbetween, dfwithin), reject H0
F distribution
A probability distribution of a ratio of two variances, each scaled by their own degrees of freedom
Partition of variance
ANOVA partitions (splits) the total variability in the data into different sources, explaining where the variation comes from
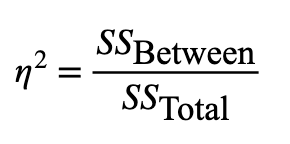
Eta squared (η2)
Effect size in ANOVA
The proportion of total variance explained by the factor/group
Ranges from 0 to 1
Why don’t we run pairwise t-tests between all group means when there are more than 2 groups?
Each t-test has its own chance (e.g. 5%) of a Type I error (false positive)
If we run many t-tests, these error accumulate, leading to the overall (family-wise) error rate much higher than (5%)
Post-hoc (after the fact) corrections
Any statistical adjustment made after running multiple tests to control the overall chance of false positives (e.g. family-wise error rate)
Bonferroni correction
Divides α by the number of tests (α/m)
Holm correction (sequential Bonferonni)
Sequentially adjusts p-values (step-down)
Tukey HSD (Honest Significant Difference)
Adjusts CIs/p-values for all pairwise mean comparisons in ANOVA
Benjamin-Hochberg (FDR)
Controls expected proportion of false discoveries
What are the three assumptions of ANOVA?
Independence of observations
Normality
Homogeneity of variances, tested with Levene’s test
T-test
Determines whether there is a difference between the means of two groups or between a group mean and a theoretical value
Factorial (or ‘two-way’) ANOVA
A statistical model that examines how two or more independent variables (factors) jointly influence a dependent variable

Factorial ANOVA pros
Tests multiple factors together
Controls Type I error across multiple factors
Can reduce residual variance
Detects interactions: richer theoretical insight
Factorial ANOVA cons
More complex interpretation, especially with interactions
Requires balanced or larger samples for stable estimates
Higher risk of violations of orthogonality or unequal n complicate results
Added complexity may be unnecessary when only one factor is theoretically relevant
Factor
An independent variable that is manipulated or observed to examine its effect on the dependent variable (e.g. Face Ethnicity, Speech Type)
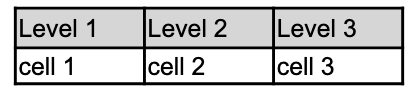
Level
A specific category or value within a factor (e.g. Asian, Caucasian, African)
Cell (or condition)
A unique combination of levels across all factors - each represent one experimental condition (e.g. Asian & Native)
Main effect
The overall effect of one factor on the dependent variable, averaging across all levels of the other factor(s)
Simple effect
The effect of one factor at a specific level of another factor (e.g. difference among ethnicities when speech is native)
Interaction effect
When the effect of one factor depends on the level of another factor (e.g. the ethnicity effect changes depending on whether speech is native or non-native)
What are the two features of a factor (IV)
Categorical - each factor consists of discrete levels (e.g. male vs. female)
Orthogonal (ideally) - factors are designed to be independent
What are the features of a dependent variable?
Continuous - must be quantitative, allowing computation of means and variances (e.g. reaction time)
Normally distributed within groups - scores within each cell should roughly follow a normal distribution
Margin means
The means for one factor averaging over (collapsing across) the levels of other factors
Expected cell mean
The model’s expected cell outcome for a group (assumes there are no interactions)
Partial eta squared ηp2
Effect size in factorial ANOVA
The proportion of variance explained by a given effect relative only to the variance it competes with (i.e. that effect + its residual error)
Ranges from 0 to 1
Repeated measures (rm) ANOVA
Extension of the paired-sample t-test
A statistical model used to test whether mean differences exist across multiple measurements taken from the same participants (or experimental units) under different conditions or at different times
Removes stable individual differences from the error term, improving sensitivity to detect within-subject effects
One-way ANOVA model
SStotal = SSbetween + SSwithin(error)
Factorial ANOVA model
SSerror = SSA + SSB + SSAxB + SSwithin(error)
Repeated measures ANOVA model
SStotal = SSbetween + SSparticipants + SSerror(within)
sphericity assumption
In rmANOVA, the variances of the differences between all pairs of within-subject conditions are equal
Var(A - B) = Var(A - C) = Var(B - C)
We can test this using Mauchly’s test for sphericity
What happens if sphericity is violated?
The F-statistic will be too liberal, thus the Type I error rate increases
To fix this, a correction to the degrees of freedom (e.g. Greenhouse-Geisser or Huyn-Feldt) can be applied
simple effect analysis
We use it after finding a significant interaction in a factorial ANOVA to identify where the interaction lies
deviation from the expected cell mean
Tells us how much the observed score differs from what we would expect if there were no effects (main effects or interactions)
How surprising/unexplained the score is
residual
The difference between an observed value and the value predicted by your model
Tells you how far off your model’s prediction was for a given value