Biostats Exam 1
1/171
There's no tags or description
Looks like no tags are added yet.
Name | Mastery | Learn | Test | Matching | Spaced |
|---|
No study sessions yet.
172 Terms
Population
the entire set of individuals, animals, objects or events that can be uniquely defined by a characteristic or set of characteristics
too large to measure or observe each member of the population
what are examples of a population?
1. All US males between 45-65 years of age
2. All deer in the state of Virginia
3. All shipwrecks on the bottom of the Atlantic Ocean
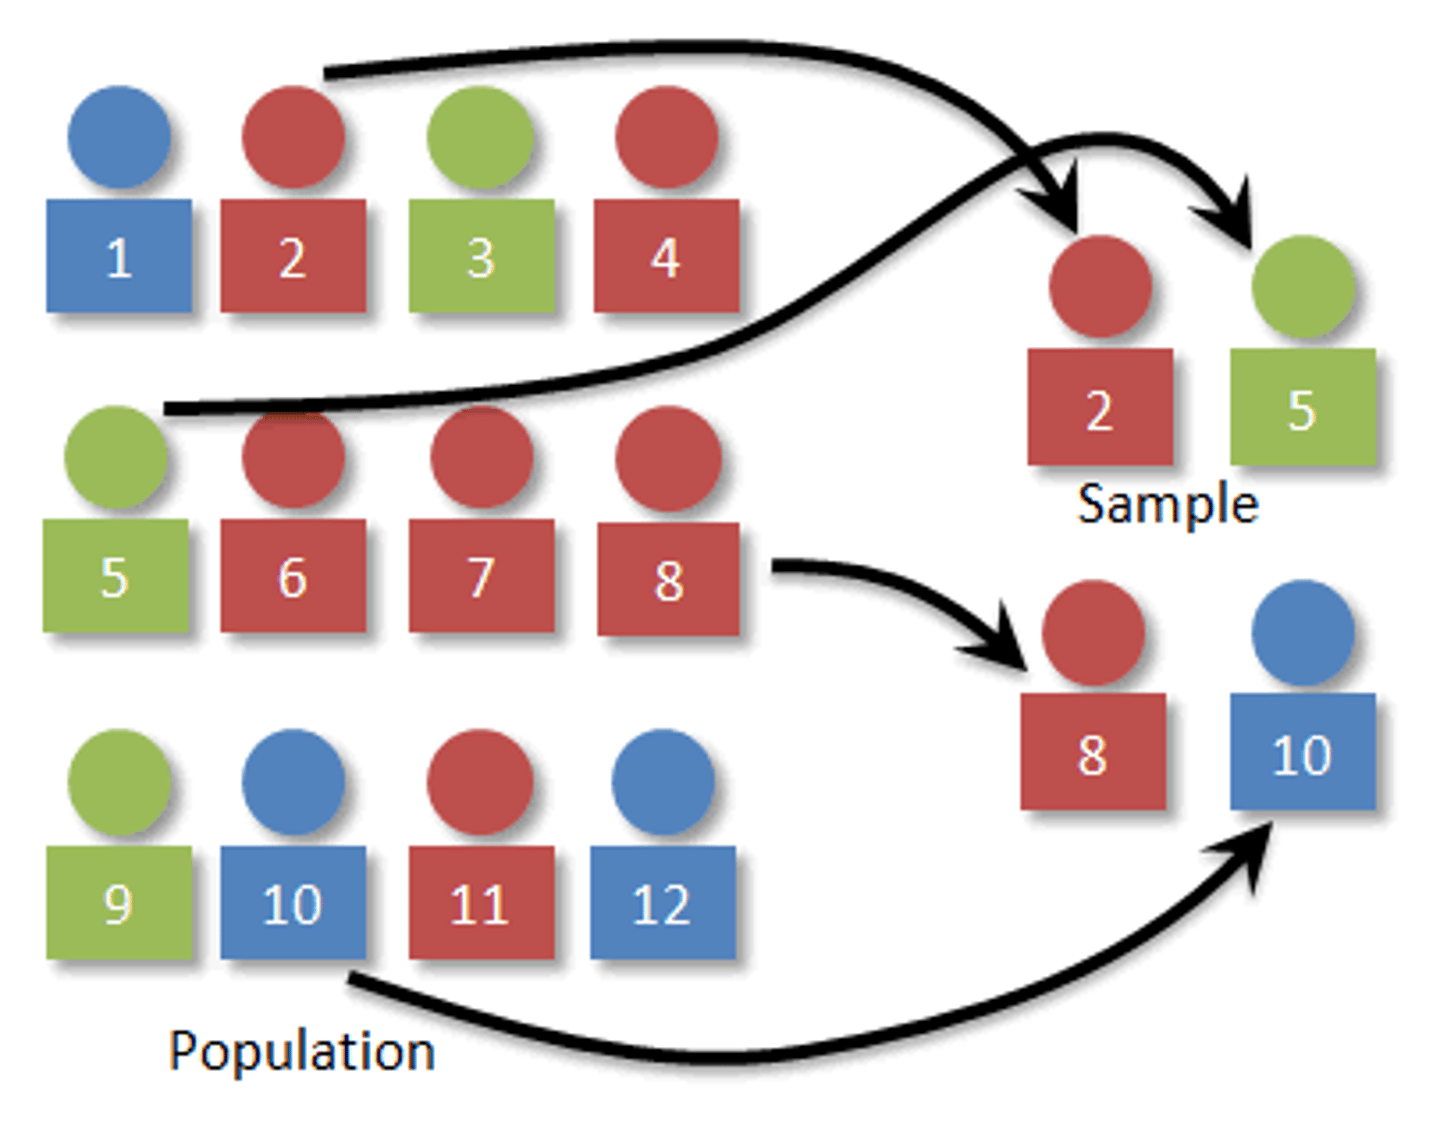
what is a sample?
subset of the population of interest
What makes a sample a good representation of the population?
if it is random (every member of the population has equal chance of being observed
What are examples of samples?
1. A sample of 1000 US males between. 45-65 years old
2. A sample of 100 deer caught and released int he state of VA
What are population parameters?
specific characteristics of the population
What is a statistic?
an estimator of a population characteristics/ parameter based upon the values observed in the sample
What are examples of statistics?
1. Average weight of 100 US males between 45-65 years old
2. Proportion of 50 deer caught in the state of VA with a wasting disease
What are convenience samplings?
-non random sampling approach
-involved using respondents who are "convenient" to the researcher or easily accessed
-subjects recruited mainly by location or membership
Why might convenient sampling not be useful?
extremely high chance of producing a biased statistical results that are not generalizable (the sample does not represent the population of interest)
What is a simple random sample?
-every member of the population is given an equal chance of being selected
-sampling frame creates then randomly, a subset of individuals are selected to be in the sample
-once the person is selected, an attempt is made to gather their data
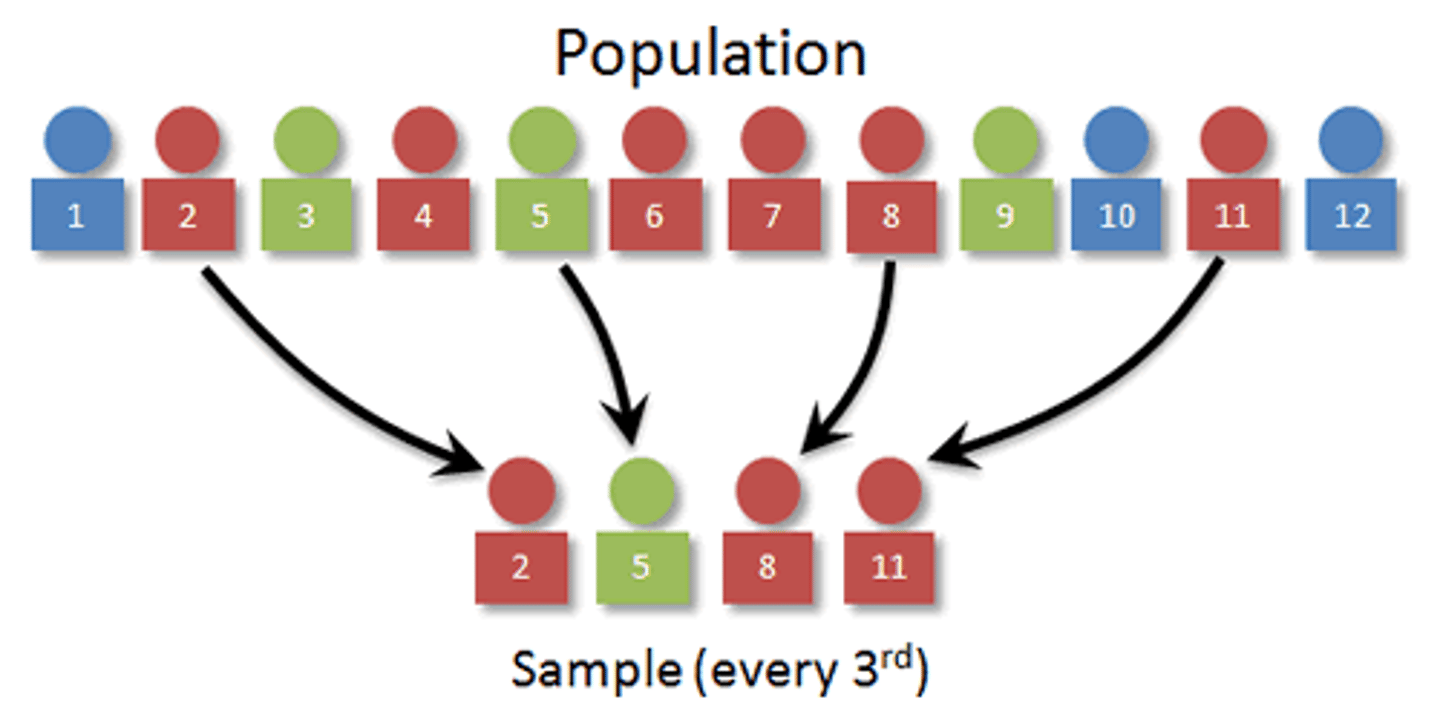
What is systemic random sampling?
randomly picks a place in the sampling frame to begin and systemically select subjects from there
What is stratified random sampling?
-the sampling frame is subdivided by groups and then random sampling occurs within groups
-suppose an organization has 20,000 employees, 90% female and 10% males
-sampling could be stratified by female and male to make certain the sample is 90% female and 10% male
What is random sampling considered?
gold standard, providing the best chance to produce unbiased statistics and results that generalize to the population of interest
what does a case control study compare?
Those with the disease or condition under the study (cases) and a very similar group of people who do not have the disease or condition (controls)
What is a case control study?
researchers examine the history of the subjects (socioeconomic, educational, occupations, medical history, lifestyles) to examine which factors may be associat4ed with the disease or condition
What are retrospective studies?
Case-control studies choose population samples after the fact based on presence or absence of disease. E.g. People with lung cancer vs without to identify risk factors. More practical for rare diseases.
What are cohort studies?
-a study approach that follows a set of research participants over a period of time, sometimes for decades
-recruit and follow one group of participants who share a common characteristic, such as a particular occupation or demographic similarity
-can be retrospective or prospective
What is a randomized clinical trial?
-study in which the participants are divided randomly (flip a coin) into groups
-each group will receive a different intervention or treatment
-using chance to assign individuals to treatment means that the groups will likely be balanced on demographics and other factors
what does randomization allow for?
fair, unbiased comparison of the treatments; at the time of the trial, it is unknown which treatment is best
What does the statistics calculated depend on?
depends on the nature of the data (level of measurement) you collect within your sample
what is nominal level?
-lowest level of measurement
-named for characteristics
-no natural order (concepts of greater than or less than do NOT apply)
What are examples of nominal levels?
-sex (female/male)
-eye color (blue, brown, hazel, other)
-blood type (O, A, B, AB)
-race
-nationality
What is ordinal level?
-second lowest on the levels of measurement
-categories or levels that can be ranked or ordered
-distance between the levels/ characteristics is not constant and has no meaning (subtraction is useless)
what are examples of ordinals?
-Grades (A-F)
-restaurant ratings (5 star)
-Pain rating 1 to 10
What is interval level (levels of measurement)?
-second highest level
-measurements that can be ordered and distance between measurements has meaning (subtraction is valid) but zero does NOT imply absence of the trait)
What is an example of interval levels of measurement?
celsius (amount of heat between 30˚ and 25˚ is equal to the amount of heat between 10˚ and 5˚ but 0˚C does not imply NO heat but implies that water freezes)
What is the ratio level?
-highest level up on the levels of measurement
-measurements that can ordered and distance between measurements has meaning (subtraction is valid) and zero does imply the absence of a trait
what is an example of ratio level?
temperature in Kelvin, the amount of heat between 30˚ and 25˚ is equal to the amount of heat between 10˚ and 5˚ and 0˚ K is NO heat
what is the most common statistic for nominal levels of measurements?
proportions
what is the most common statistic for ordinal levels of measurements?
proportions, but sometimes sample mean and variance are reported
what is the most common statistic for interval and ratio levels of measurements?
sample means and variacnes
What kind of chart/ graph is used for nominal or ordinal variables?
-a bar chart most appropriate
-other options: pie chart (each category receives a proportional size fo the pie)
-comparing heigths is easier than angles
What kind of chart/ graph is best to show the distribution of continuous variables?
box and whisker plots (sometimes just called box plots) or histograms
What kind of chart/ graph is best to show association between two continuous variables (such as interval or ratio variables)?
scatterplot with one variable as the x axis and the other as the y axis, and a point at the (x,y) to represent the data
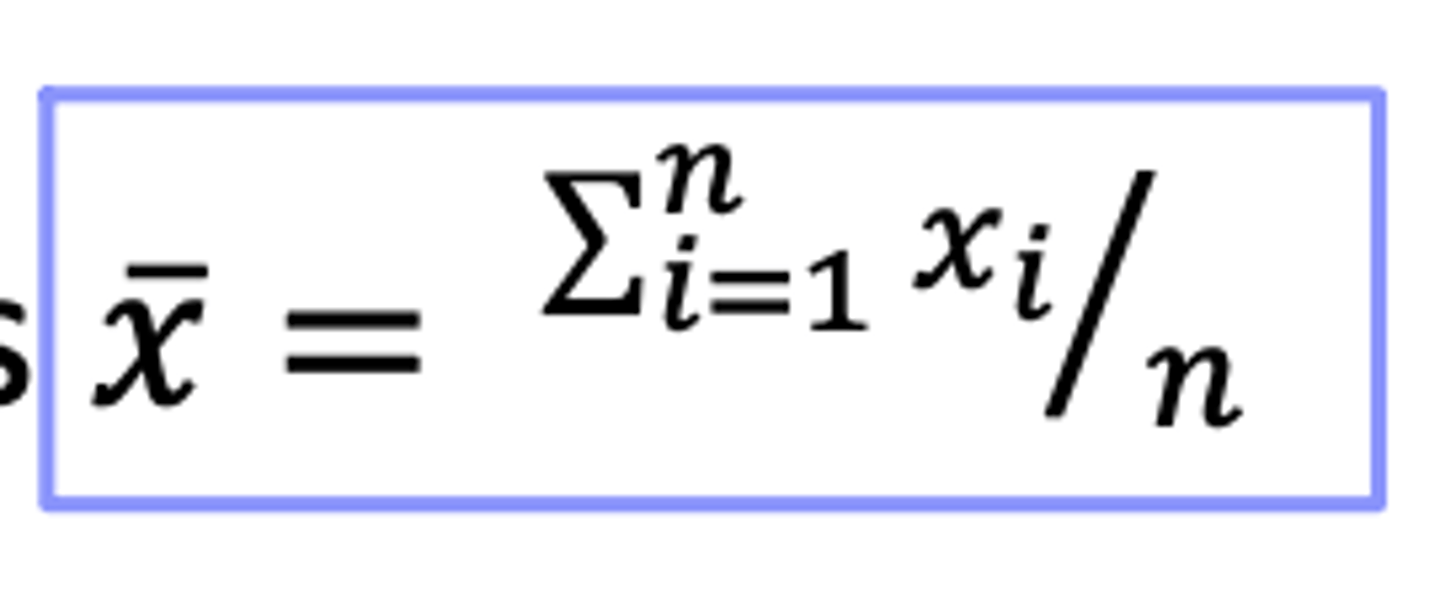
What is a sample mean?
a statistic that measures central tendency or central location; average of the data points
What is the formula for sample means?
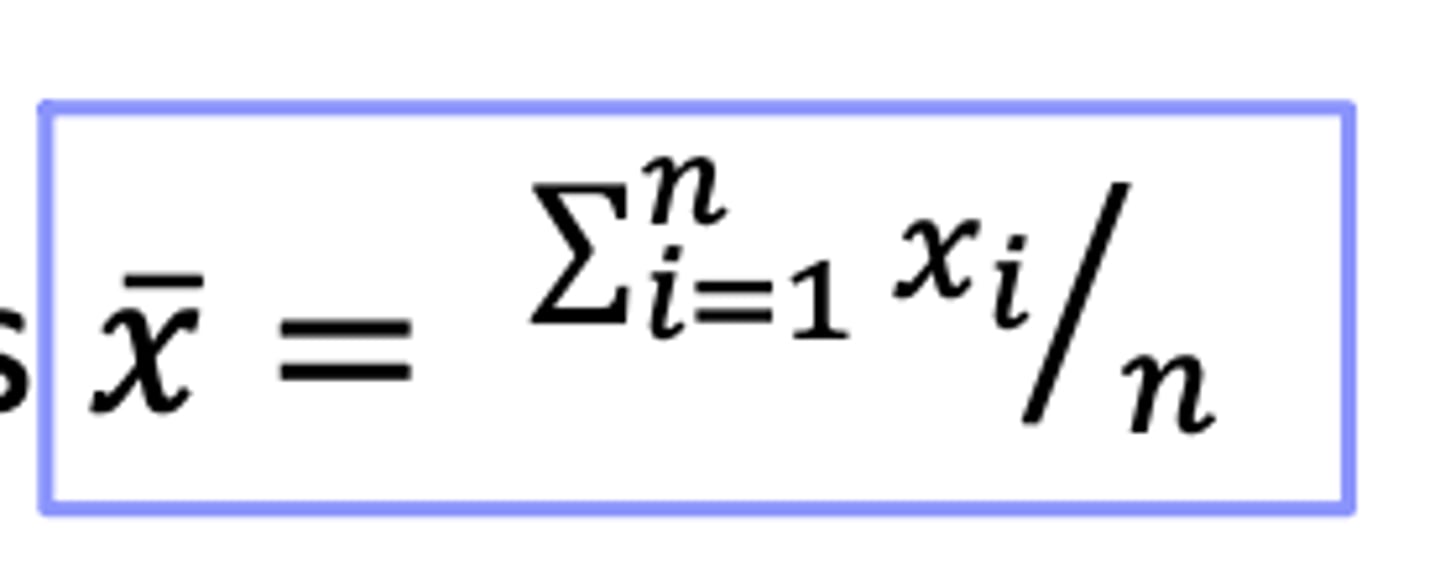
Imagine you have a ruler and you place an equal amount of weight at each datapoint. If you want to balance that ruler on your finger, where do you think the balance point is?
Data points: 73, 92, 105, 111, 120, 122, 127, 129, 131, 136, 138
111.92
What are we interested in in addition to the center of the data?
interested in the dispersion of the data, how 'spread out' the data is
what is sample variance?
-a common measure of dispersion of data/ how spread out the data is
-measures the averaged squared deviation of the data points from their sample mean
whaat is the formula for sample variance?
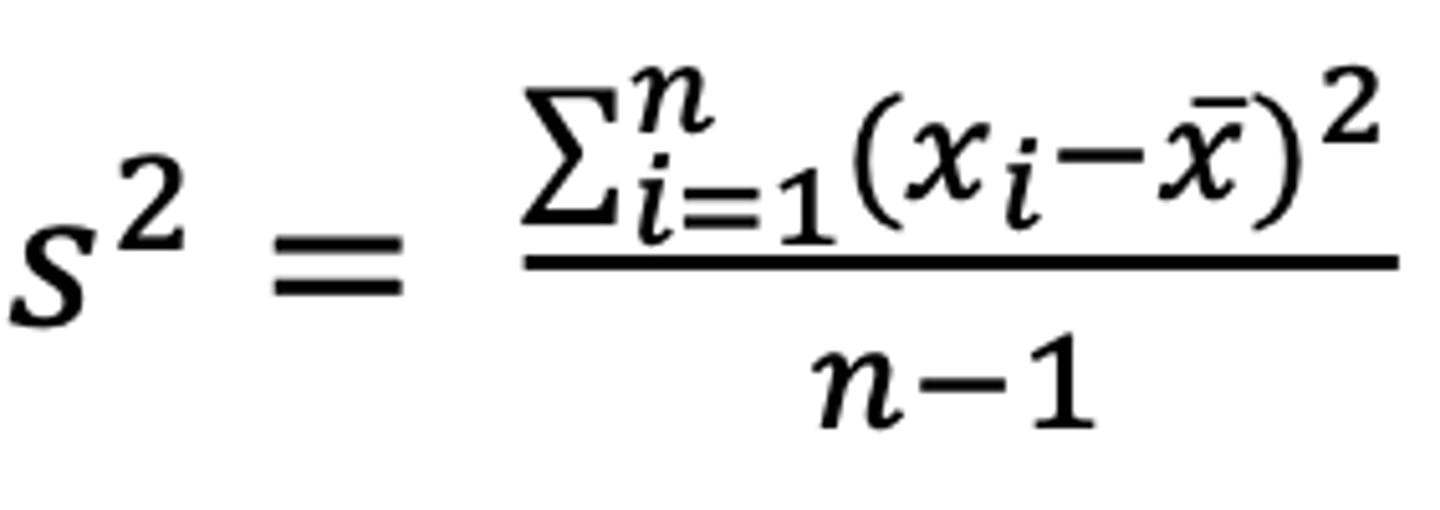
what are degrees of freedom?
number of unconstrained data points in variance calculations
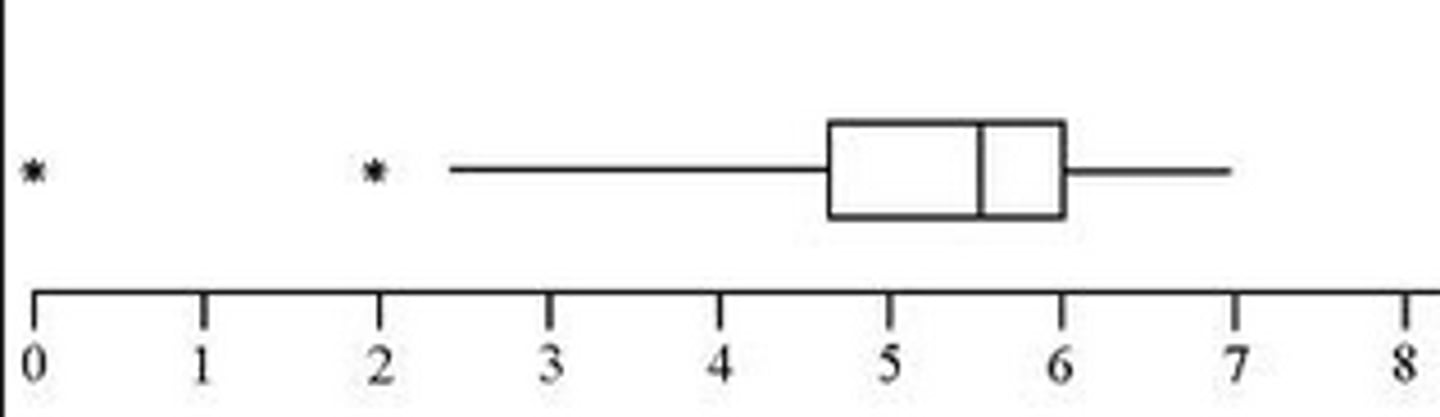
What are outliers?
unusual data points that fall far away (above or below) from the rest of the data
what is the p th percentile?
a value where p percent of the data fall at or below that value
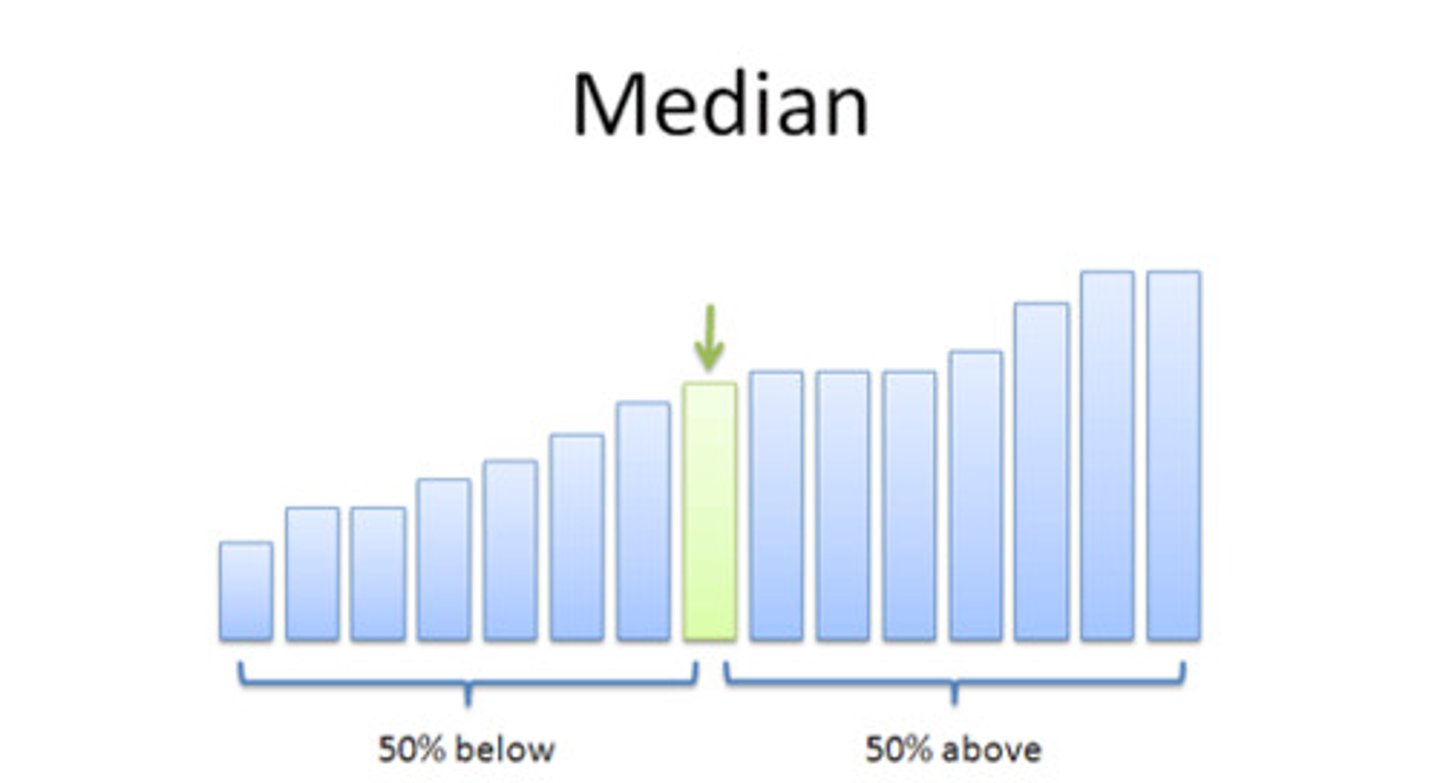
what is the median (50th percentile)?
-a value where 50% of the data fall at or below that values
-the position is (n+1)/2
what is the first quartile?
-25th percentile, 25% of the data falls at or below that value
-position: (n+1)/4
what is the third quartile?
-75th percentile, 75% of the data fall at or below that value
-position: 3(n+1)/4
what is the median?
a robust measure of center
What is interquartile rnage?
-Q3-Q1
-robust measure of spread/dispersion
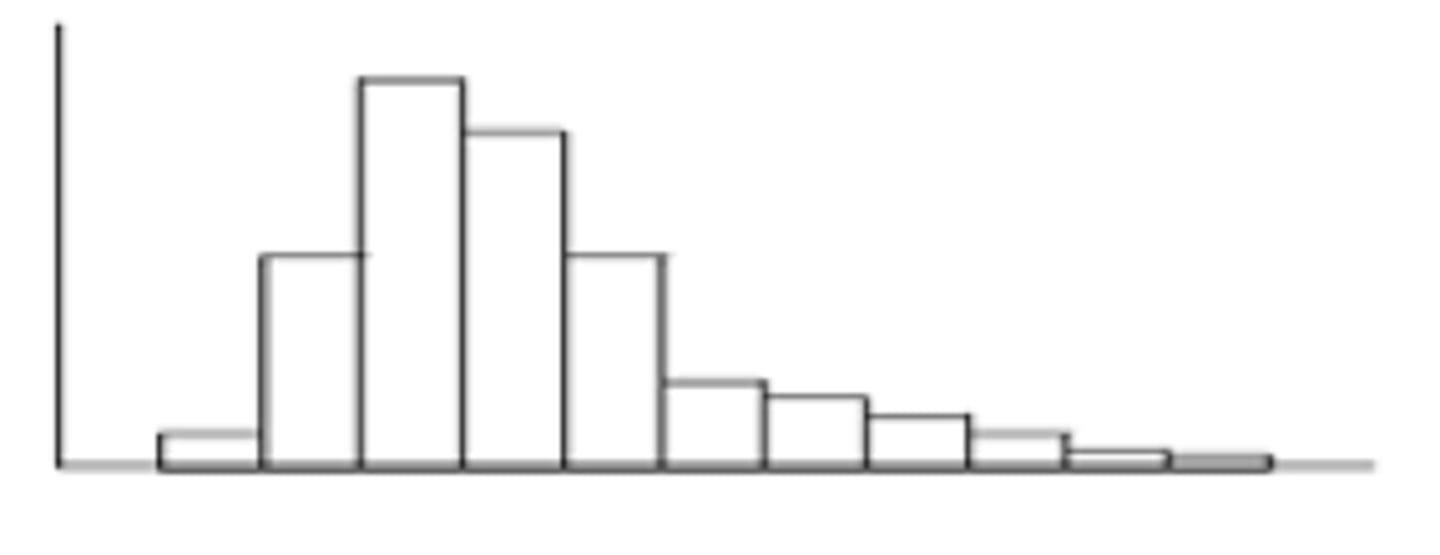
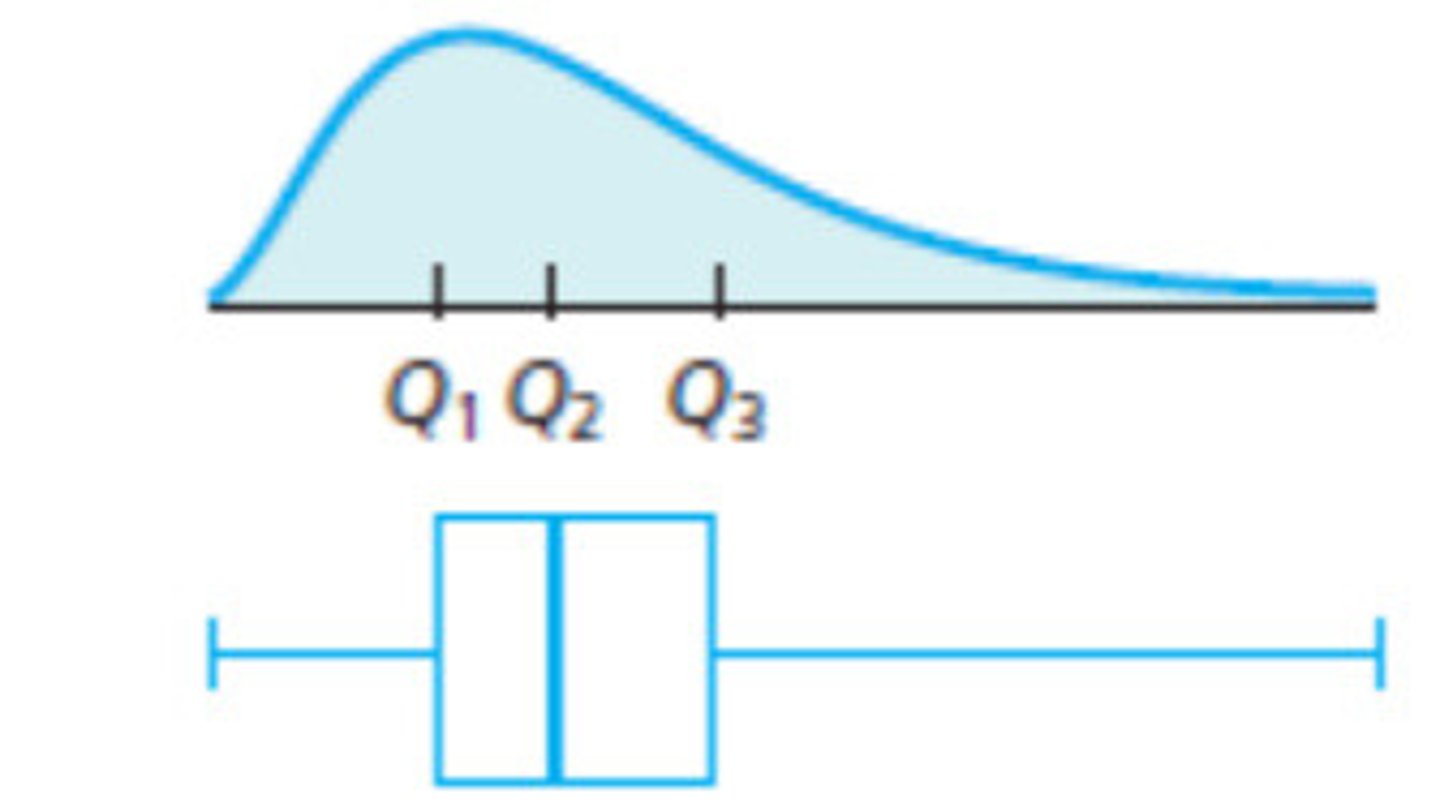
What is right skewed in histograms?
tail is towards the right, mean > median
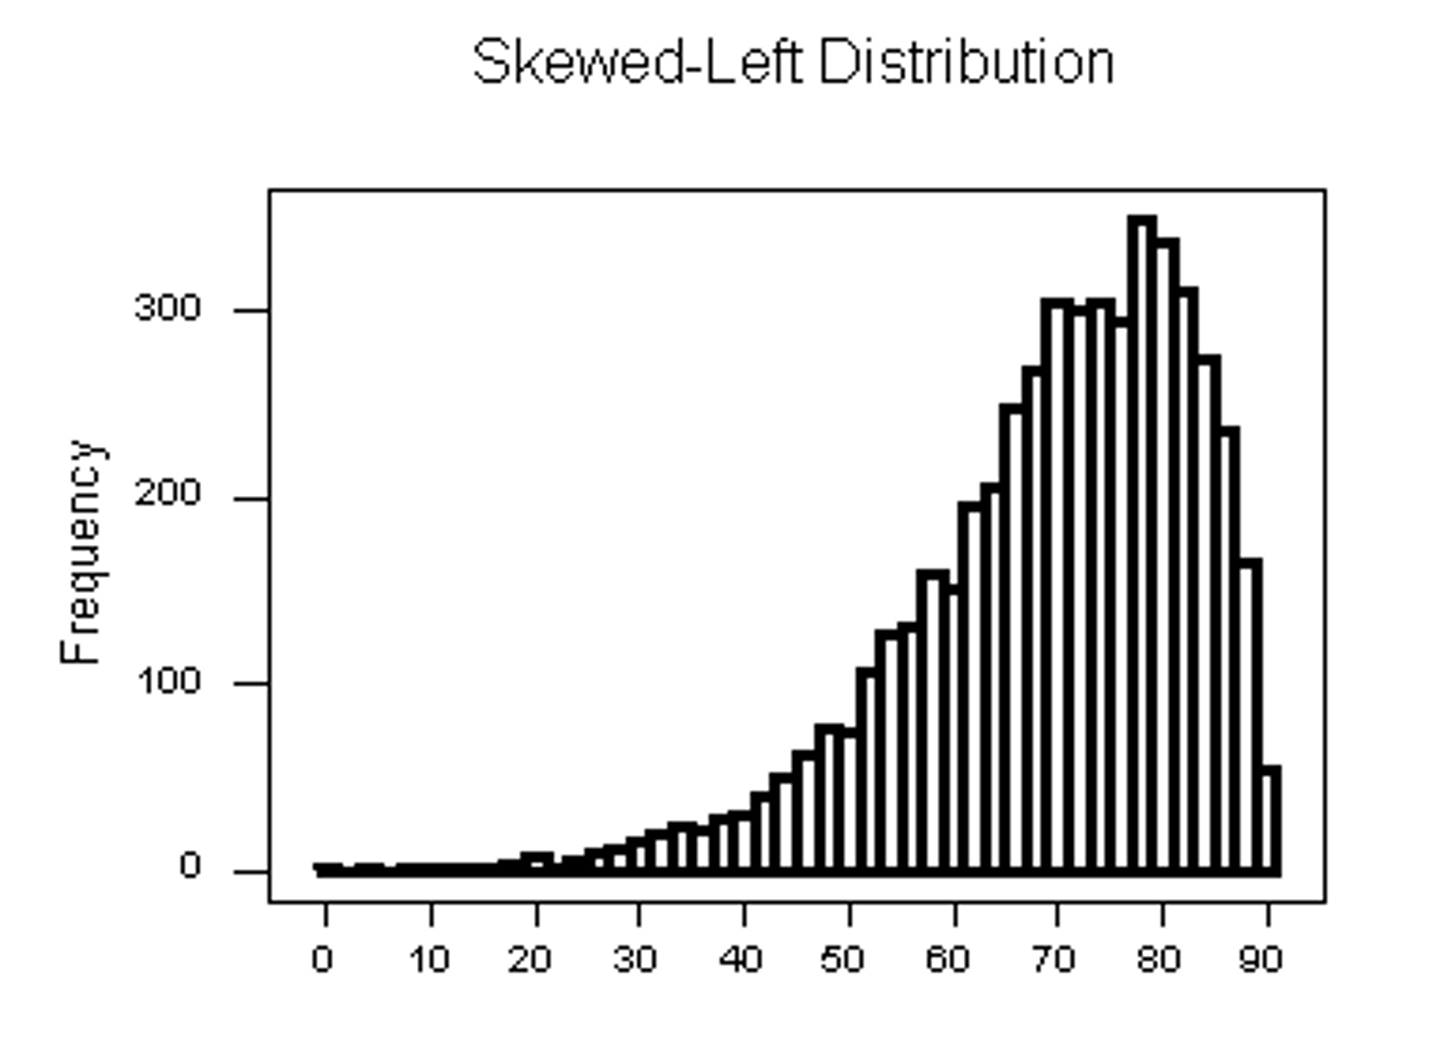
What is left skewed in histograms?
tail towards the left, mean < median
What is right skewed in a boxplot?
2 outliers, mean > median
what is left skewed in a boxplot?
multiple left sided outliers, mean < median
what is probability?
-the measure of how likely a specific event/ outcome will occur in an experiment
-all must be between 0 and 1, inclusive
What does it mean if the probability of an event (E) is 0?
the event is impossible, P(E)=0
What does it mean if the probability of an event (E) is 1?
the event is certain to happen, P(E)=1
The closer the probability is to 0 indicates...
the more unlikely the event is to be observed
The closer the probability is to 1 indicates...
the more likely the event is to be observed
What would you expect is P(E) = 0.5?
EXPECT 50% of repeated experiments to produce that outcome
What is the conditional probability equation?
P(A/B) = (P(A and B))/P(B)
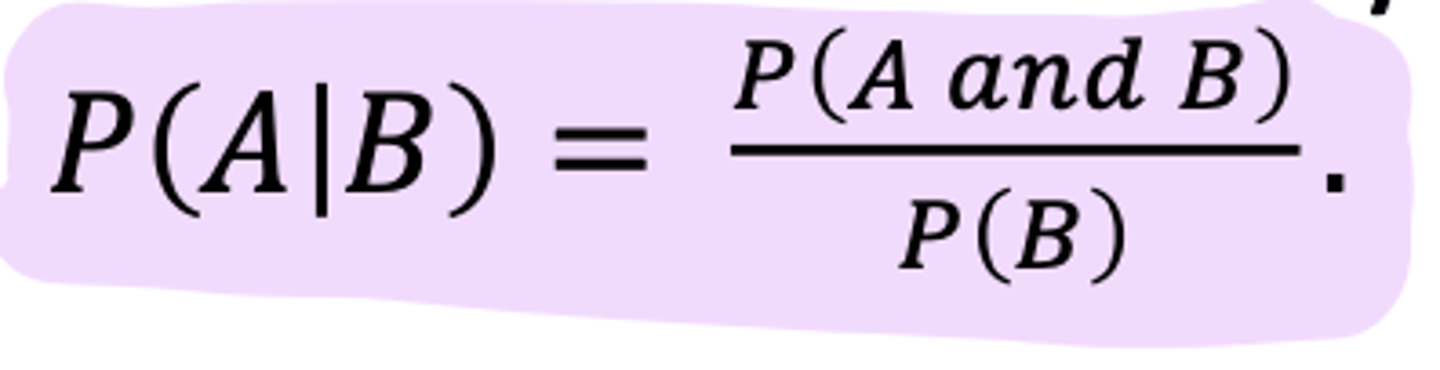
What does it mean is P(A/B) = P(A)?
events A and B are said to be independent
the probability of A is not altered by conditioning to a specific group or event
what is science looking for in terms of probability and events?
looking for dependence among events, such as the probability of the event of stroke being dependent on high BP
What is a probability distribution?
Fully describes the probability of any outcome in the sample space
How does probability distribution guide expectations?
use reasonable and unreasonable expectations
understand and observe--> helps predict outcome
what are the characteristics of probability distributions?
-mean (center location)
-Variance (dispersion)
-Median/ Q1/ Q3 (percentiles)
-shape
what is sample mean X from your data estimating in a probability distribution?
estimating the probability distribution mean (u)
The observations (data) in your sample are inheriting characteristics from the probability distribution, so the sample mean X from your data is...
estimating the probability distribution's mean (u)
The observations (data) in your sample are inheriting characteristics from the probability distribution, so the sample variance s^2 from your data is...
estimating the probability distribution's variance (sigma^2)
The observations (data) in your sample are inheriting characteristics from the probability distribution, so the shape you see in a histogram/ boxplot is...
estimating the shape of the probability distribution
what are the statistics you calculate from data estimating?
estimating the parameters of the probability distribution that represents the population
Why do statisticians use probability distributions?
to model how the outcomes are distributed for the population
estimate 'population parameters'
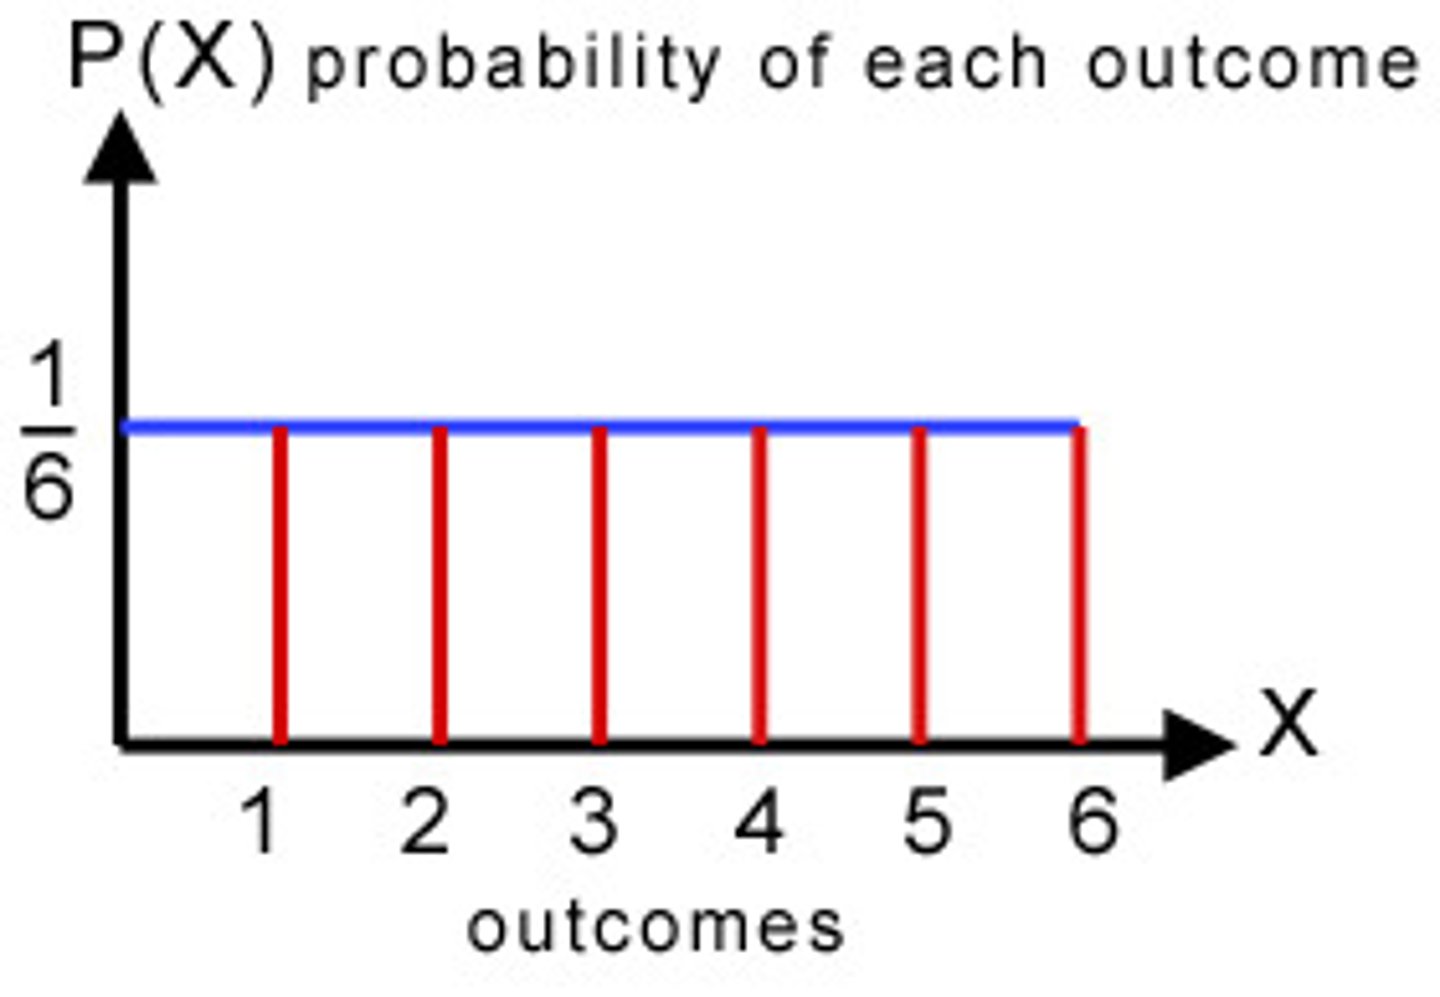
What is a discrete uniform graph?
-equal amount of space between each line (symmetric)
-mean: the middle of the
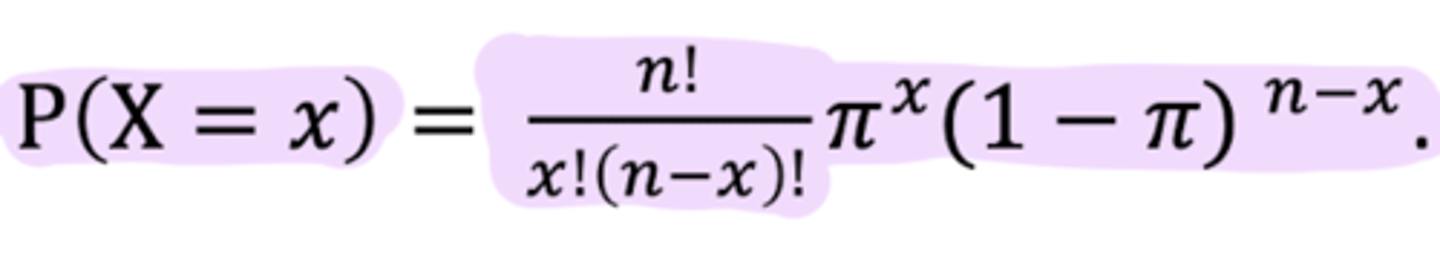
What is the Binomial Distribution?
-common distribution
-models outcomes that can only take on 2 values
-ex: prescribed a statin, either a person has been prescribed one or not
-assumes n independent trials where each trial has the probability pi of observing an event
-outcome X is the total number of events observed from n trials
what is the Binomial distribution equation?
pi= probability of observing an event
X= total number of events observed from n trial
n= independent trials
what is the EXCEL equation for binomial distirbution?
=Binom.dist(4,10,.365,0)
X=4
pi= 0.365
n= 10
What is the mean equation for binomial distribution?
u= n*pi
what is the variance equation for binomial distribution?
(sigma^2)= npi(1-pi)
What is normal distribution?
a probability distribution used for continuous outcomes, such as height, IQ, serum cholesterol
What is the equation for normal distribution?
X~N(u,sigma)
What is standard normal distribution?
-normal distribution with u=0 and sigma=1
-Z~N(0,1)
-probability is measured area under the curve, meaning you can only assess probability for a 'range' such as P(Z<1)
When is standardizing used in normal distribution?
used to change the mean to 0 and standard deviation to 1, making it easier to calculate
What is the equation for standardizing?
Z= (X-u)/ (sigma)
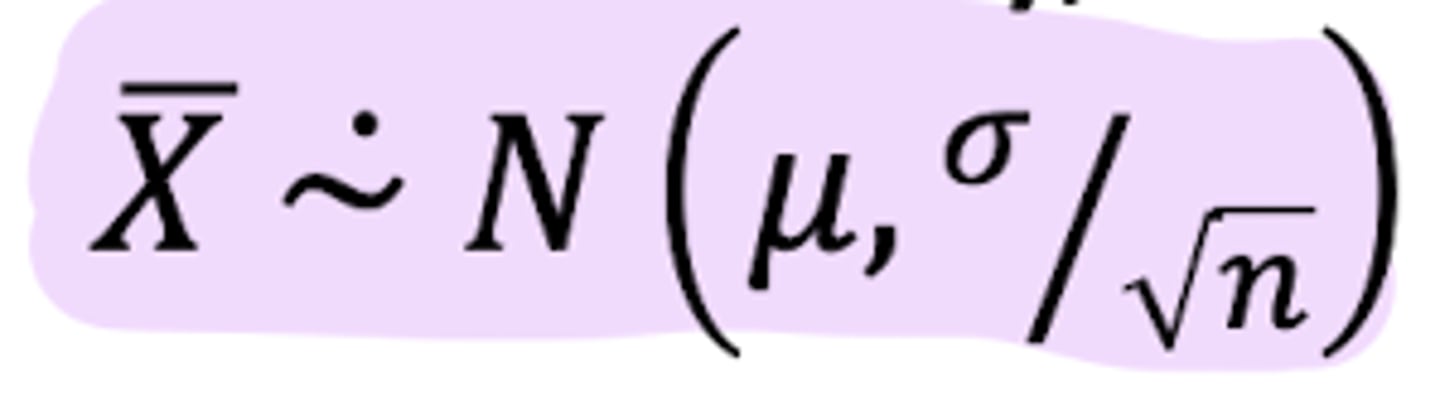
What does the Central Limit Theorem state?
If n is sufficiently large, then the sample mean X-bar will follow an approximate Normal distribution with mean = u and standard deviation = (sigma)/ (square root n)
Assume you observe n independent and identically distributed observation (x1, x2, ... xn) from a probability distribution with the mean = u and standard deviation = sigma
why is the central limit theorem important?
states statistics follow probability distribution
For a sufficiently large sample size (n), what is the sampling distribution formula?
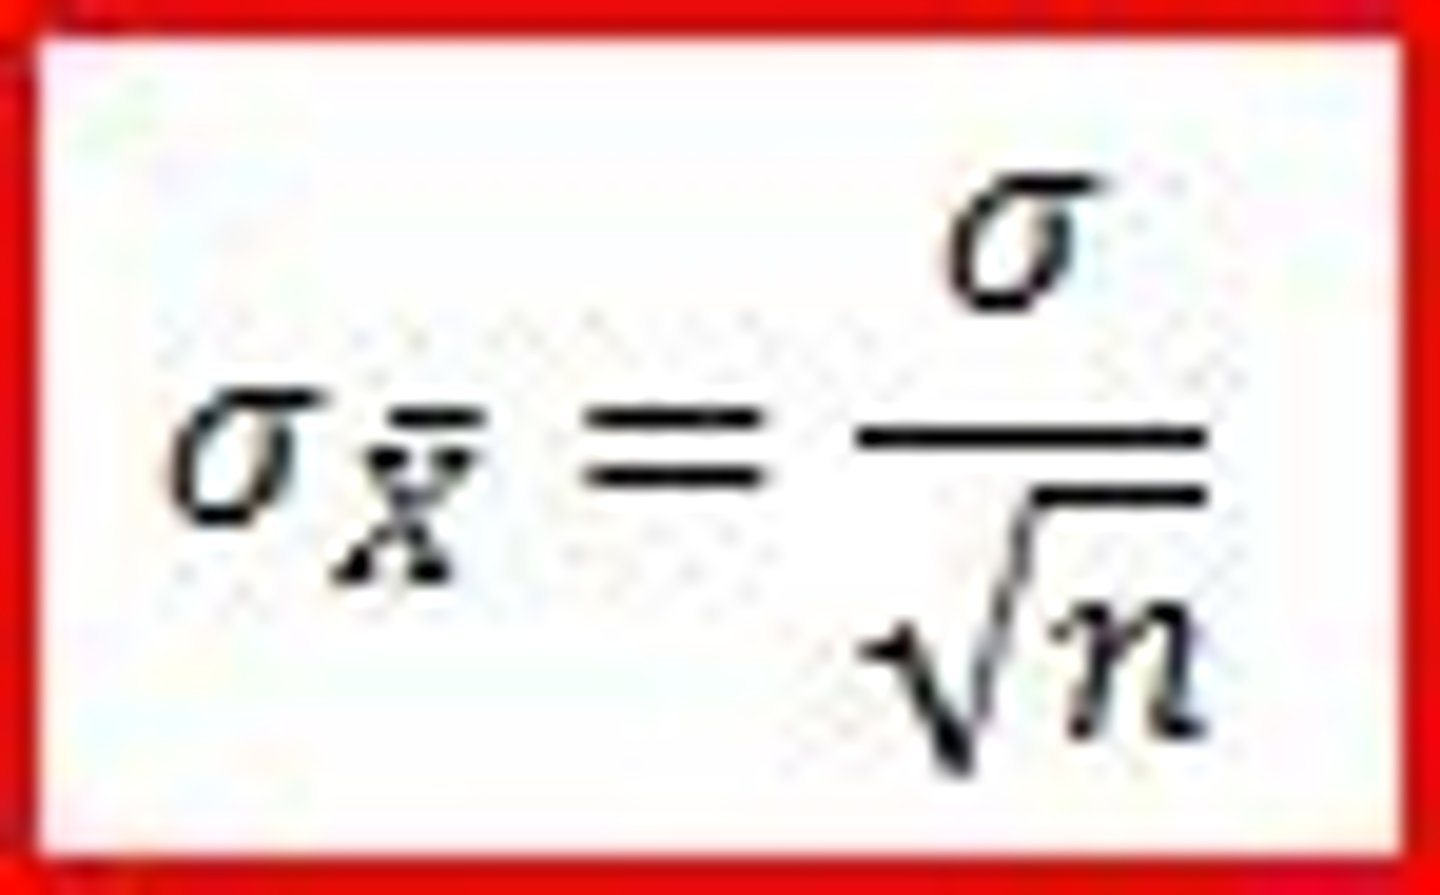
What is the standard error of the mean?
the standard deviation of the sampling distribution of the mean
what is the null hypothesis?
H0= u=u0
person is innocent
What is the alternative hypothesis?
Ha= u ≠ ua
What is a type 1 error?
when we reject the null hypothesis when it's true
ex: person convicted when they are innocent
What is a type 2 error?
we fail to reject the null hypothesis when it is false
ex: declaring a person NOT GUILTY when the person is truly guilty
what is the p-value?
probability of observing the test statistics or one even more extreme given the null hypothesis is true
what does alpha represent in hypothesis testing?
represent the probability of a Type 1 error rate
probability of rejecting the null hypothesis when it is true
often set at 0.05 or lower
what does beta represent in hypothesis testing?
-represents the probability of a Type II error
how are alpha and beta related?
inversely related
when you choose a very low level of alpha, you actually increase beta
what is Statistical Power?
probability of rejecting the null hypothesis Ho given it is false; compliment of beta, so power = 1-beta
what will be the effect of power if delta (uA-uO) increases?
power will increase
what will be the effect of power if delta (uA-uO) decreases?
power will decrease
what will be the effect of power if n (sample size) increases?
power will increase
what will be the effect of power if n (sample size) decreases?
power will decrease
what will be the effect of power if alpha (type 1 error) increases?
power will increase