Lecture 6: research strategies and validity (part 1)
1/47
There's no tags or description
Looks like no tags are added yet.
Name | Mastery | Learn | Test | Matching | Spaced |
|---|
No study sessions yet.
48 Terms
what are the designs used to measure relationships between variables? (3)
descriptive: examine individual variables
correlation: examine relationships between variables by measuring variables for each group/participant
experimental: examine relationships by comparing groups of score
define “descriptive research design” (goal, 2 pros, 2 cons)
goal: obtain a description of specific characteristics of a specific group
pro:
pretty complete picture of what’s happening at that time
allows for more development
con:
doesn’t assess relationships among variables
unethical if the participants don’t know they are being observed
define “correlational research design” (goal, 2 pros, con)
goal: assess relationship between two or more variables
pros:
you can test relationships between variables and make some predictions
works for everyday life events
con: can’t do inferences about the causal relationship
define “experimental research design” (goal, pro, 2 cons)
goal: assess the causal impact of one or more experimental manipulations (IV) on the DV
pro: you can do causal relationships
cons:
can’t experimentally manipulate many important variables
can be expensive and time consuming
descriptive, correlational or experimental:
On average, adults who have low exercise amounts have a cholesterol value of 190 (high)
Variable = exercise level (low/high)
Data = cholesterol value
descriptive: you want to produce a description of individual variables as they exist within a specific sample of individuals. They are observations without manipulations of variables.
descriptive, correlational or experimental:
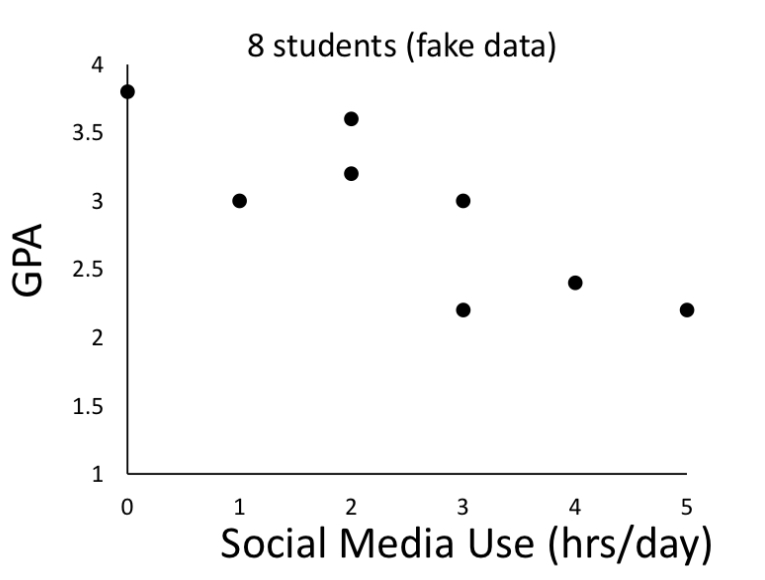
There is a negative relationship between Social media use and GPA for college students, but we don’t know why.
Variables = social media use, GPA
Data = scores on both variables
correlational: produce a description of the relationship between two variables but do not attempt to explain the relationship
descriptive data can use nominal, ordinal, interval and ratio scale. what scale would you use for numerical and nonnumerical data and why?
numerical: interval or ratio
use mean of scores
nonnumerical: nominal
use mode or have a percentage for each category
why would you use a scatterplot for a correlational study?
an assumption of correlational analysis is that you only have one data per person (or group depending on what you are measuring)
that is well represented in a scatterplot as one point represents one person
what are the possible relationships between variables in a correlational data analysis? (3)
linear: positive or negative
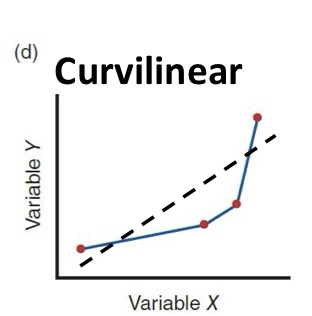
curvilinear: not a straight line
no association
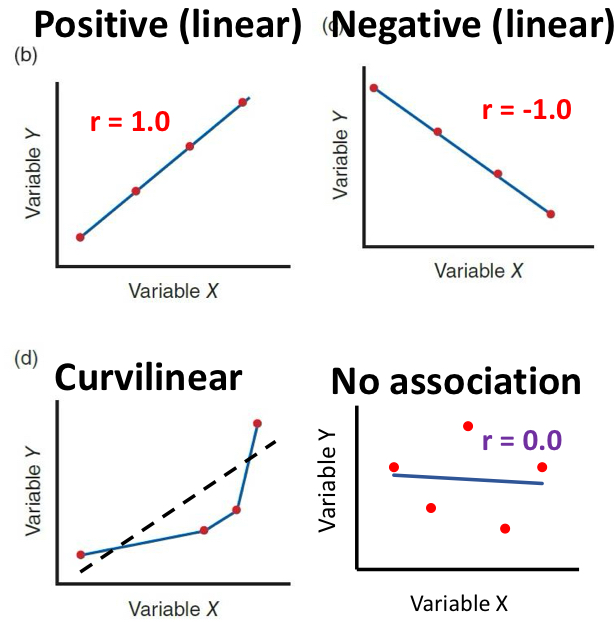
Pearson correlation is appropriate for [curvilinear/linear] but not for [curvilinear/linear]
appropriate for linear, not for curvilinear
how does the Pearson correlation coefficient (r) work?
r is based on the distance of each point from the best fitting line (the smaller the distance, the better fit)
it can go from -1 to +1
±1 means a perfect linear association while 0 means no linear association
why doesn’t the Pearson correlation coefficient work with curvilinear associations?
because if you fit a curvy linear data with a linear line, you wouldn’t be able to demonstrate the relationship between x and y (need to use another type of analysis)
define “outliers”
values that stand out from other values
true or false: outliers only matter for small samples
false: they matter for both big and small, but more for small
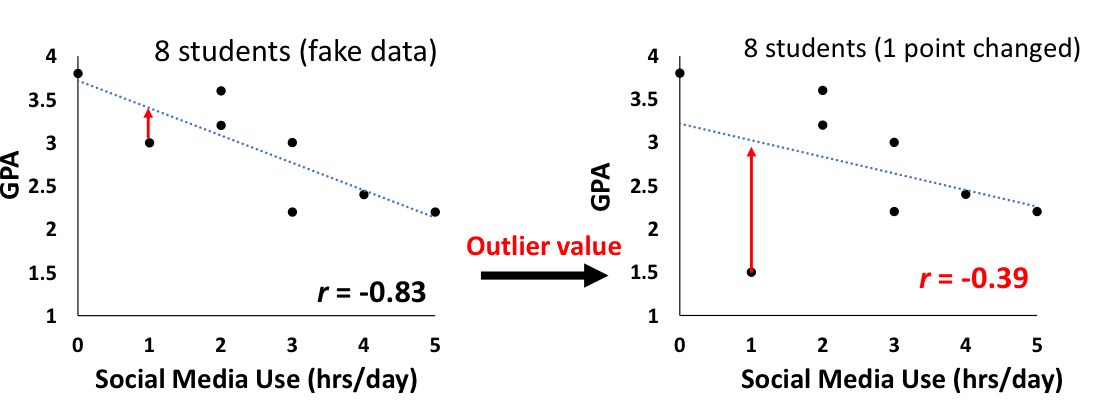
how can one outlier (both on x and y) have a big impact on the correlation outcome?
because the correlational coefficient computes differences from each point to the best fitting line, meaning that one point can contribute a lot to the correlational value
when should you NOT use a bar chart?
when the x and y values aren’t being measured on the same scale
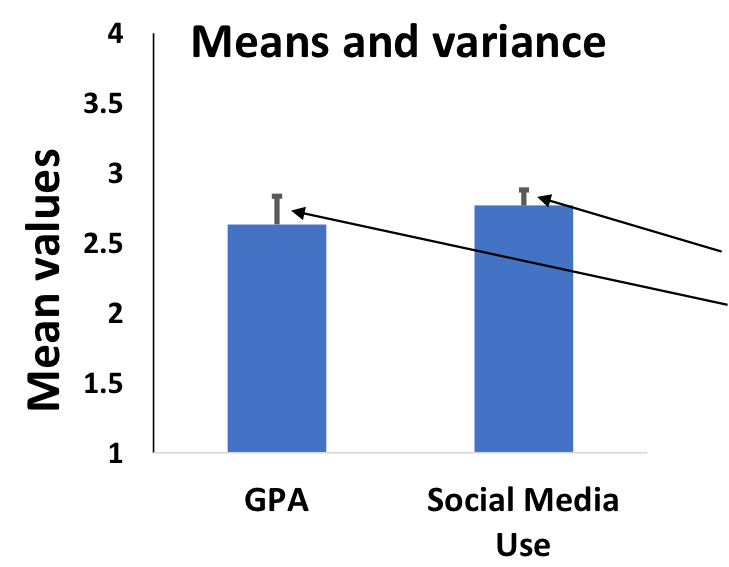
what do these bars on top represent?
standard error bars: measure spread of data
what are the research strategies used for experimental research design?(3)
experimental: answers the cause-and-effect question
quasi-experimental: almost scientific (like experimental), but doesn’t answer the cause-and-effect explanation
non-experimental: shows a relationship between variables, but doesn’t explain it
define the “experimental research strategy” (goal and design)
goal: define the cause-and-effect explanation for the relationship between two variables
design: create 2+ conditions by changing the level of the IV and then measure data for each condition (DV)
define the “quasi-experimental research strategy”
wants to define a cause-and-effect, but settings stop it from being a true experimental strategy
define “non-experimental research strategy” (goal, design)
goal: produce a description of the relationship between two variables but doesn’t try to explain the relationship
design: measure scores for two different groups of participants or for for one group at different times
the quasi-experimental strategy should be as scientific as the experimental strategy, but isn’t. why?
the quasi-experimental design is often used on participants with a special case who cannot be sampled randomly (ex: autistic kids, smokers)
meaning, we can’t have a control condition
depending on what we are examining, if the people were chosen randomly, the other group might not exhibit the same behaviour
why do quasi-experimental strategies have threats to external validity?
we don’t have a control condition, so we don’t know how well the findings can be generalized since we only have one condition
why can’t you come up with explanations about the relationship between variables in a non-experimental strategy? (3)
no random sampling
no control condition
fixed by one set of population member
experimental, quasi-experimental or non-experimental:
More exercise causes a decrease in cholesterol levels.
Independent Variable = Exercise (Low/High)
Data = cholesterol measures
experimental: define a cause-and-effect explanation for the relationship between two variables
experimental, quasi-experimental or non-experimental:
Do autistic children decrease disruptive behavior following relaxation training?
Independent variable: relaxation training for one year
Data: number of disruptions pre-, post-training
quasi: define a cause-and-effect explanation but falls short. Study of independent variables in settings where true experimental designs are not possible
experimental, quasi-experimental or non-experimental:
Will sitting (too) close to a participant encourage them to move away?
Independent variable: Experimenters sitting next to a participant in an empty room with chairs
Dependent variable: duration before they get up to move
quasi: define a cause-and-effect explanation but falls short. Study of independent variables in settings where true experimental designs are not possible
experimental, quasi-experimental or non-experimental:
Will a smoking intervention program reduce smoking in participants who smoke?
Independent variable: Relaxation Intervention program
Dependent variable: amount of daily smoking, pre- and post-intervention program
quasi: define a cause-and-effect explanation but falls short. Study of independent variables in settings where true experimental designs are not possible
experimental, quasi-experimental or non-experimental:
Do people with brown eyes spell more accurately than people with blue eyes?
Independent variable: Eye color (cannot choose randomly, you’re already assigned prior)
Dependent variable: performance on spelling quiz
quasi: define a cause-and-effect explanation but falls short. Study of independent variables in settings where true experimental designs are not possible
experimental, quasi-experimental or non-experimental: There is a relationship between gender and verbal ability: girls tend to have higher verbal skills than boys, but we don’t know why.
non-experimental: produce a description of the relationship between two variables but does not attempt to explain the relationship (no causality)
experimental, quasi-experimental or non-experimental:
Researchers tested whether the time students spent using their laptop for non-academic reasons (social, internet, games, etc) during a class period is related to their grades in the in the class.
Findings: As time spent on laptop increased for non-academic uses, grades obtained in the course decreased.
non-experimental: produce a description of the relationship between two variables but does not attempt to explain the relationship (no causality)
what are the similarities (3) and differences (2) between non-experimental and correlational research?
similarities:
demonstrate a relationship between two variables
vulnerable to internal validity concerns
don’t explain causality
differences
correlational tends to sample more broadly
non-experimental targets specific participant groups
what are the aspects you should decide on for a research study? (3)
group VS individual (case study or single-subject)
within or between-subjects (same individuals VS different individuals)
how many IVs (number of variables included)
→ these decisions provide general research methods framework for your sired
what should be under the “procedure” section of an APA article? (4)
exact step-by-step description of our study, enough information to repeat it:
how the variable was manipulated and measured
how many people involved, what are the criteria to be a participant
how participants proceeded in the study
what instructions were given
define “confirmation bias”
interpreting information in a way that confirms your beliefs or hypotheses
true or false: scientists can sometimes unknowingly share their biases to participants
true: when they give them instructions, verbally or written
how can you avoid conformation bias in the lab? (5)
designs should be examined by every lab members, not just the one working on the project
critical views on the hypothesis
have everyone examine the primary data, not just one person
design experiments that test the hypothesis, not support the idea only (hypothesis should be proven or disproven)
set standards
can anyone think of an alternative explanation if the predictions are true = [internal/external] validity
can anyone think of a situation where this outcome is not likely to be true = [internal/external] validity
internal
external
what are the standards you should set before starting an experiment in order to avoid confirmation bias? (3)
which results will provide support for the hypothesis
which results will disprove the hypothesis
which results won’t provide any useful information
what’s the difference between internal and external validity?
internal: the extent to which you can confirm that the changes in x have caused the changes in y
external: the extent to which your results can generalize in other settings and populations
true or false: it is possible to eliminate all threats to validity
false
what are the threats to external validity?
factors that limit our ability to generalize beyond the study
what are the threats to internal validity?
variables that offer different explanations for the IV-DV relationship
define “research strategy”
approach to research determined by the kind of question you want to answer
define “research design”
plan for implementing a research strategy: who will be involved, how many variables, etc
define “research procedure”
step-by-step description of a specific study
explain the difference between research strategy, design and procedure
strategy: general approach
design: how will you implement the research strategy
procedure: step-by-step description of your research study
what’s the difference between quasi-experimental and non-experimental?
quasi: try to include control and rigour, want to know the causal relationship between IV and DV
non: no control or rigour, no support for causal relationship between IV and DV