GEO2440 Spatial Data - Raster and Vector
1/44
There's no tags or description
Looks like no tags are added yet.
Name | Mastery | Learn | Test | Matching | Spaced | Call with Kai |
|---|
No analytics yet
Send a link to your students to track their progress
45 Terms
What is spatial data?
Contains information about a physical object that has a size, shape and location on Earth and is represented in a geographic coordinate system.
Is data that can be mapped to provide representations of the real world for quantitative/qualitative uses.
Doesn’t have to be mapped, e.g. can also be the distance between 2 points.
Is multidimensional and is often stored as coordinates and topology.
What is a data model?
A mathematical construct for representing geographic objects or surfaces as thematic layers, including their spatial representation, attributes, portrayal and relationships.
What are the two types of spatial data/data models?
Raster
Vector
What is a spatial entity?
A representation of the real world - the things seen on a screen as opposed to the real things.
Therefore, real things are represented as entities.
Are spatial entities true representations of the real world?
No, for example pylons being represented as crosses.
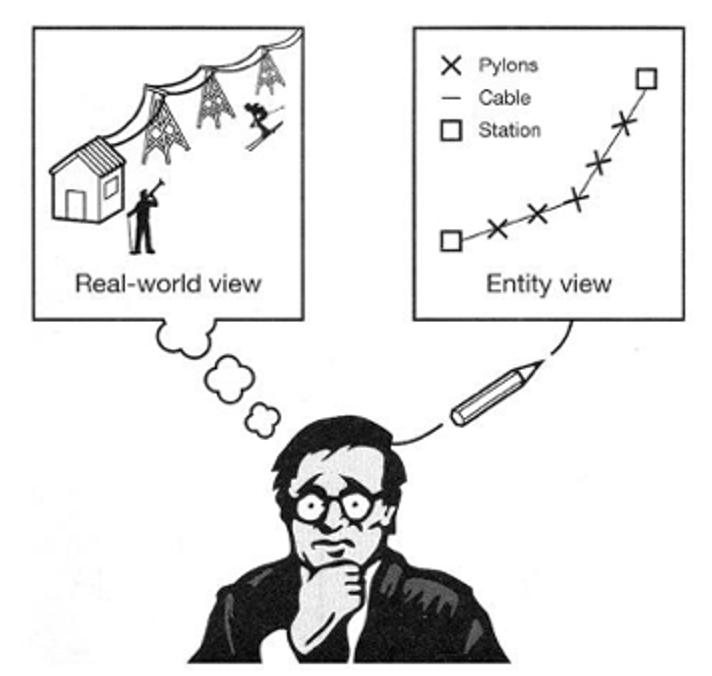
What is a ‘feature’?
The original/real world thing that is being represented as an entity.
What are the problems with spatial entities?
Scale
Dynamics
Definition/fuzziness
Explain the problem with scale for spatial entities
How the real world is modelled varies with scale - for example one scale is a side street in England, or another is the whole world view. These are hardly comparable at the same scale.
There is a limited resolution that can fit onto a map.
Explain the problem with dynamics for spatial entities
The real world isn’t static. Streams flow and flood, forests grow and are cleared.
Different features also change at different rates.
Therefore GIS cannot ever map things accurately as by the time maps etc are created things will have inevitably changed.
Explain the problem with definition for spatial entities
Many real world features don’t fit into the categories of entities available (nature is full of poorly-defined boundaries).
However, a decision on a boundary in GIS has to be made - so they are often inaccurate.
What influence these problems/how to represent the real world?
The purpose of the entity data.
What are data structures?
What provides the information the computer needs to construct the data model in digital form.
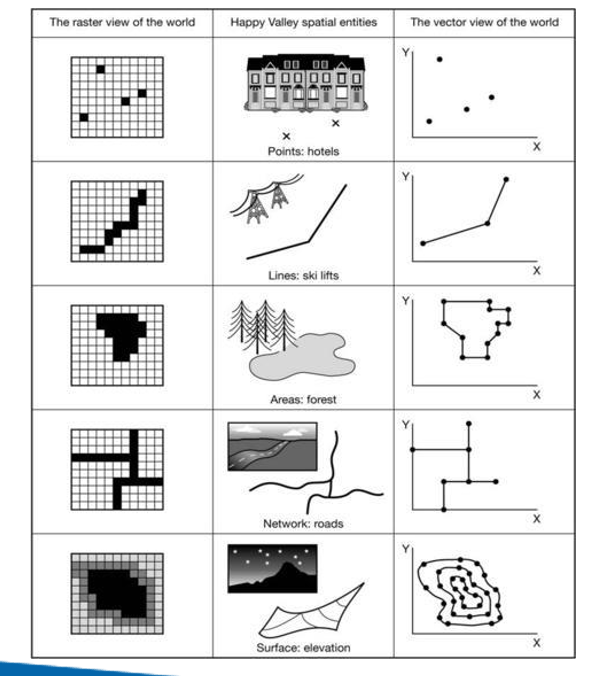
What is raster data?
When the world/data is represented as same-size pixels, each pixel with a value (and potentially colour).
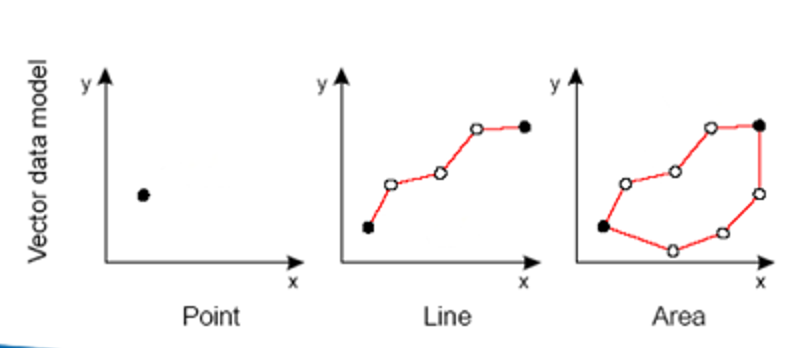
What is vector data?
The world/data is represented as points, lines or polygons.
No redundant points.
Only one value for the whole vector layer.
Ideal for storing data with discrete boundaries.
Can both raster and vector data be used in one project?
Yes.
But they cannot be within the same layer.

Comparison of raster and vector data
RASTER: What are the two types of raster data?
Continuous
Thematic/discrete.
RASTER: explain the pixels in raster data
Each pixel must be one value only. W
Within the entire image there can be redundant points…
Therefore there can be different values within one raster layer - different values in different pixels.
All pixels are the same size…
The resolution of a raster image is the length of one side of the pixel, e.g. 25×25 squares = 25cm resolution.
Instead of XY location of every cell, raster has to have a string of numbers in their particular order… the system knows the starting point so knows the locations of each cell.
RASTER: what is discrete raster?
Raster that represent phenomena that have clear boundaries with attributes that are descriptions, classes, or categories.
Generally, (but not always) integers are used for the cell values.
It is assumed that the phenomena that each value represents fill the entire area of the cell.
E.g. land cover.
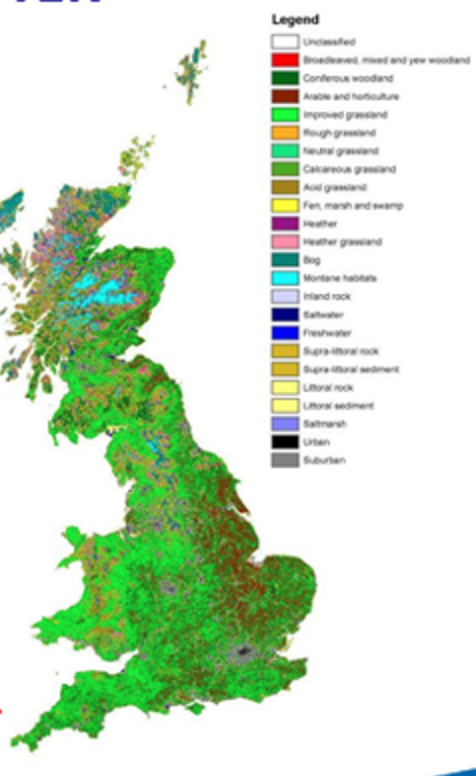
RASTER: what is the limitation of discrete raster?
It cannot go below the resolution of each pixel.
Therefore the land cover in one cell may not be simply grassland, but maybe heathland too. However this can’t always be shown.
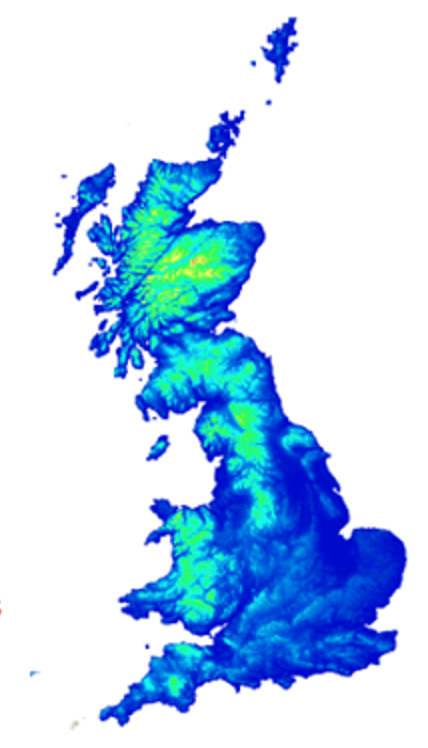
RASTER: what is continuous raster?
Raster in which cell values vary continuously to form a surface. There are no hard boundaries.
Values exist on a scale relative to each other. Multiple rasters represent a gradual change.
It is assumed that the value assigned to each cell is what is found at the centre of the cell
E.g. elevation, temperature.
RASTER: the use of raster for remote sensing imagery.
Is more detailed: as different pixels store different values more can be determines from raster remote sensing. If vector is used an entire location would look the same.
Raster is inefficient at storing remote sensing data, multiple pixels take up more storage/files than one value for vector.
RASTER: raster bands.
A raster dataset can contain one or more layers called bands:
Single band
Multiple band
RASTER: explain single bands.
Contain a single matrix of cell values.
Elevation Data
Grayscale aerial imagery
Scanned maps / documents
RASTER: what is an example of a single band raster?
Digital Elevation Model / DEM.
Digital representation of topography.
Represented by pixel based values with a single elevation value representing the entire area of the pixel.
DEMs are typically used to represent terrain relief, and can be used to derive slope and aspect.
RASTER: explain multiple bands.
Contain multiple spatially coincident matrices of cell values representing the same spatial area
TIFFs, IMGs
Remotely Sensed Data
Spectral Data
RASTER: raster attributes
Attribute tables don’t necessarily exist, unless made.
Everything is an attribute in raster.
RASTER: advantages
Easy creation from image data.
Easy to perform mathematical and overlay operations.
Efficient storage of dense/heterogeneous data.
Grid-cell systems compatible with raster-based output devices.
RASTER: disadvantages
Must pre-define spatial resolution.
Requires large volume of storage.
Inefficient when data is sparse or homogenous.
Deals poorly with linear features.
VECTOR: points, lines and polygons
Vector data can be specific points - a single pair of coordinate values (e.g. locations of a species sighting).
Lines are a sequence of points/coordinate pairs strung together.
Polygons are various points/coordinate pairs strung together, where the start and end point is the same.
VECTOR: do lines/polygons really exist?
No.
Every vector layer is simply points or a sequence of points, through which a line is drawn. The line means something to us, but nothing to the computer.
VECTOR: what are the extended types of vector data?
Surfaces (e.g. elevation).
Networks (e.g. roads).
VECTOR: what is one example of data vector is good for representing?
Artificial structure built by humans.
VECTOR: what is the limitation of vector for representing artificial structures, for example?
Data storage.
Requires multiple vector files, as opposed to one raster file.
VECTOR: can vector data create curved lines?
No.
The lines between points are straight.
Therefore, densely located points can create an illusion of a curve… but there will never be an actual curve.
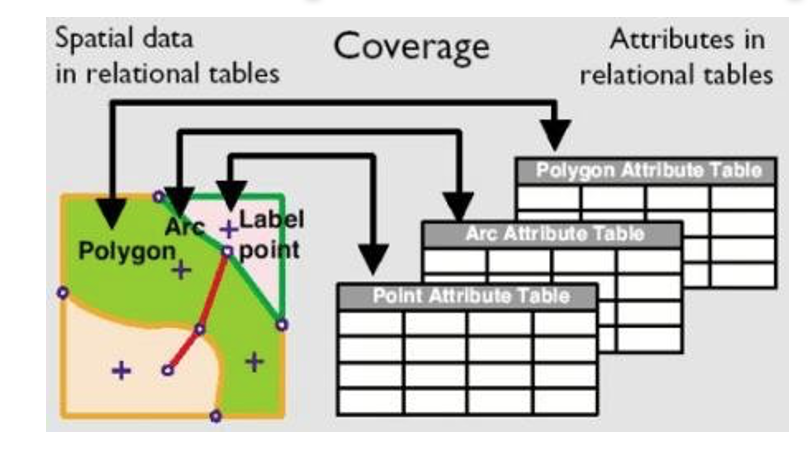
VECTOR: vector attributes.
Everything is linked to an attribute.
Every point, line and polygon is represented in a table somewhere.
Each layer = one table.
Vector data model can store multiple attributes perfeature, and are linked by a Unique feature ID (FID).
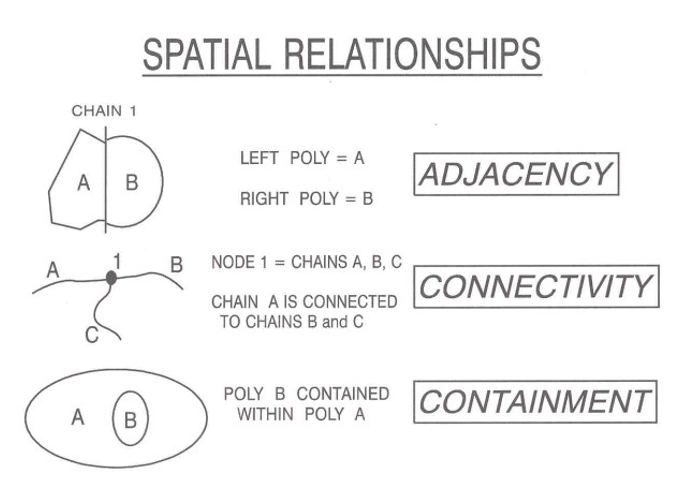
VECTOR: what is the definition of topology?
Geometric characteristics of objects which do not change under transformations.
E.g. if a map is stretched/contorted, the entities initially next to each other remain next to each other, remain connected or will remain within the entity they were originally within.
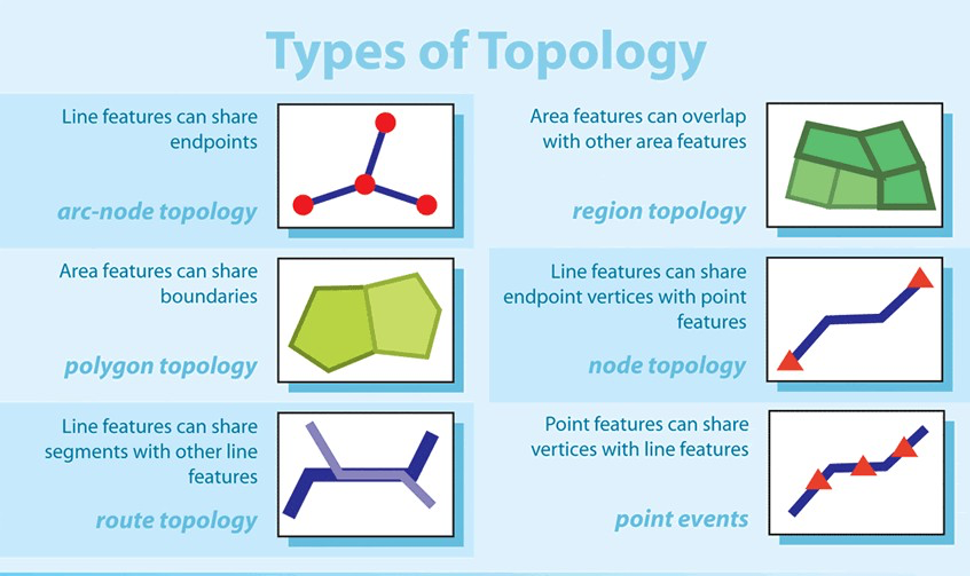
VECTOR: what are the types of topology?
Arc-node - line features can share endpoints.
Polygon - area features can share boundaries.
Route - line features can share segments with other line features.
Region - area features can overlap with other area features.
Node - line features can share endpoint vertices with point features.
Point events - point features can share vertices with line features.
VECTOR: what is a rule when representing land surface?
Points joined to their nearest points will always form triangles.
VECTOR: what is TIN?
Triangular Irregular Network.
Well suited for adjacency/connectivity analysis.
Identifies spatial relationship between spatial entities
Reduces data redundancy (all the data are useful)
Allocates IDs to polygons
VECTOR: DEMS in TIN v raster
DEMS in TIN format have advantages over in raster format, such as memory allocation and speed.
However the format is more complicated.
VECTOR: advantages
Data can be represented at its original and/or high resolution without generalisation.
Accurate positional info that is best for representing discrete and linear features.
Efficient storage of sparse data.
Can associate many attributes to specific features.
VECTOR: disadvantages
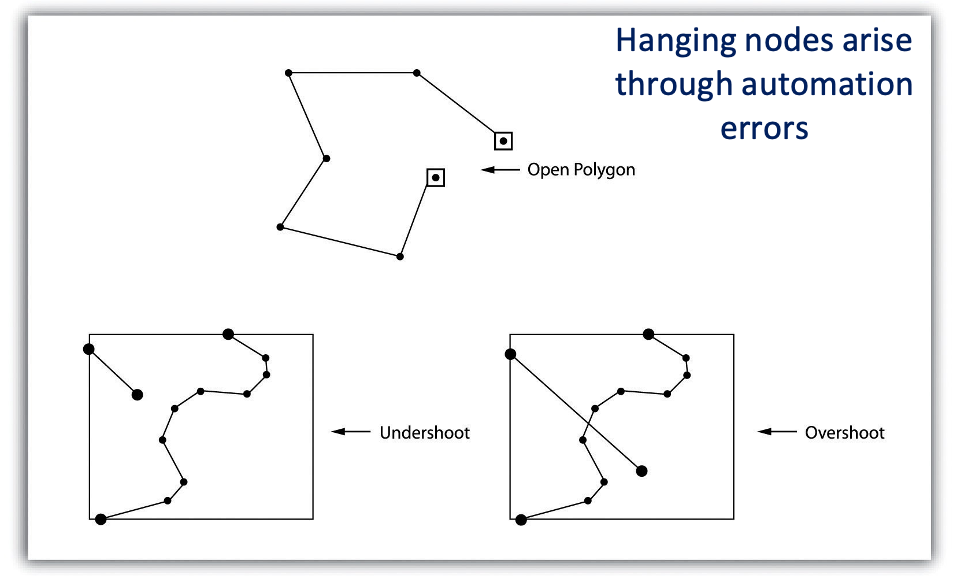
Undershoots, overshoots, open polygons.
Manipulations require sophisticated algorithms.
Processing can require lots of computer time.
Inefficient storage of dense/continuous data.
The location of each vertex (node) needs to be stored explicitly.
Converting data between raster and vector
Can create unknown mistakes. These cause issues later on down the line.
More conversions = more mistakes.
How can you change the resolution of raster and vector data?
RASTER: change pixel size.
VECTOR: change number of points.