OCR B Geography GCSE Fieldwork
1/31
There's no tags or description
Looks like no tags are added yet.
Name | Mastery | Learn | Test | Matching | Spaced | Call with Kai |
|---|
No analytics yet
Send a link to your students to track their progress
32 Terms
fieldwork
the experience of understanding and applying specific geographical knowledge, understanding and skills to a particular and real out-of-classroom context
primary data
data collected by students personally during fieldwork as a result of measurement and observations
secondary data
data collected from sources other than the student; may include published material, reports from public bodies and work of other people.
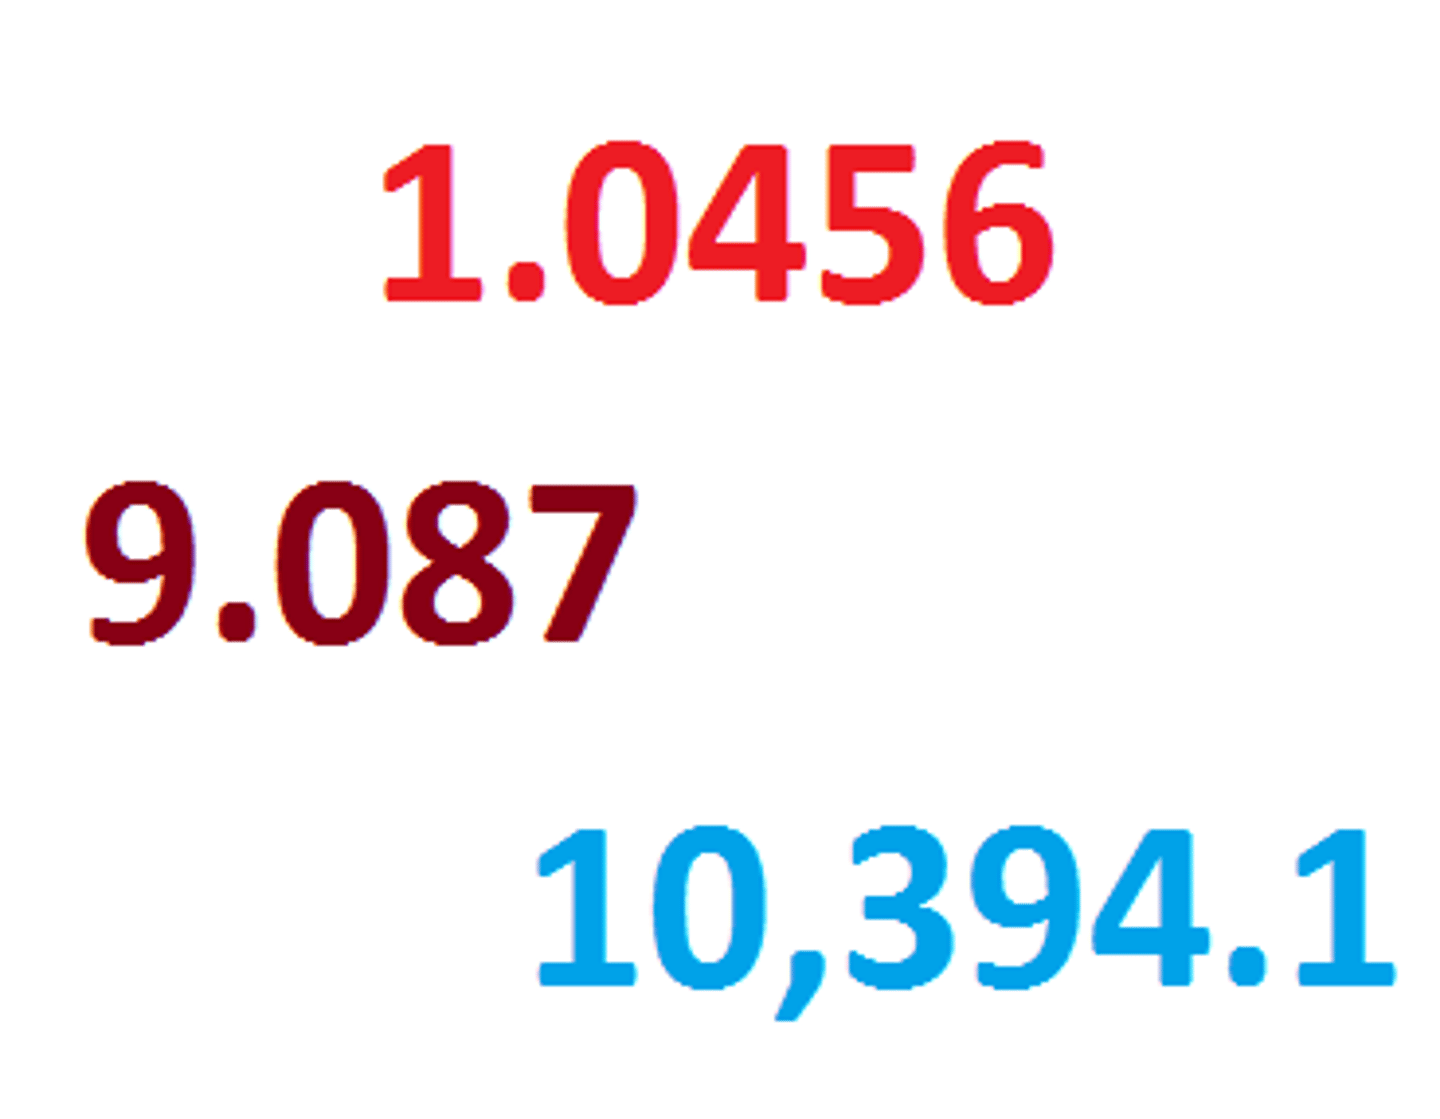
quantitative data
data involving numerical values
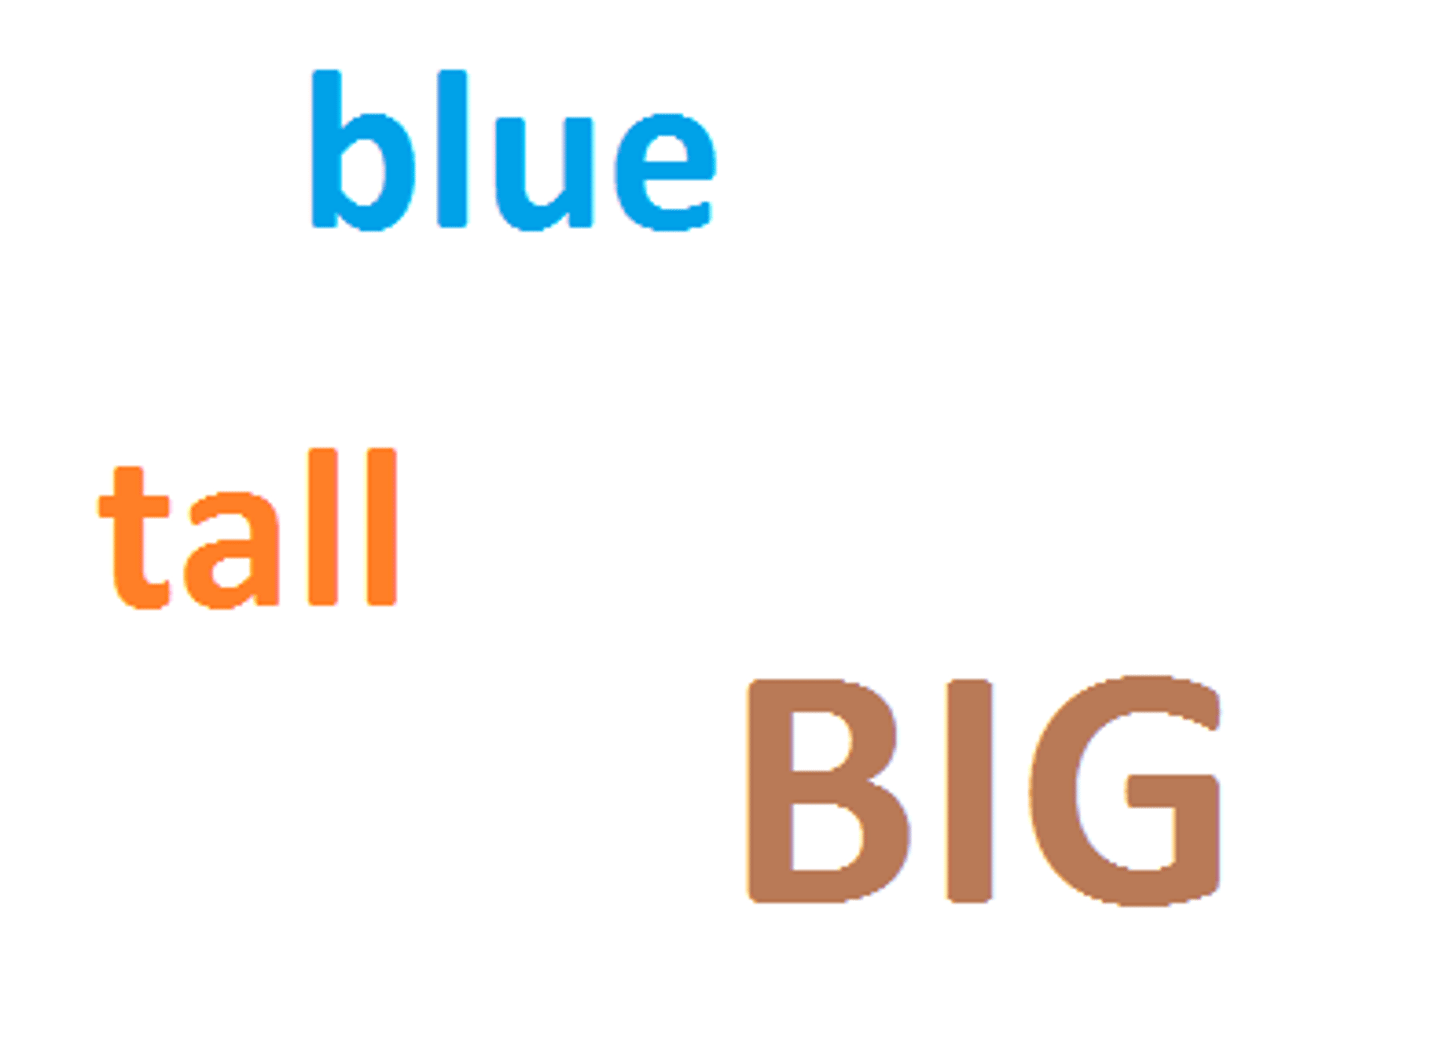
qualitative data
data involving the quality or nature of something rather than its quantity; can be used to refer to observations or opinions of people rather than something that can be given a numerical value.
questionnaire
a printed or written form used to obtain responses to a set of pre-defined questions from one or more respondents

secondary source
a place where you find secondary data, increasingly these are digital, e.g. the Office for National Statistics
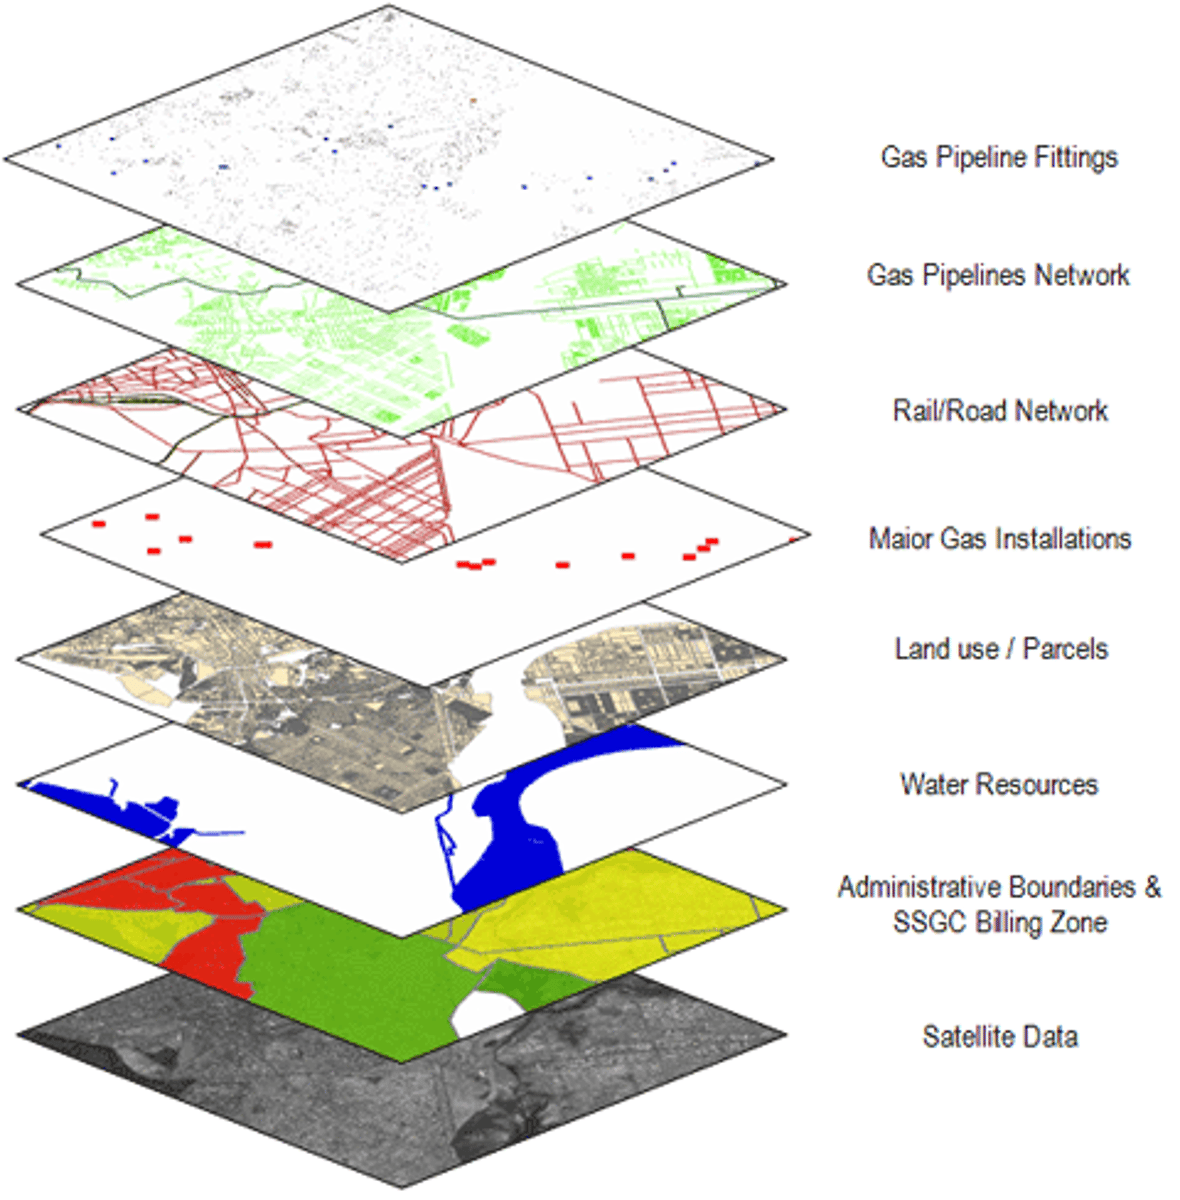
GIS
a sytem for storing and presenting spatial data which allows visualisation, analysis, interrogation and understanding of spatial patterns and relationships
anomalies
data values which don't match the pattern of the sample.
risk assessment
a process by which potential risks are identified, their probablity and severity is determined and appropriate steps to mitigate these risks are taken
sketch map
a rough hand drawn map drawn in the field or from an aerial photograph, used to analyse landscapes
ordinance survey map
a detailed map at a defined scale showing the natural and man-made features of the landscape
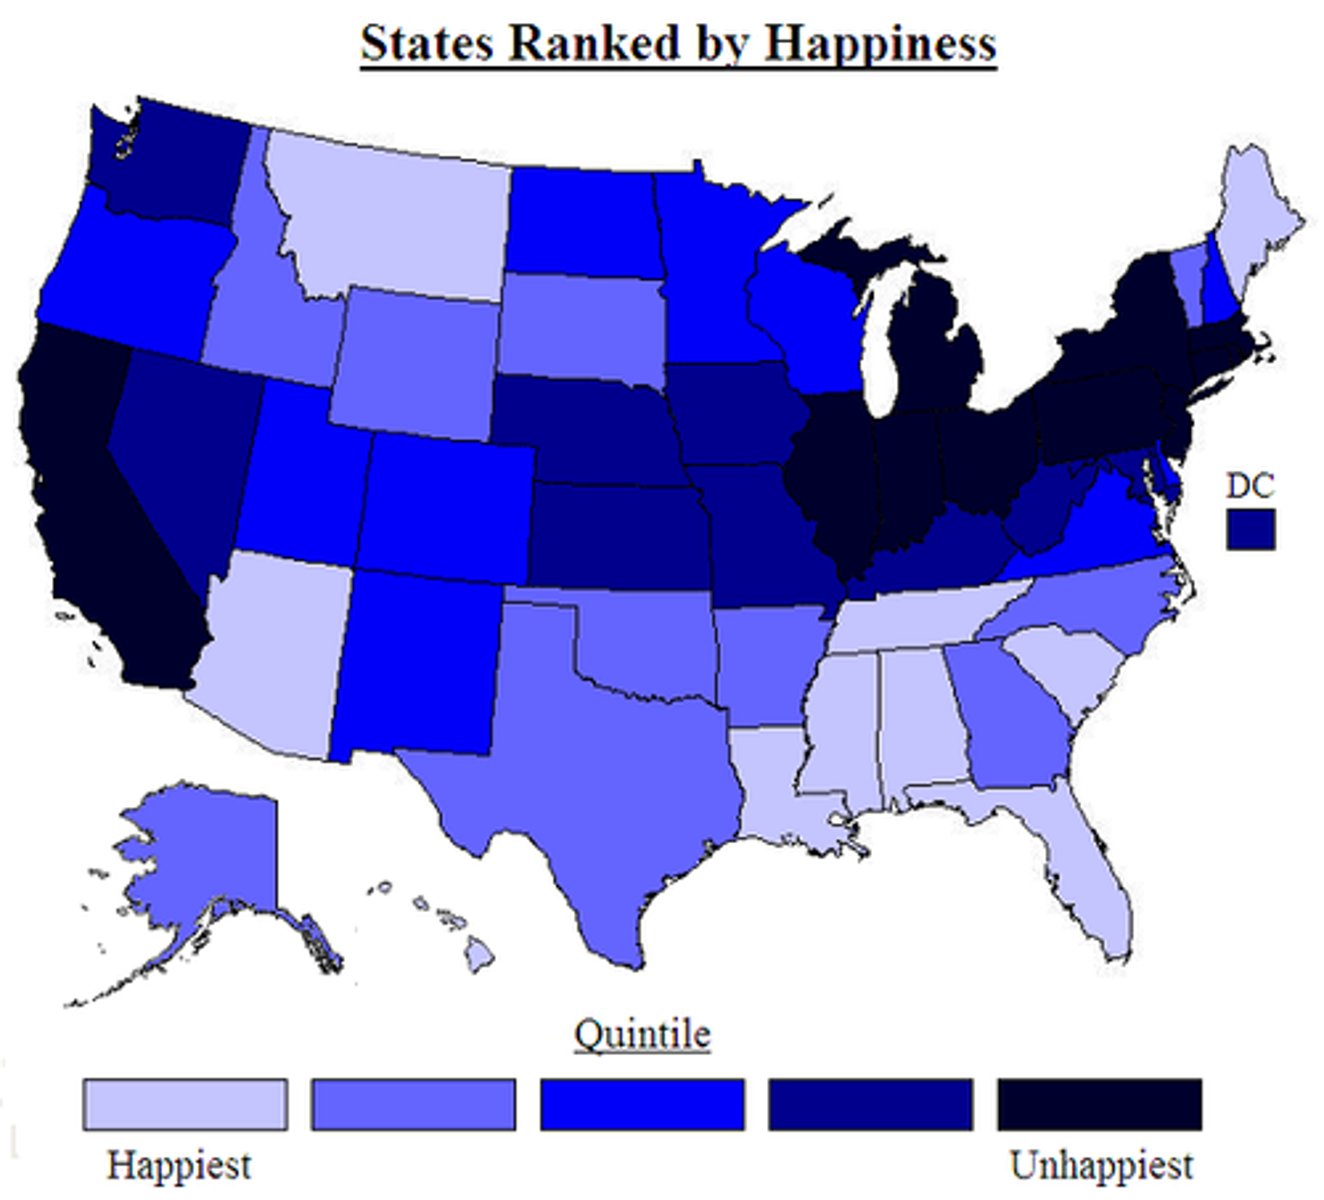
choropleth map
a map that uses colors or tonal shadings to represent categories of data for given geographic areas.
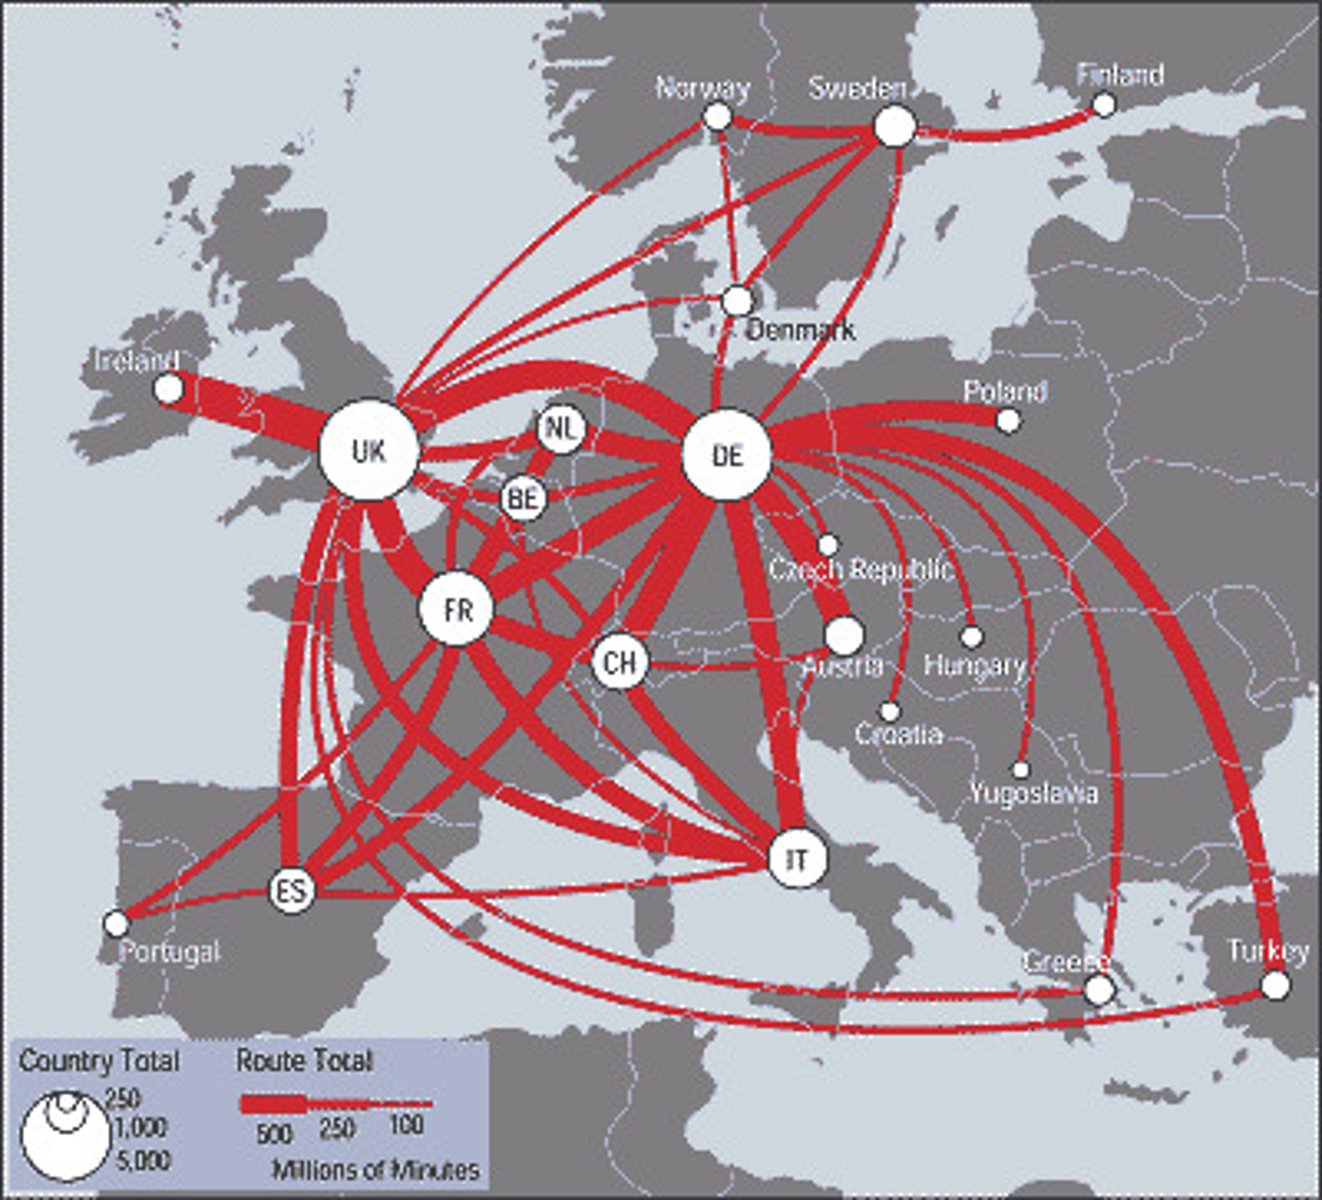
flow-line map
a map which uses lines of varying thickness to show the direction and volume of a particular geographic movement pattern
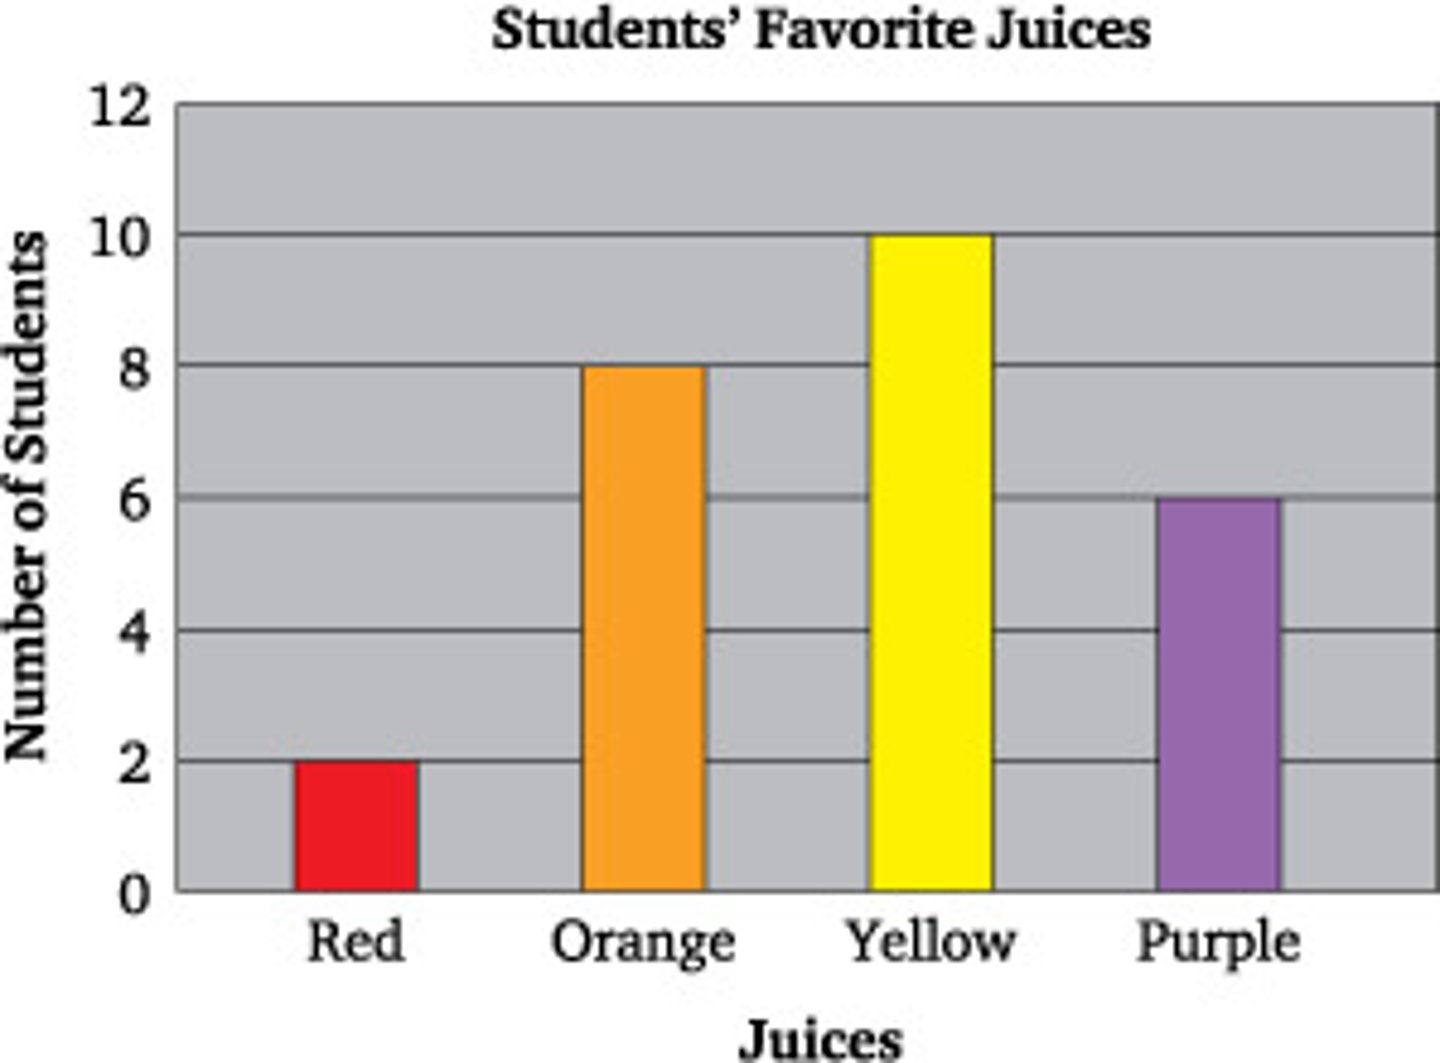
bar graph
a graph that uses horizontal or vertical bars to display data
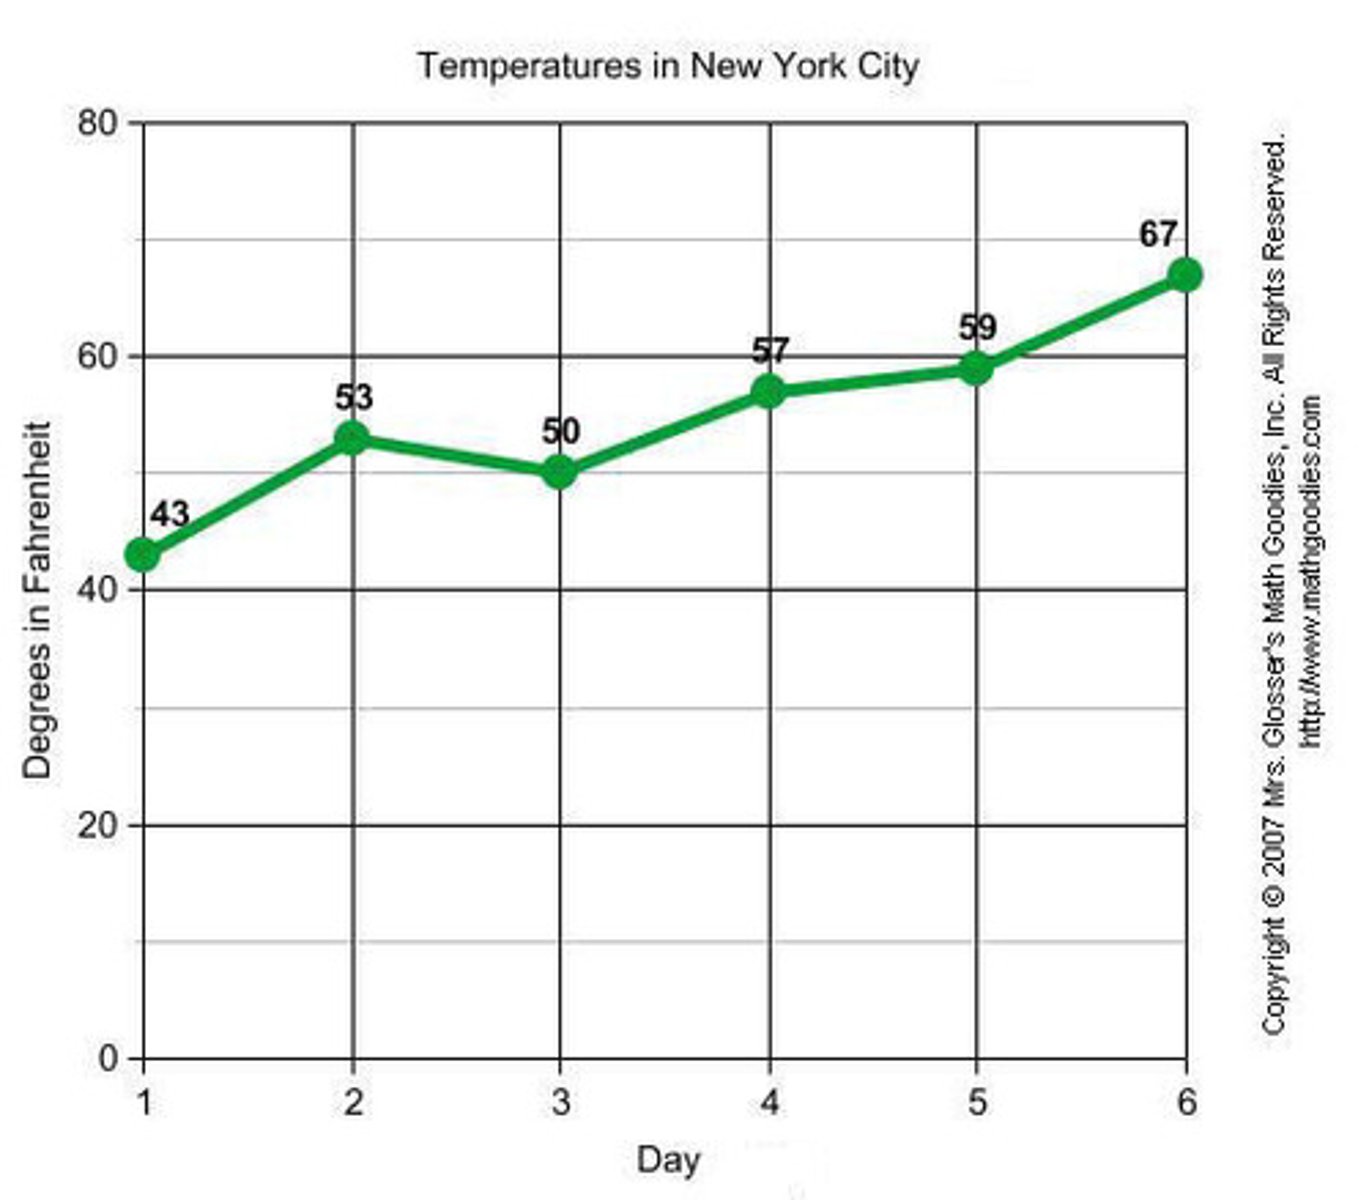
line graph
an axis-type graph in which data points are joined by a line; requires continuous data
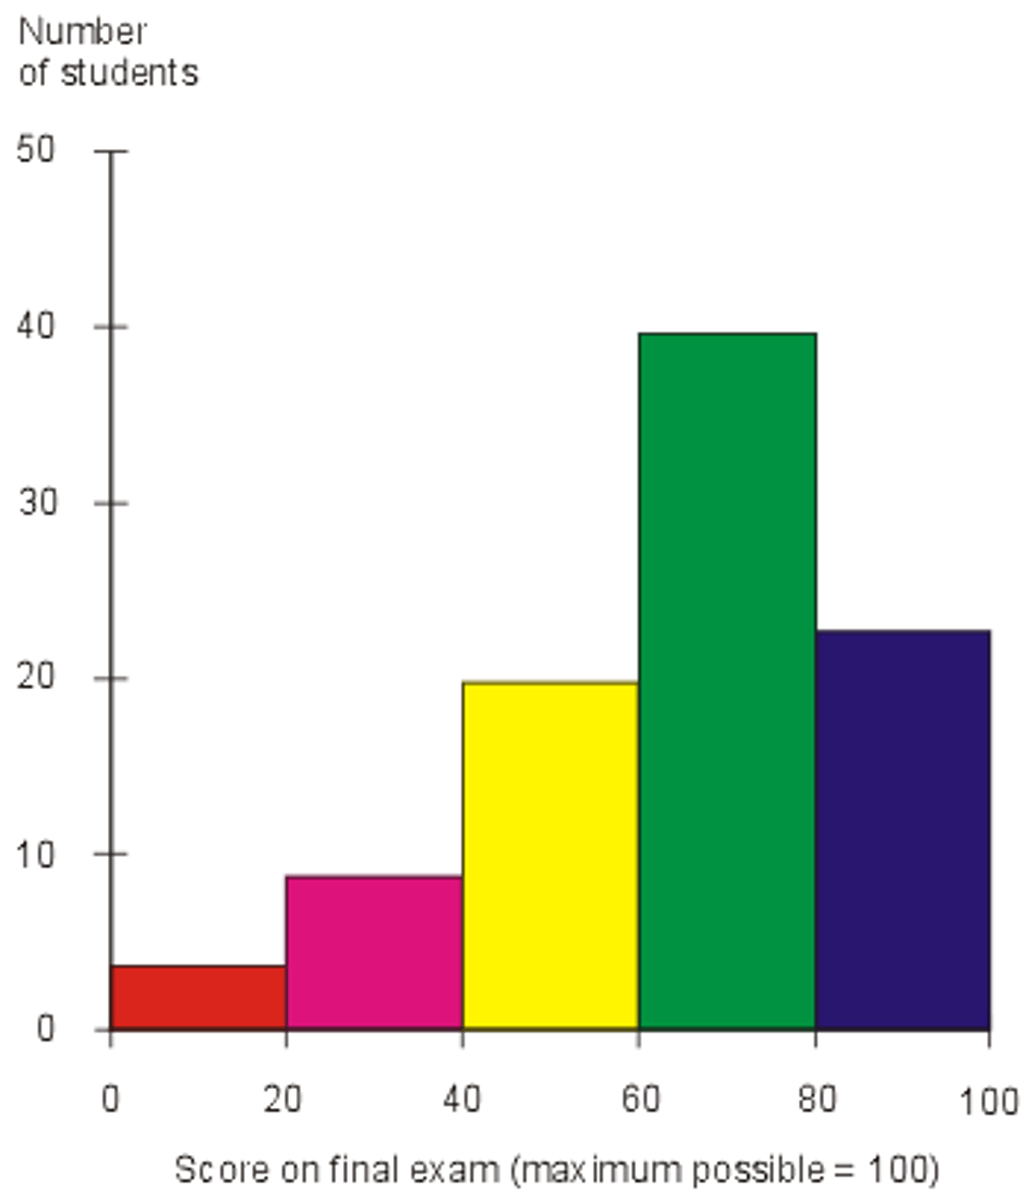
histogram
a graph of vertical bars representing the frequency distribution of a set of data.
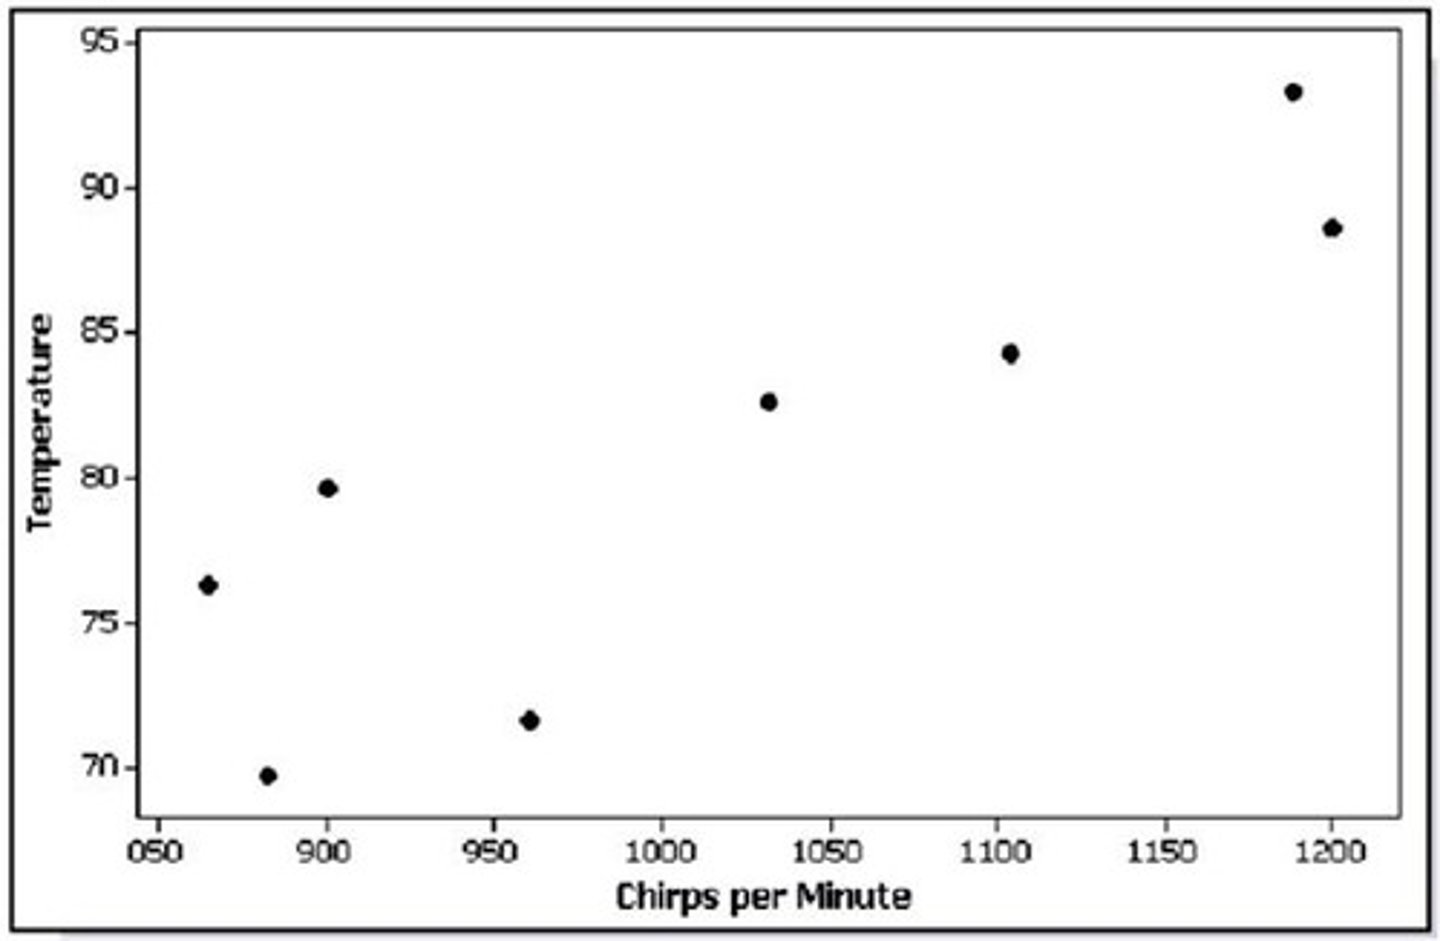
scatter graph
a type of graph on which data is plotten to show how two sets of data are related to each other. A line of best fit is often drawn
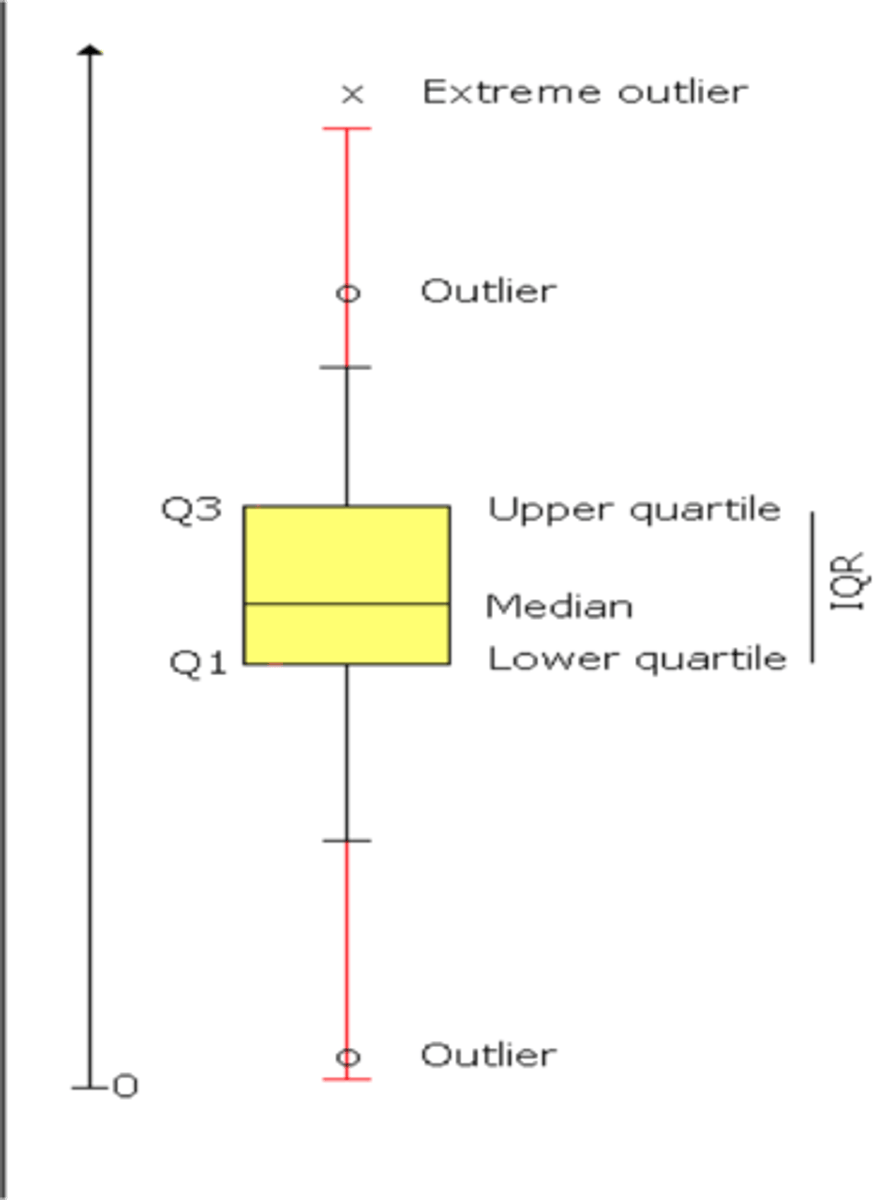
dispersion graph
used to display the main pattern in the distribution of data. e.g. box and whisker plot
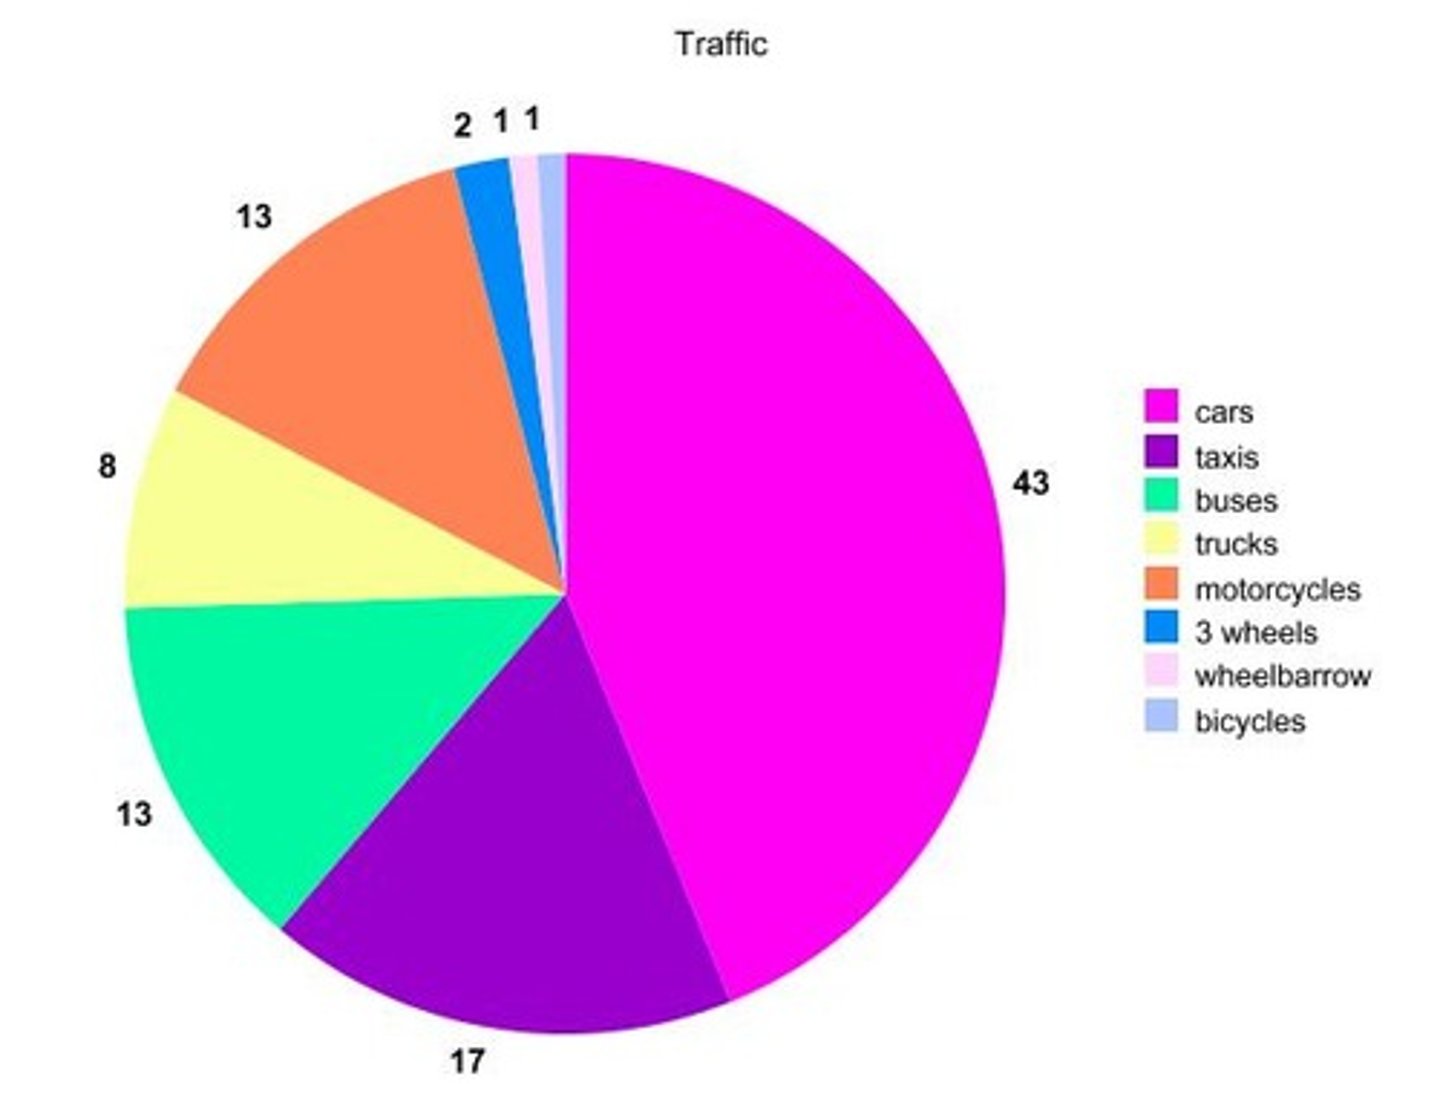
pie chart
a circular data presentation tecnique which shows fractions, percentages, and the proportional size of various parts in relation to the whole
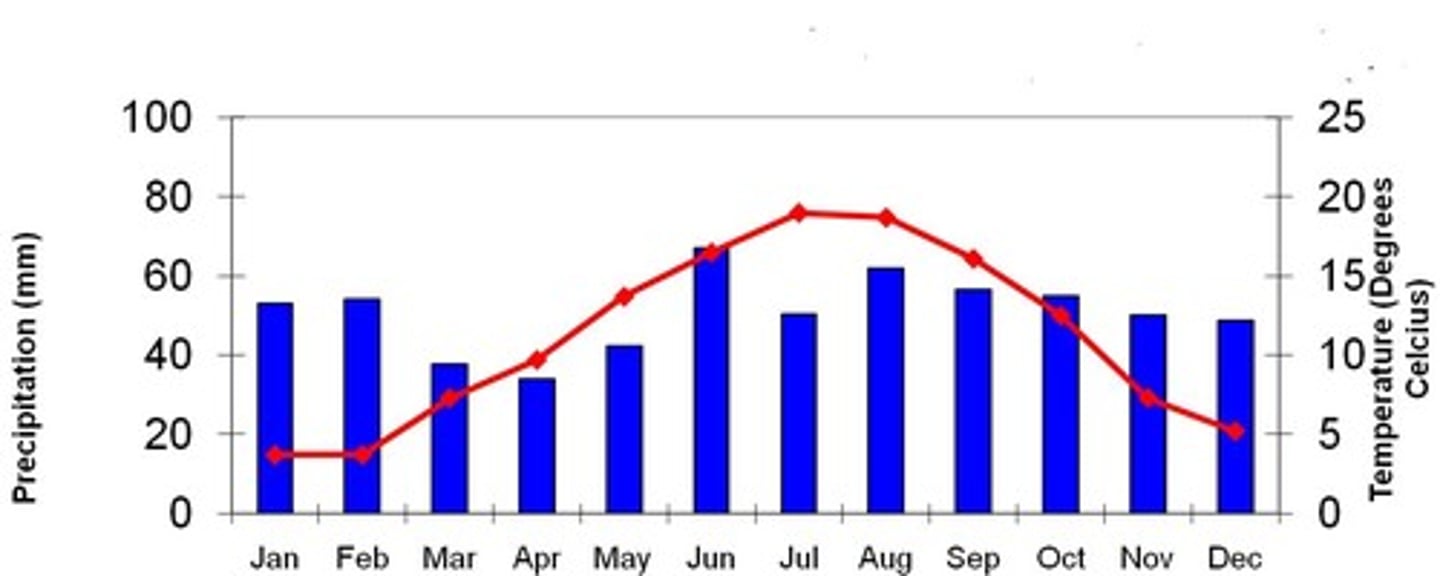
climate graph
a graph showing average total monthly precipitation (bars) and average monthly temperatures (line) for a specific location over a known time period
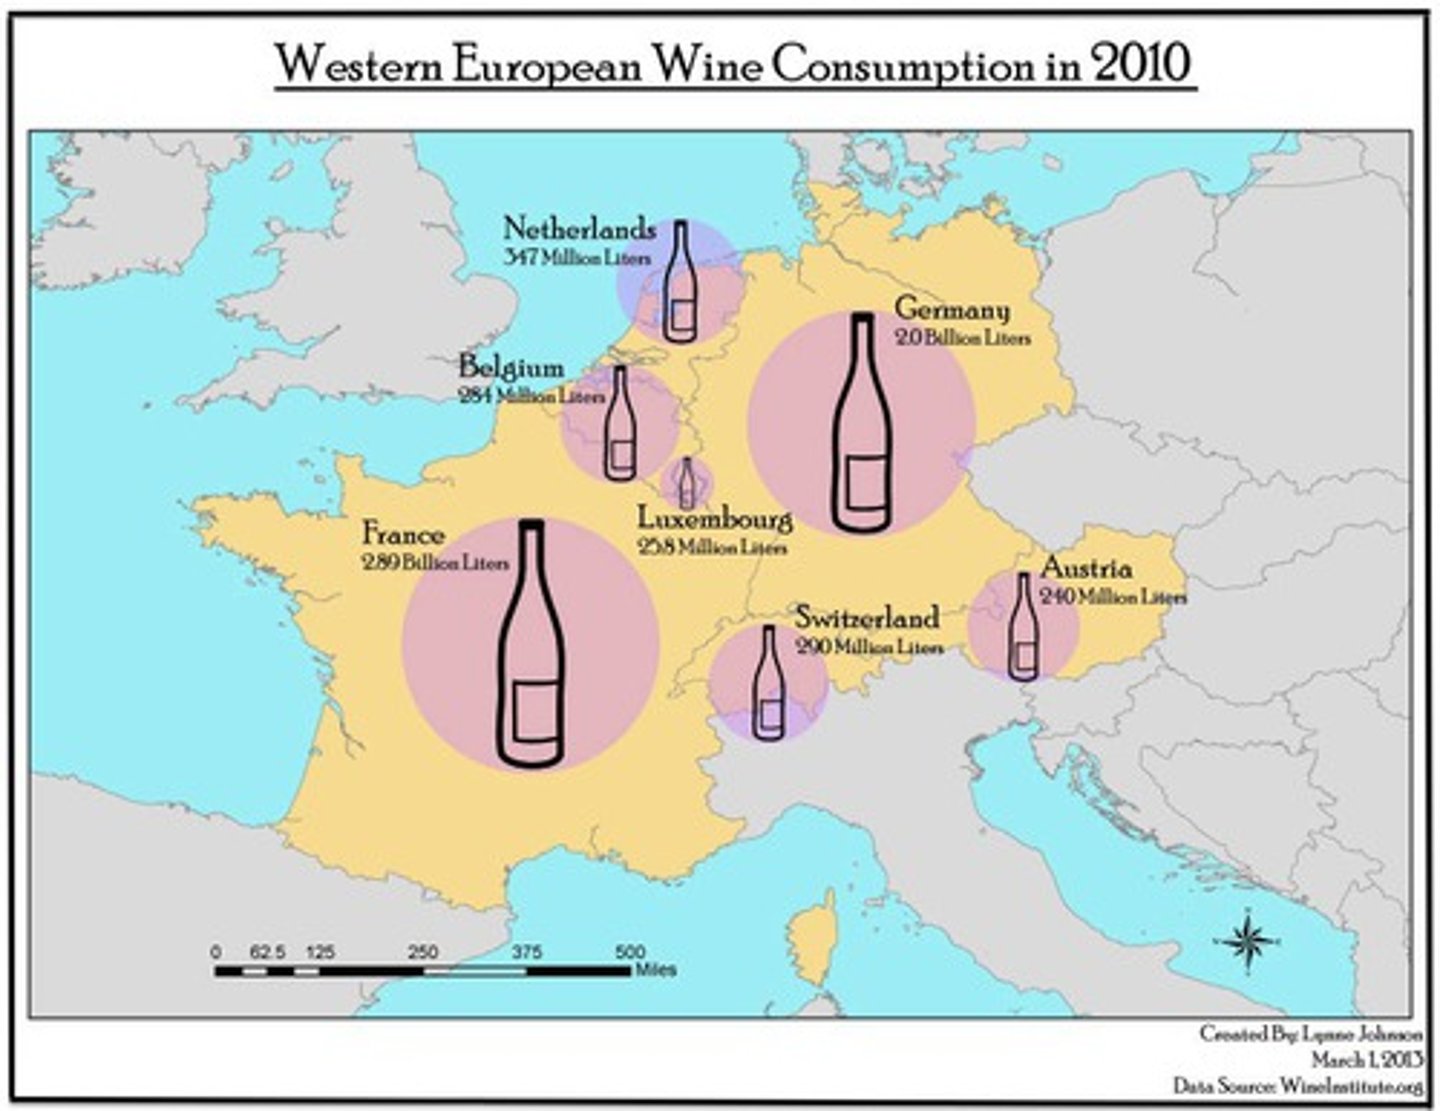
proportional symbol map
a thematic map in which the size of a symbol varies in proportion to the frequency or intensity of the variable being presented.
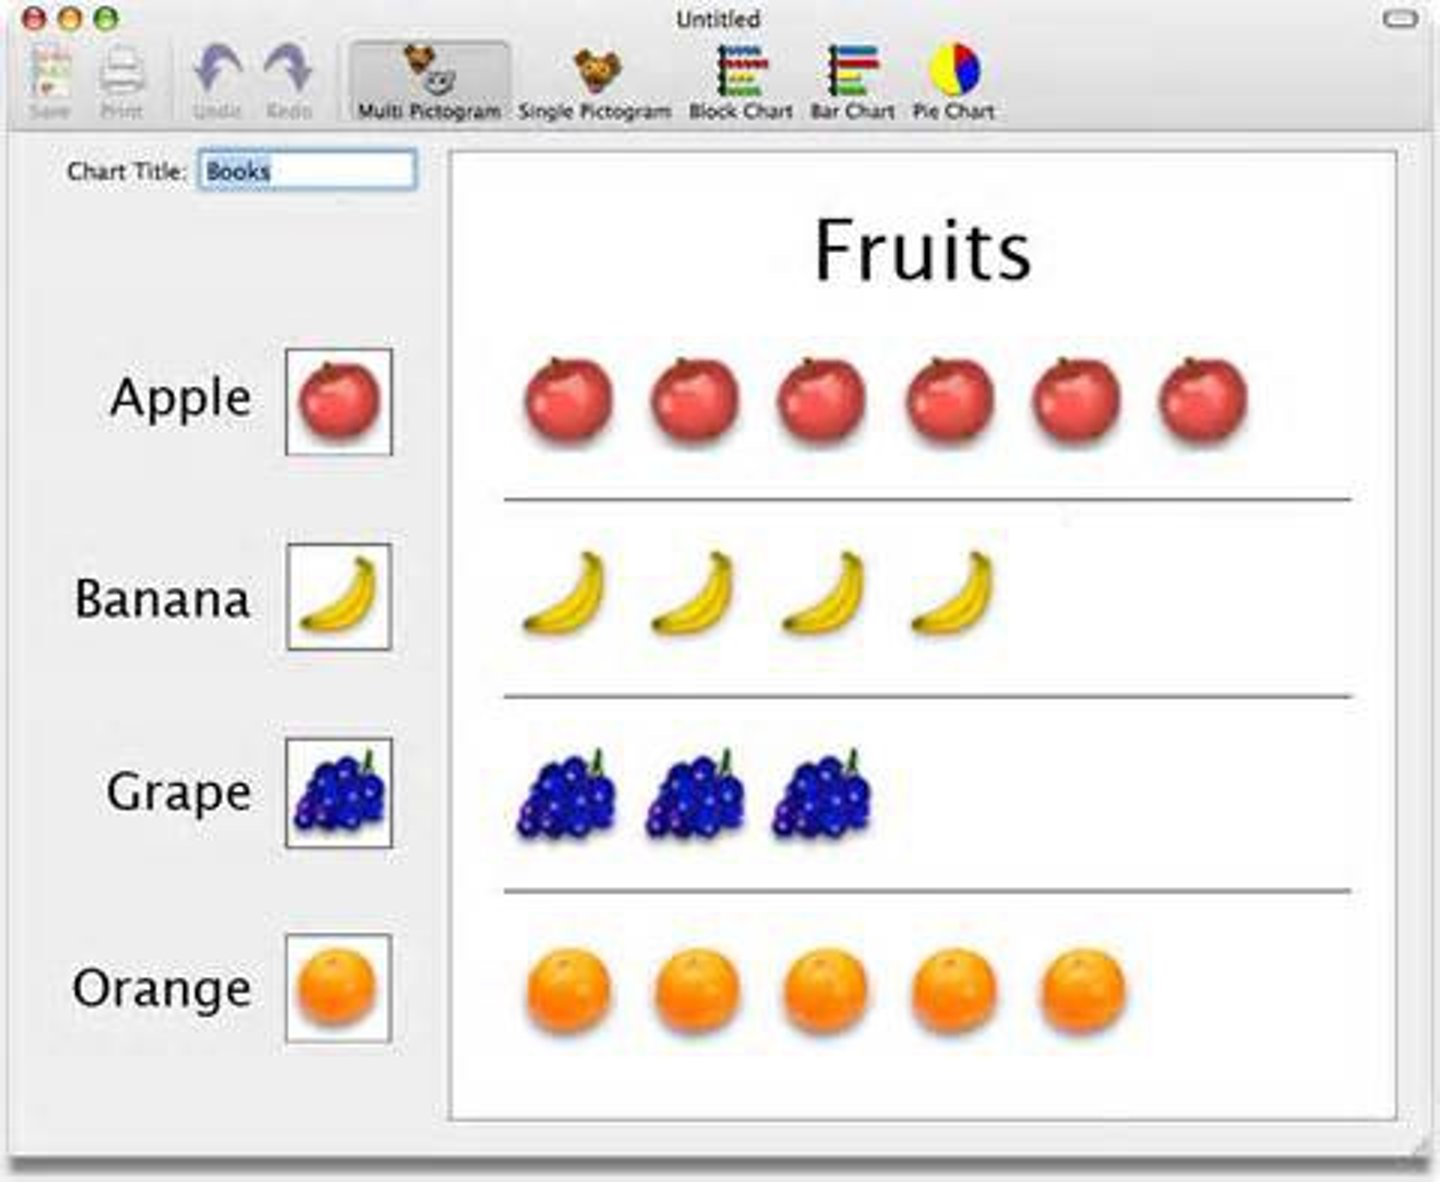
pictogram
a pictorial symbol or sign representing an object or concept
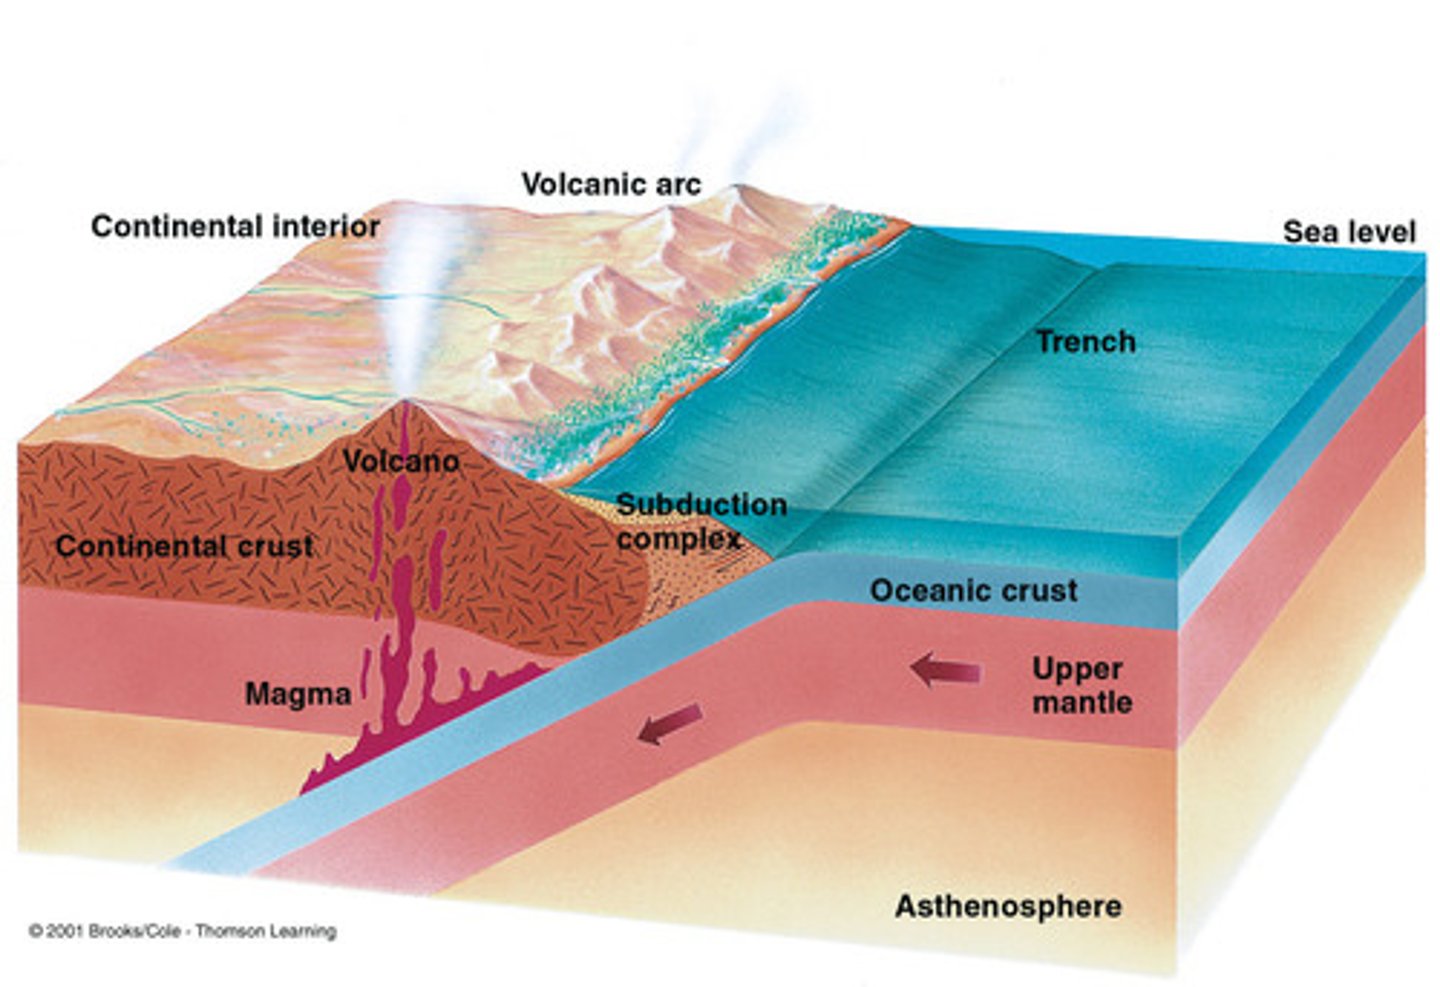
cross-section
a profile of the relief of the land along a specific line drawn across a map
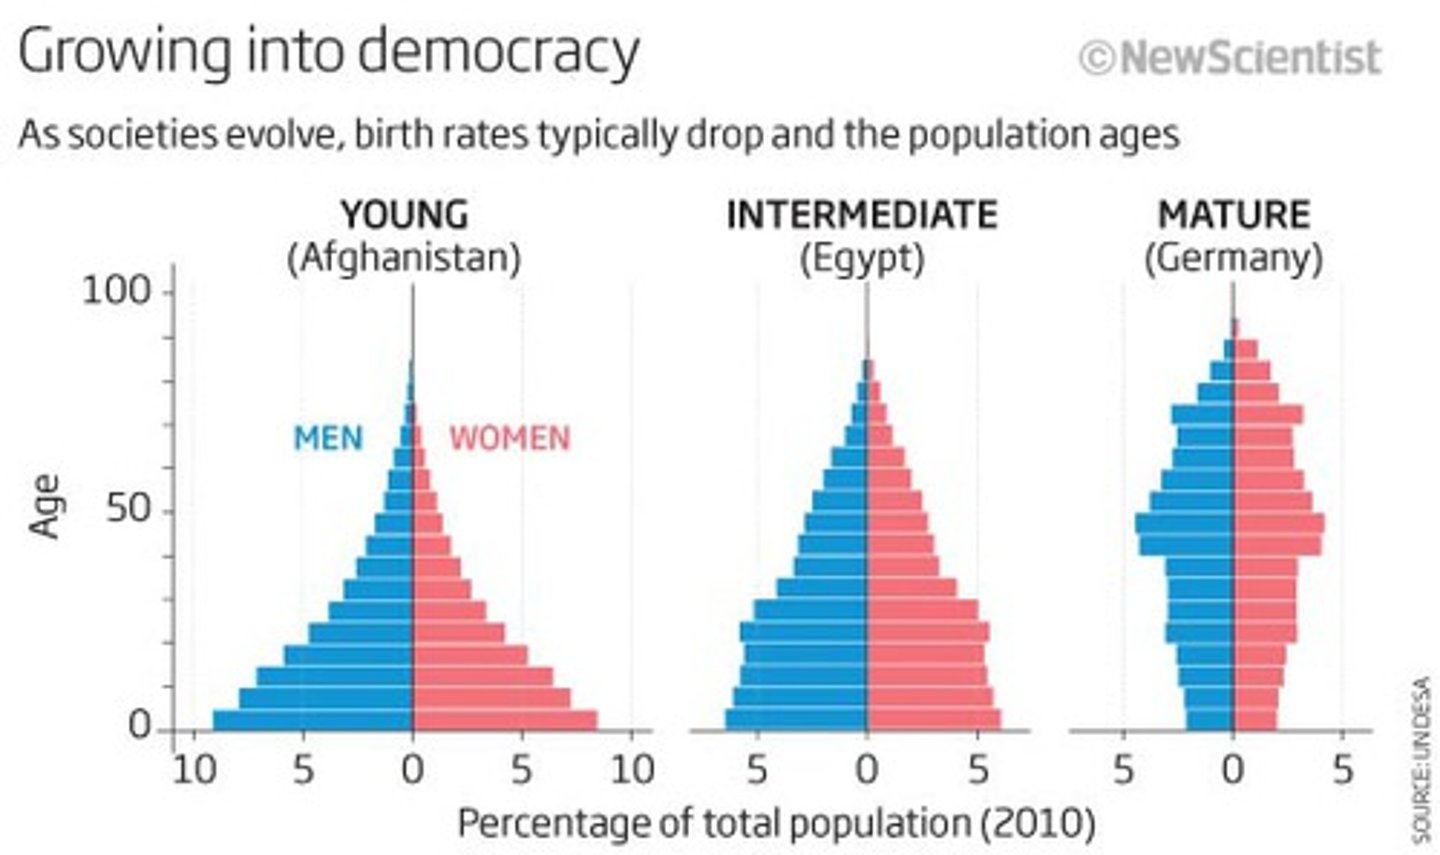
population pyramid
a bar graph representing the distribution of population by age and sex
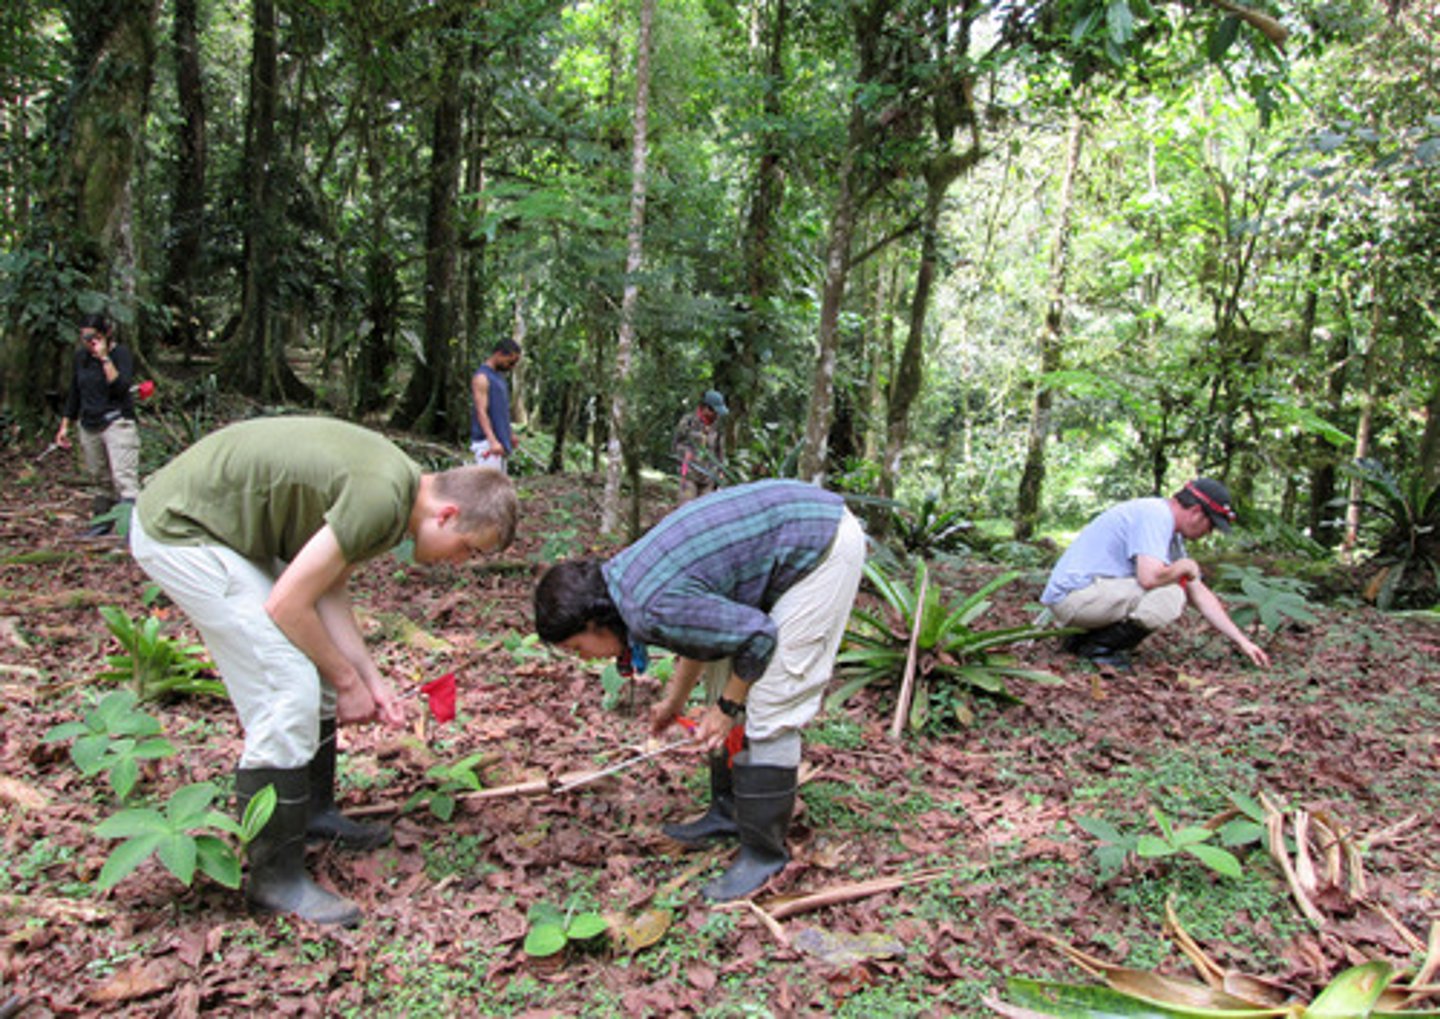
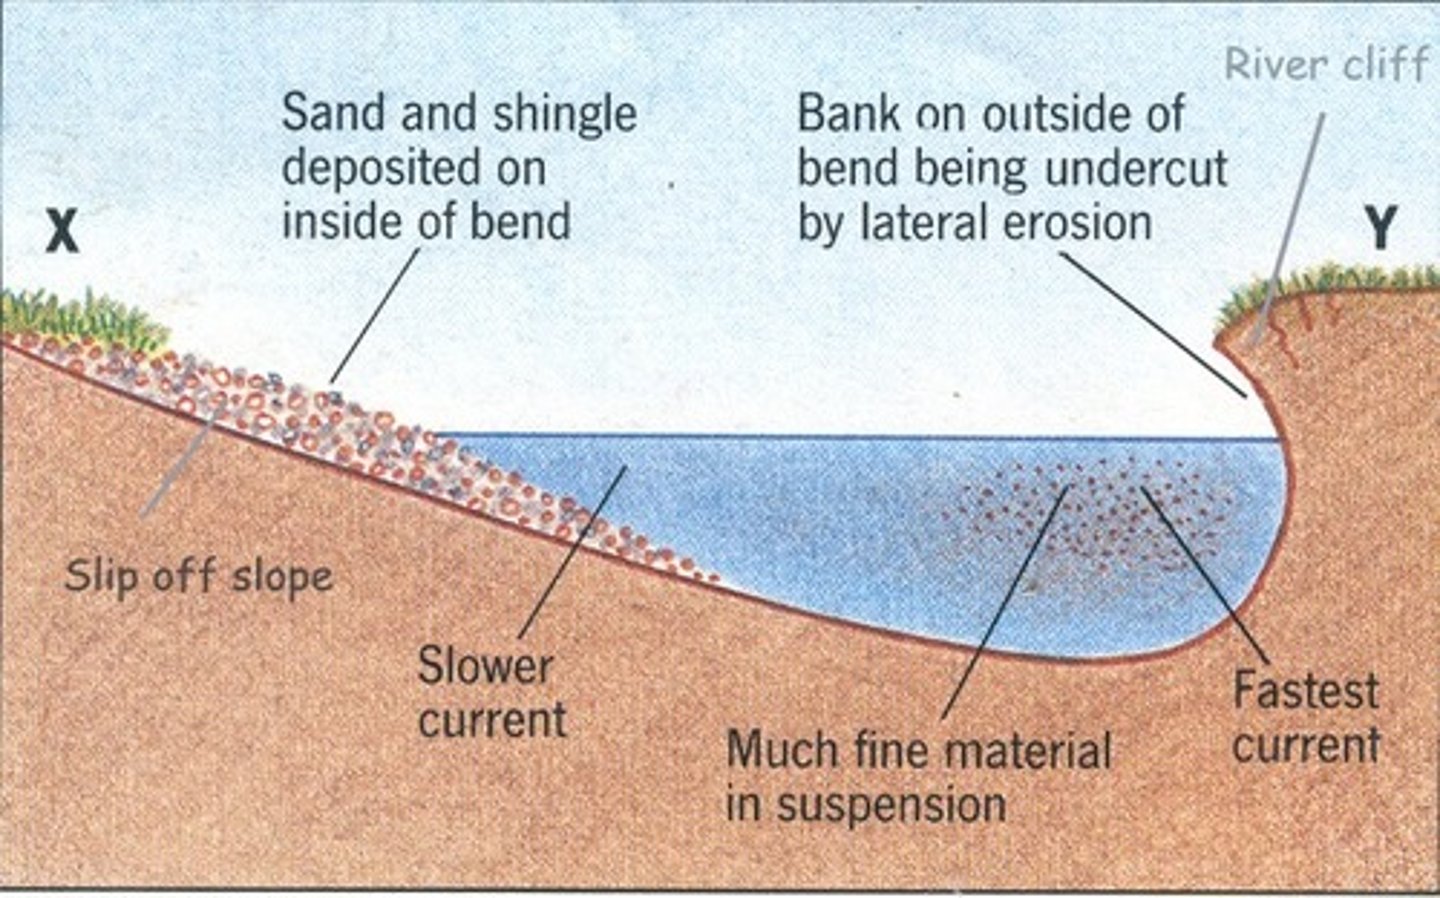
annotated photograph
a data presentation technique in which detailed qualitative or quantitative observations are added to a photograph of a landform, area or object
sketch or diagram
a simple representation of a landscape or landform showing features and observations
continuous data
data where the points are part of a continuous range of values (e.g. height)
discrete data
where data points are isolated and separated by gaps. (e.g. number of cases of flu)
interval data
increase at constant intervals but do not start at true zero (e.g. temperature on °C scale)
binary data
the value of the data has only two options e.g. yes/no
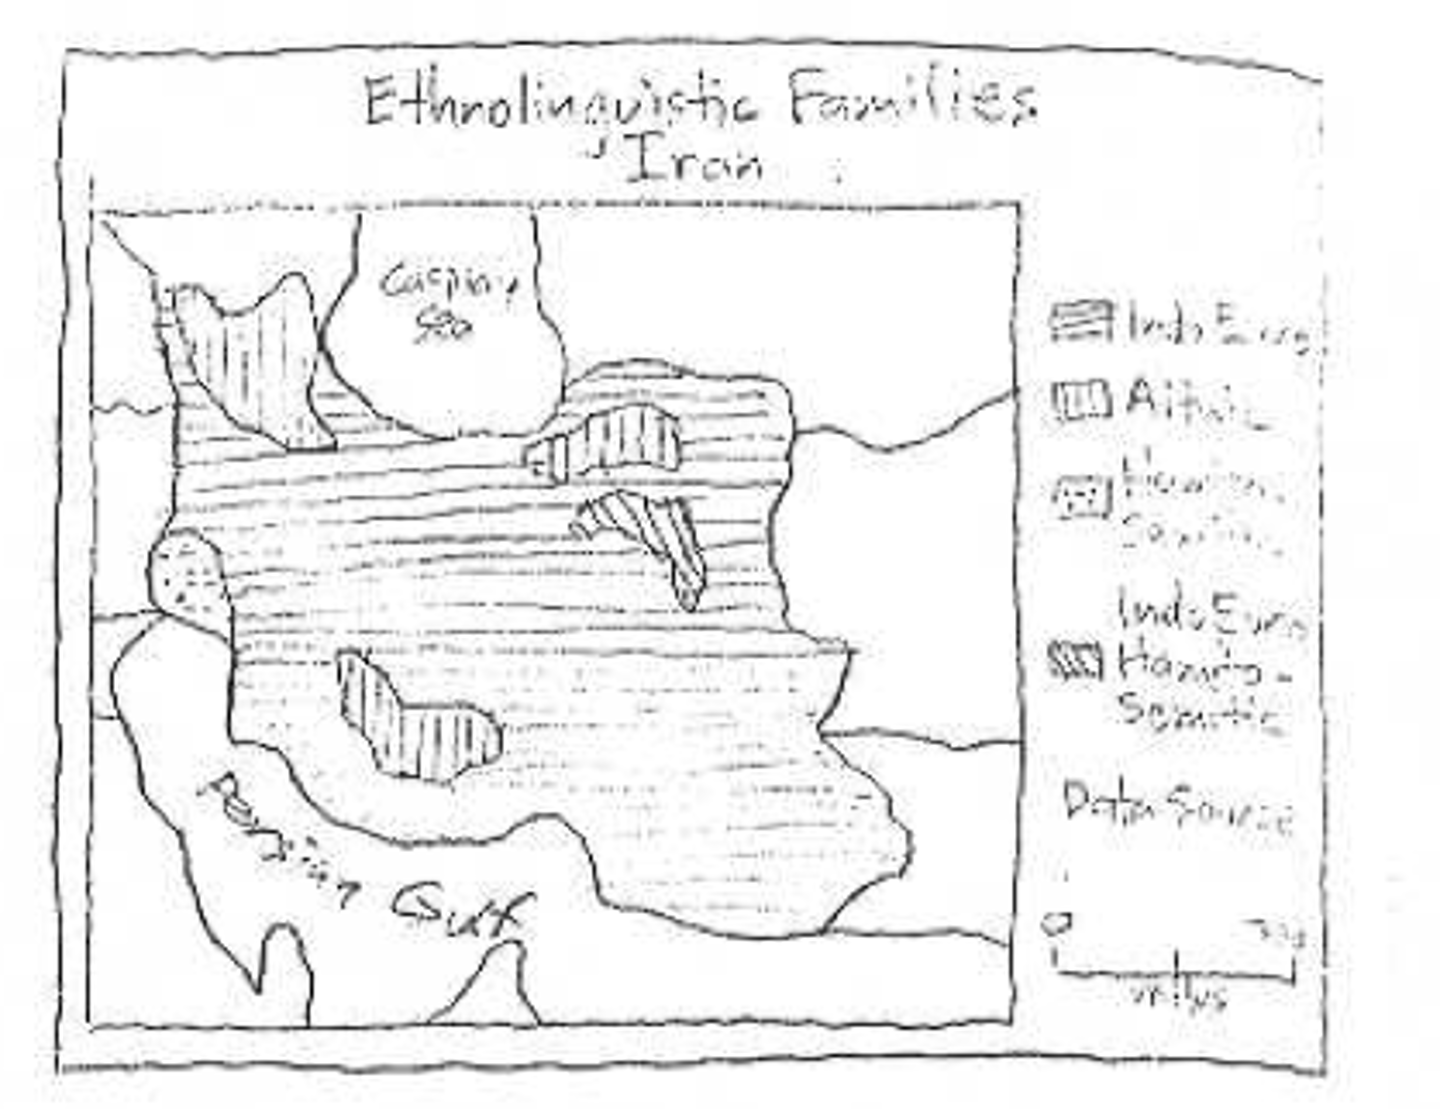
thematic map
a map that shows a particular theme, or topic