4 - Measuring Discrimination and Effect of Policies
1/46
There's no tags or description
Looks like no tags are added yet.
Name | Mastery | Learn | Test | Matching | Spaced |
|---|
No study sessions yet.
47 Terms
What is one simple way you measure discrimination
The difference in mean wages
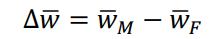
Equation for the difference in mean wages
What is the equation for group 1's earnings function
w₁ = α₁ + β₁s₁
How do you represent the average of a value?
A bar on top
What does α stand for
Raw labour / Base Wage
What does β stand for
Return of schooling on wages
What does s stand for
Schooling
What is the equation for raw wage differential between group 1 and 2
∆w(bar) = w₁(bar) - w₂(bar) = α₁ + β₁s₁(bar) - α₂ - β₂s₂(bar)
Oaxaca-Blinder Decomposition
A technique that decomposes the raw wage differential into a portion related to a difference in skills and a portion attributable to labour market discrimination
What equation do you get from the Oaxaca-Blinder Decomposition
∆w(bar) = (α₁-α₂) + (β₁-β₂)s₂(bar) + β₁(s₁(bar)-s₂(bar))
Which part of the raw wage differential shows wage differences due to discrimination
(α₁-α₂) + (β₁-β₂)s₂(bar)
Whcih part of the raw wage differential shows wage differences due to skills
β₁(s₁(bar)-s₂(bar))
What does (α₁-α₂) show in the wage differential equation
Group 1 are getting more for the same level of schooling
What does (β₁-β₂)s₂(bar) show in the wage differential equation
Group 1 are getting higher returns to schooling
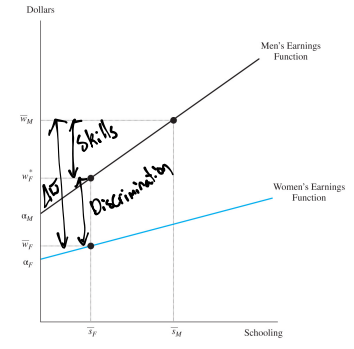
What are the axes on a wage differential diagram
y axis - Dollars
x axis - Schooling
What is plotted on a wage differential diagram
Earnings functions for both groups
How do you show the raw wage gap on the wage differential diagram
The difference between the wages each group get
How can you show which part of the wage gap is due to discrimination on the wage differential diagram
Find the wage a group would get on the other group's curve for the same level of the schooling and the difference between that wage and the actual wage is the difference caused by discrimination
How can you show which part of the wage gap is due to differences in skill on the wage differential diagram
The wage of the non-discriminated-against group would get - The value a discriminated group would get if they were in the other group
Graph for measuring the impact of discrimination on the wage
Does the Oaxaca-Blinder decomposition really measure discrimination?
Depends on whether all dimensions of the skill differences between 2 groups have been measured and controlled for
Why may the Oaxaca-Blinder decomposition measure discrimination incorrectly
Omitted variable bias
Omitted variable bias
Where a statistical model leaves out important variables
Why may omitted variable bias occur with differences in quality of education
Differences in quality of education may be due to gender differences and discrimination so may be endogenous, making them ineffective controls
Who conducted the decomposition of the male-female wage differential
Altonji and Blank (1999)
What did Altonji and Blank (1999) find regarding the raw log wage differentiall
There was a large raw log wage differential even when controlling for differences in education, age, race, region, occupation, and industry and most of this was due to discrimination

What does Holzer and Ihlanfeldt (1998) use to measure the effect of customer discrimination?
They use a difference-in-differences approach, comparing the percentage of newly hired black workers in contact firms with black versus white customer bases, and using non-contact firms as a control group.
What is one common tool used to identify and measure discrimination
Experiments
What do experiments allow researchers to do
Clearly estimate causal effects
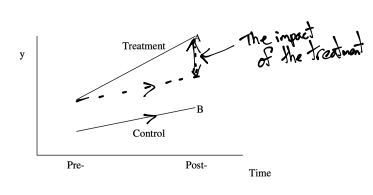
Graph for Difference-in-Differences
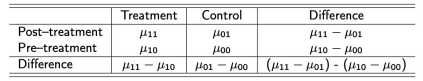
What does µit stand for in the DiD estimator
Mean of the outcome in group i at time t
What are the values of i in the DiD estimator
i = 0 for the control group
i = 1 for the treatment group
What are the values of t in the DiD estimator
t = 0 for pre-treatment period
t = 1 for post-treatment period
Equation for the DiD estimator
(µ₁₁ - µ₀₁) - (µ₁₀ - µ₀₀) = (μ11 - μ10) - (μ01 - μ00)
Difference-in-Differences table
Difference-in-differences estimator
A method which captures the significant differences in outcomes across the treatment and control groups
What is the typical form of a regression model estimated in the DiD estimator

What does Treati stand for
If the individual is in the treatment group it =1, if they are in the control group then =0
What does Postt stand for
=1 in the post-treatment period, =0 in the pre-treatment period
Assumptions of the DiD estimator (2)
Common Trend Assumption, Spillover trend assumption
Common Trend assumption
We expect that trends are common for the treatment and control group
Spillover trend assumption
There is no spillover effect of the treatment on the control group
What results when the DiD assumptions are violated
The DiD estimator is bias
Who used difference-in-difference in their studies (3)
Bennedsen et al. (2019)
Johnson (2011)
Aaronson and Mazumder (2011)
How does Bennedsen et al. (2019) use the difference-in-differences method?
They apply it to study the impact of a law requiring firms to provide gender-disaggregated wage statistics, comparing the wage changes before and after the law implementation.
What law change did Bennedsen et al. (2019) study
UK firms became required to report gender pay gaps starting in 2017
What did Bennedsen et al. (2019) find regarding gender pay gap
That gender pay gap transparency significantly reduces the gender pay gap within firms, suggesting that transparency can be an effective tool in improving gender pay equality in the workplace