Week 4: multiple correlations, shared variance, effect sizes and power
1/20
There's no tags or description
Looks like no tags are added yet.
Name | Mastery | Learn | Test | Matching | Spaced |
|---|
No study sessions yet.
21 Terms
analysing multiple correlations at once
-same as analysing two variables on SPSS → just put more variables into output
degrees of freedom
-still N-2 because we are comparing 2 variables in each correlation
shared variance
-R²
-proportion of variation in scores in one variable that can be explained by the variation in the other variable
-the stronger the relationship between variables, the more variance they share
-the leftover percentage from the shared variance is the variation that can be explained by other factors
shared variance equation
R² = r x r
-squaring the correlation coefficient
effect sizes conceptual introduction
-p value gives us an indication of statistical significance
-but is the difference found between the groups also relevant or psychologically significant?
-effect sizes give an indication of this
statistical significance (measure of effect)
-probability can show when there is a difference that is probably not due to chance
-shows existence of the effect
effect size (measure of effect)
-a standardised measure of how important the difference/effect is that you found in the sample
-shows magnitude of the effect
why is it useful to have an effect size?
-avoids problems with very big sample sizes
when N is very big, it is almost impossible to not find a statistically significant effect
but this doesn’t always mean that it is ‘important’
-can interpret the magnitude of an effect, independent of the scale that was used
comparing studies that use different measures
often used in meta-analyses or review papers
correlations (different measures of effect size)
-r value is the effect size
t-tests (different measures of effect size)
-Cohen’s d
-both independent and paired t-tests
-can be given as part of the output from SPSS
Cohen’s d
-represents the standardised mean difference (between groups or between conditions)
-specifically, is a measure of size of difference between two means
-the larger the difference, the larger the Cohen’s d → the larger the effect of the IV on the DV
interpretation of Cohen’s d value
less than 0.20 → trivial effect
0.20 - 0.50 → small effect
0.50 - 0.80 → medium effect
more than 0.80 → large effect
-larger value indicates more important/pronounced effect
-can be a negative value and can be larger than 1
effect size independent t-test
-to calculate Cohen’s d for independent t-tests:
Cohen’s d = (mean of group 2 - mean of group 1) / SD pooled
equation for SD pooled
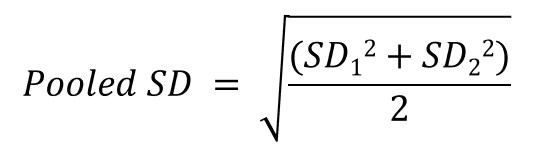
effect size paired t-test
-to calculate Cohen’s d for paired t-test:
Cohen’s d = (mean of group 2) - (mean of group 1) / overall SD
power conceptual overview
-null hypothesis testing is related to probability of making a type 1 error → pays little attention to chance of making type 2 error
-the concept of power shifts the focus to type 2 error
power - technical definition
-the probability of correctly rejecting a false H₀
-mathematically works out to 1-β
(β = type 2 error = probability of accepting false H₀)
power - simplified definition
-the degree to which we can detect intervention effects
-emphasis on researcher’s ability to correctly find effects that exist, rather than likelihood of incorrectly finding effects that don’t exist
small effect (power)
-for a small effect → we need more people (larger sample size) to have sufficient ‘power’ to find it
big effect (power)
-for a big effect → we need fewer people (smaller sample size) to have sufficient ‘power’ to find it
good level of power
β = 0.80