EXAM 2 (3) Population growth
1/21
There's no tags or description
Looks like no tags are added yet.
Name | Mastery | Learn | Test | Matching | Spaced |
|---|
No study sessions yet.
22 Terms
life tables
summarize proababilities that an age class, or cohort will survive and reproduce in any given year over the individuals lifetime
Cohort
a group of individuals that are all born at the same time
life tables: survivorship (ix)
the proportion of offspring that are still alive at each age
life table variable (x)
year or age class
Life tables variable (N)
the number of cohorts remaining in the population
life tables variable (Nx)
number remaining in particular age class
life table variable (mx)
fecundity
life table variable (dx)
death rate of original cohort that dies each year
Fecundity (mx) def
the number of offspring an individual can have in its lifetime
typically refers to the number of FEMALE offspring a female can have in her lifetime
Age specific fecundity
average number of female offspring produced by a female in each age class
life table for Zootoca vivipara
as survivorship declines fecundity increases
Net reproductive rate
indicates whether the population is increasing or decreasing
if the sum is <1.0 the population is getting smaller
=1 its staying the same
>the population is growing
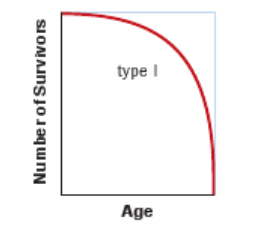
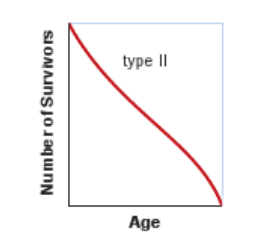
survivorship curves
LOG of the number of survivors vs age
type I survivorship curve
A type I survivorship curve depicts a population with low mortality early in life and high mortality late in life.
Examples include humans, elephants, and whales
type 2 survivorship curve
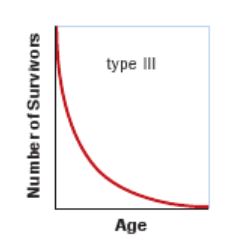
type 3 survivorship curve
A type III survivorship curve depicts a population with high mortality early in life and high survival later in life.
This is a common pattern in many species of insects and in plants such as dandelions and oak trees that produce hundreds or thousands of seeds
why cant we have high survival and high fecundity
restricted amount of time and energy
limites resources
life history tradeoffs
shaped by natural selection: to maximize an organisms
general pattern with high fecundity
high fecundity, fast growth rate, sexual maturity at young age, produce many offspring, lower survivorship
general pattern for high survivorship
slow growth rate, invest in resources in traits that allow them to compete with other individuals, lower fecundity
To calculate the number of individuals that survive to the next age class
we multiply the number of individuals in an age class by the annual survival rate of that age class (Nx) x (Sx)
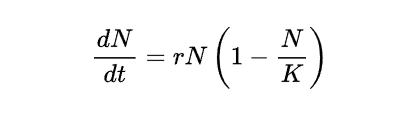
As the size of the population, N, approaches the carrying capacity of the environment, K, the ratio N/K approaches 1 and the term in parentheses approaches zero.
At this point, the population’s growth rate is zero, which means that the population has achieved a stable equilibrium.