HCA 586 Lecture 2
 Call Kai
 Learn
Learn Practice Test
 Spaced Repetition
 Match
Match Flashcards
 Knowt Play
1/25

There's no tags or description
Looks like no tags are added yet.
Name | Mastery | Learn | Test | Matching | Spaced | Call with Kai | Chat |
|---|
No analytics yet
Send a link to your students to track their progress
26 Terms
price serves 3 important functions
it provides useful info to both consumers and producers regarding the relative value of a good or service in the market
it serves as a rationing device which distributes the goods and services to consumers who value them most
it acts as an incentive mechanism
it encourages more resources to markets with natural shortages, though it increases
it encourages fewer resources to markets with natural surpluses through —- decreases
the law of supply
a direct relationship exists between the price of a good and the quantity supplied of that good
as the price of the good increases, sellers are willing to supply more
all other things remaining constant, the higher the price of a good or service, the higher the supply
this occurs because producers want to produce more of that good or service at the higher price to increase profits. Conversely, the lower the price, the lower the supply
analysis of supply curve (upward sloping)
identifies what the seller is willing to supply at different prices
change in quantity supplied
direct relationship (price and quantity move in the same direction)
as the price of the good increases, sellers are willing to supply more of the good
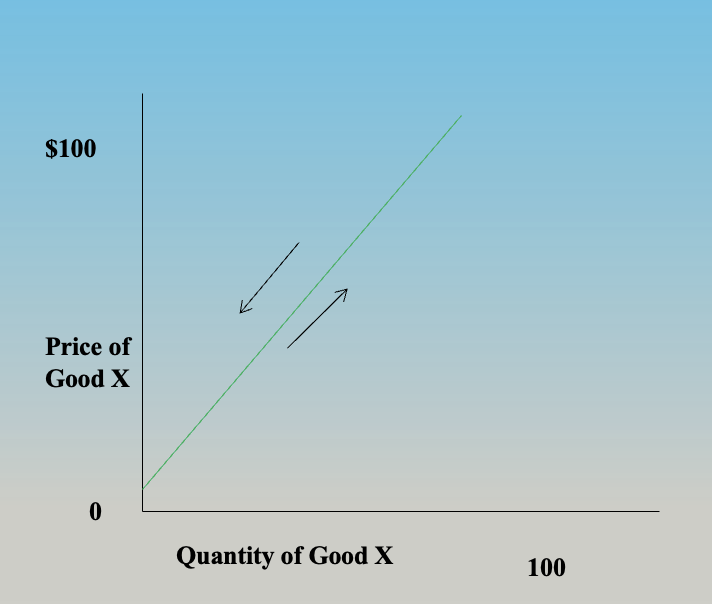
supply curve shifts
change in supply
at a constant price (shift left): sellers supply less than did before
shift right: sellers supply more than before
associated with exogenous events. Ceteris Paribus does not hold
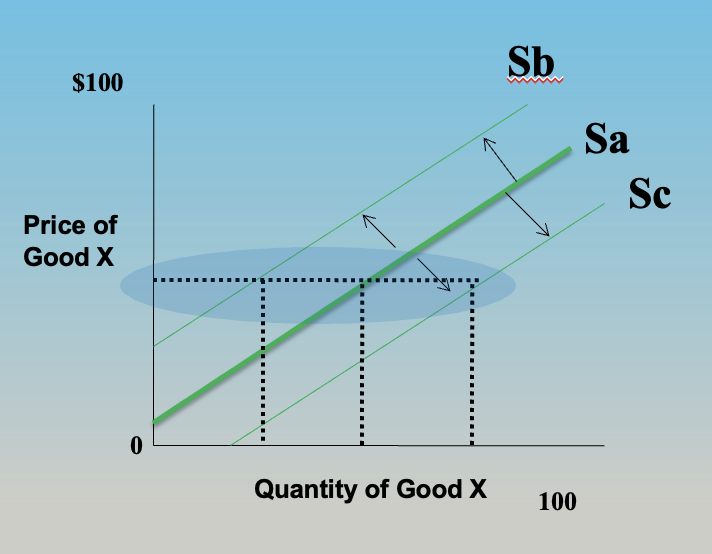
supply curve shift left
at all possible prices you have a decrease in supply
at the same price, you have a decrease in supply
ex. the cost/availability of hospital services taking into account the effects of a nursing shortage
supply curve shift right
at all possible prices you have an increase in supply
at a constant price, suppliers are wiling to supply more
ex. federal policy allows more international nurses to work in the US
factors associated with a shift in the supply curve
changes in the prices of other goods: the change in the price of a good related in production
ex. lab services and physician services
taxes on goods/services: increase in taxes leads to a shift to the left. A decrease in taxes leads to a shift to the left
effects of labor: an increase in supply of labor leads to a shift to the right, a decrease in labor leads to a shift to the left
weather/major occurrences: good weather/other beneficial supply factors leads to a. shift to the right, bad weather/cataclysmic events leads to a shift to the left
changes in the prices of other goods: the change in the price of a good related in production
changes in the price of inputs: inputs are resources such as people, raw materials, energy, info, or finance that are put into a system to obtain a desired output
changes in technology: technology is the collection of techniques, skills, methods, and processes used in the production of goods or services
elasticity
focuses on understanding how demand and supply change in response to changes in prices and incomes. There are several types of elasticity
price elasticity of demand
demand is elastic: if the percent change in quantity demanded is greater than the percentage change in price
demand is inelastic: if the percentage change in quantity demanded is less than the percentage change in price
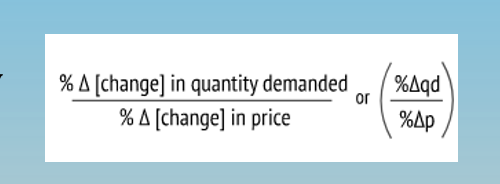
factors impacting price elasticity of demand
the price elasticity of demand is a measure of how much the quantity demanded changes with a change in price
the PED for a given good is determined by one or a combination of the following:
degree of necessity
proportion of the purchaser’s budget consumed by the item
time frame
breadth of definition of a good
brand loyalty
degree of necessity
the greater the necessity for a good, the lower the elasticity
ex. consumers will continue to buy necessary products regardless of the price
luxury products have greater elasticity, however, some goods that initially have a low degree of necessity are habit forming and can become necessities to consumers, such as coffee
proportion of the purchaser’s budget consumed by the item
products that consume a large portion of the purchaser’s budget tend to have greater elasticity
the relatively high cost of such goods will cause consumers to pay attention to the purchase and seek substitutes
in contrast, demand will tend to be inelastic when a good represents only a negligible portion of the budget
essentially higher income individuals are more inelastic to price changes in goods/services
time frame
for non-durable goods, elasticity tends to be greater over the long-run than the short-run
in the short term it may be difficult for consumers to find substitutes in response to a price change, but, over a longer time period, consumers can adjust their behavior
breadth of definition of a good/service
the broader the definition of a good, the lower the elasticity
brand loyalty
an attachment to a certain brand (either out of tradition or because of proprietary barriers) can override sensitivity to price changes, resulting in more inelastic demand
price elasticity of supply
how the quantity supplied responds to changes in price
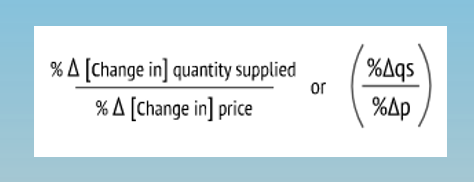
supply is elastic
if the percent change in quantity supplied is greater than the percentage change in price
supply is inelastic
if the percentage change in quantity supplied is less than the percentage change in price
factors impacting supply elasticity
the availability of raw materials: greater availability leads to an increased ability to supply
the availability of labor: if labor is in short supply elasticity of supply will be lower
the extend to which labor can be reduced: if labor is heavily unionized, in short supply or there is strict legislation regarding firing of labor, it might not be possible to reduce supply in response to a price drop
whether finished products or raw materials are available: greater availability means a faster response to changes in market price
whether the firm has spare capacity: with spare capacity, production can be quickly increased as a response to higher prices
the timeframe being considered: supply will be much more elastic in the long run compared with the short run
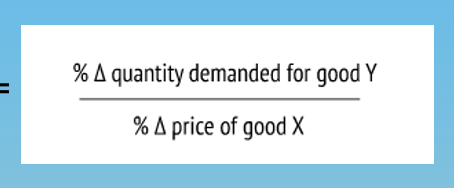
cross elasticity of demand (XED)
measures the effect of a change in the price of one good on consumer demand for another good
the significance:
given that most firms sell goods and services which have both complements and substitutes it is important to analyze the presence of cross elasticities
complements are goods that are consumed together. substitutes are goods where you can consume one in place of the other
complementary goods: if the increase in price of a good/service A decreases the demand for good/service B
data on cross elasticities indicates the relative strength or closeness of substitutes as well as the significance of complements
equilibrium analysis
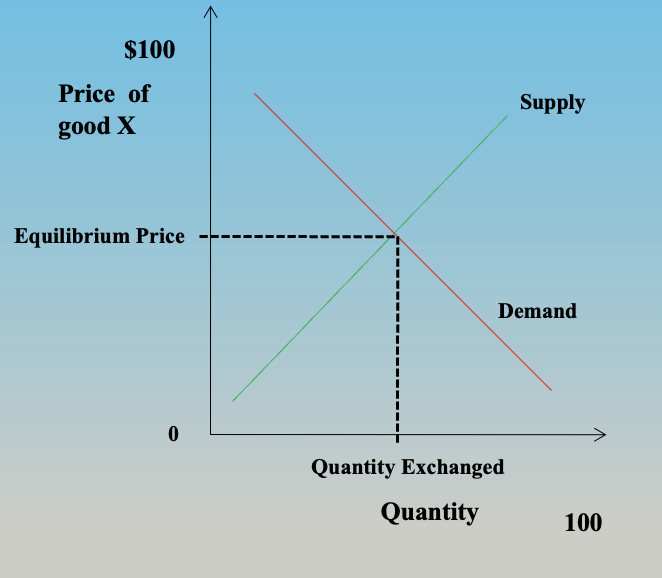
when the demand for good X equals the supply of good X, the market for good X is said to be in equilibrium
demand and supply curves
the meeting point is known as market equilibrium (or market clearing price level)
market equilibrium
the price at which the customer is willing to pay for the good and the price at which the seller is willing to sell the good
markets are able to efficiently allocate scarce resources by establishing this meeting point or price level
consumer surplus
area under the curve and above the equilibrium price
aggregate difference between the price consumers are willing to pay and what they actually had to pay
the value received but not paid for
producer surplus
area under the curve and below the equilibrium price
aggregate difference between the minimum price at which producers are willing to sell/produce the good/service and the price that they actually receive
total surplus
consumer surplus + producer surplus