Quiz 1 Biosats
 Call Kai
 Learn
Learn Practice Test
 Spaced Repetition
 Match
Match Flashcards
 Knowt Play
1/109

There's no tags or description
Looks like no tags are added yet.
Name | Mastery | Learn | Test | Matching | Spaced | Call with Kai | Chat |
|---|
No analytics yet
Send a link to your students to track their progress
110 Terms
What is statistics?
Methods for organizing/summarizing data and drawing conclusions based on data.
What is a population?
The entire collection of objects or individuals of interest.
What is a sample?
A subset of the population selected in a prescribed manner
What is a census?
Obtaining the desired information from every object in the population.
Why is a census often infeasible?
Constraints such as time, money, and other scarce resources.
What is a variable?
Any characteristic whose value may change from one object to another in the population.
How are variables typically denoted?
By lowercase letters, such as x, y, and z.
What is a categorical variable?
A variable whose values represent categories or qualities rather than numerical measurements.
Give an example of categorical data.
Marital status or malfunction type.
What is numerical data?
Data represented by numbers that measure or count something.
Give examples of numerical data.
Age, diameter, pulse rate, or operating time.
What is univariate data?
Data from observations of one variable.
What is bivariate data?
Data from observations of two variables.
What is multivariate data?
Data from observations of more than two variables.
What is the relationship between bivariate and multivariate data?
Bivariate data is a special case of multivariate data
What is descriptive statistics?
Statistics used to summarize and describe important features of data.
What are examples of descriptive graphical methods?
Histograms, boxplots, and scatter plots.
What is inferential statistics?
Statistics used to test hypotheses or assess whether data can be generalized to a broader population.
What is a major goal of inferential statistics?
Making predictions, conclusions, or decisions about a broader population.
If you calculate the mean battery life of 25 tested pumps, is this descriptive or inferential?
Descriptive.
If you use 25 pumps to estimate the mean battery life of all pumps in the production lot, is this descriptive or inferential?
Inferential
What is the target population?
The population to which the conclusions are intended to apply.
What is the sampled population?
The population from which the actual observations are obtained.
Why is proper data collection important?
Poorly collected data can make statistical analysis misleading and prevent confident conclusions.
Why is random sampling useful?
It helps obtain a sample that better represents the target population and allows probability-based methods to be used.
Why is random assignment used in an experiment?
To help protect against bias when comparing treatment groups.
What is a treatment group?
The group receiving the treatment/intervention being studied.
What is a control group?
The comparison group that does not receive the experimental treatment or receives a control/placebo.
What does it mean for a study to be blinded?
A person involved in the study does not know which treatment a participant received.
What symbol represents sample size?
n
What does n represent?
The number of observations in a single sample.
If a sample contains 18 specimens, what is n?
n = 18
If two samples are being compared, what notation can be used?
m and n, or n₁ and n₂.
What are stem-and-leaf displays useful for?
Finding a typical value, viewing spread, identifying gaps, assessing symmetry, finding peaks, and identifying possible outliers.
In a stem-and-leaf plot of exam scores, what is the stem of 83?
8
What is the leaf of 83?
3
If the tens digit is used as the stem, what is the stem and leaf for 58?
Stem = 5, leaf = 8.
What does a stem-and-leaf display preserve that a histogram may not?
The individual data values.
What is a dotplot?
A summary of small-set numerical data where each observation is represented by a dot above its location on a horizontal scale.
What happens when a value occurs more than once in a dotplot?
A dot is created for each occurrence, with dots stacked vertically.
What can a dotplot show?
Location, spread, extremes, and gaps.
What is a discrete variable?
A variable whose possible values can be counted or listed.
What is a continuous variable?
A variable whose possible values consist of an entire interval on the number line.
Is the number of rejected parts in a batch discrete or continuous?
Discrete.
Is serum sodium concentration discrete or continuous?
Continuous.
Is the number of falls detected in a week discrete or continuous?
Discrete.
Is catheter diameter continuous or discrete?
Continuous.
What is frequency?
The number of times a particular value occurs.
What is relative frequency?
The fraction of times a particular value occurs.
How do you calculate relative frequency?
Relative Frequency= Frequency / Total Number of Observations
If 200 students are observed and 70 take 3 courses, what is the frequency for x = 3?
70
What is the relative frequency for x = 3?
70/200=0.35
What determines the height of a histogram bar?
The frequency or relative frequency, depending on how the histogram is constructed.
What is a unimodal distribution?
A distribution with one clear peak.
What is a bimodal distribution?
A distribution with two distinct peaks.
What does "multimodal" mean?
A distribution with two or more different peaks.
What is a symmetric histogram?
One where the left half is approximately a mirror image of the right half.
What is positive skew?
The right/upper tail stretches farther than the left/lower tail.
What is negative skew?
The left/lower tail stretches farther than the right/upper tail.
Which direction does the tail point in a positively skewed distribution?
Right.
Which direction does the tail point in a negatively skewed distribution?
Left.
What are measures of location?
Numbers that characterize a data set and convey important features.
What are the two major measures of location in these notes?
Mean and median.
What is the mean?
The arithmetic average of the observations.
What is the formula for the sample mean?
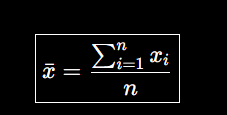
What does the mean represent conceptually?
The balance point/fulcrum of the data on a number line.
What is the median?
The middle value when the data are ordered from smallest to largest.
How do you find the median when n is odd?
Take the value in position
(n+1)/2
How do you find the median when n is even?
average the values in positions

Which measure is more affected by extreme values?
The mean.
Why can the median be better for skewed data?
The median is less affected by extreme values/outliers.
What happens to the mean when a very large outlier is added?
The mean is generally pulled toward the outlier.
In positively skewed data, would you generally expect the mean to be greater or less than the median?
Greater than the median.
What does variability describe?
How much the observations spread out or differ from one another.
What is the range?
The difference between the largest and smallest observations.
What is the formula for range?
range = maximum - minimum
What is a deviation from the mean?
xi-x
What does a positive deviation mean?
The observation is larger than the mean.
What does a negative deviation mean?
The observation is smaller than the mean.
What does a small deviation magnitude indicate?
The observation is close to the mean, indicating less variability.
What is the sample variance formula?

What is Sxx?
The sum of squared deviations from the mean.
How can sample variance be written using Sxx?

What is the sample standard deviation formula?

What does a larger standard deviation indicate?
Greater variability/spread around the mean.
What does a boxplot summarize?
Center, spread, skewness/deviations, and possible outliers.
What are the five values in a five-number summary?
Minimum
Q1
Median/Q2
Q3
Maximum
What is Q1?
The first quartile; approximately 25% of the data are below it.
What is Q2?
the median
What is Q3?
The third quartile; approximately 75% of the data are below it.
What percentage of the data lies between Q1 and Q3?
50%
What is the interquartile range (IQR)?
IQR=Q3-Q1
What does the IQR represent?
The spread/range of the middle 50% of the data.
What are whiskers in a boxplot?
Lines extending from the box toward the smallest and largest observations.
What can isolated points outside the boxplot indicate?
Potential outliers.
What does a wider box indicate?
Greater variability in the middle 50%.
What does a narrow box indicate?
Less variability in the middle 50%.
What might a long upper whisker suggest?
Positive/right skewness
What might isolated high values suggest?
Potential high outliers
In the aspirin example, why were subjects randomly assigned?
To protect against bias and allow probability-based methods to analyze the data.