Lecture 9: Correlation
 Call Kai
 Learn
Learn Practice Test
 Spaced Repetition
 Match
Match Flashcards
 Knowt Play
1/22

There's no tags or description
Looks like no tags are added yet.
Name | Mastery | Learn | Test | Matching | Spaced | Call with Kai | Chat |
|---|
No analytics yet
Send a link to your students to track their progress
23 Terms
What is the correlational method
what is the output
statistical technique that estimates the strength and sign of a relationship between two variables (X, Y)
There are diff types
Difference cases in which they are used (Pearson r for linear relationships)
Output: correlation coefficient
Correlation coefficient
absolute ranges
sign means what
range from 0-1
Higher = more stronger relationships
Sign reflects directionality
+ = same direction
- = difference directions from each other
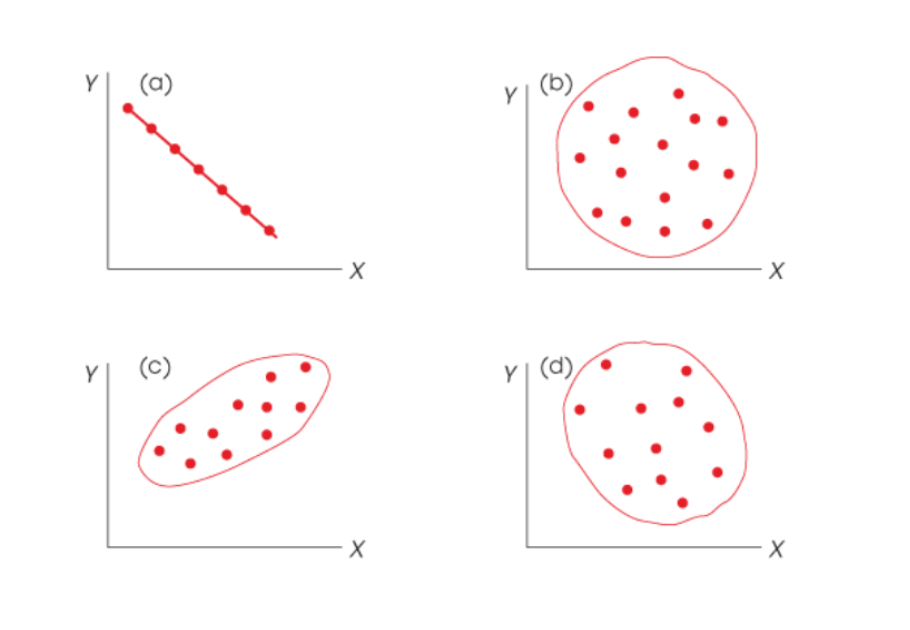
Interpreting correlation coefficients
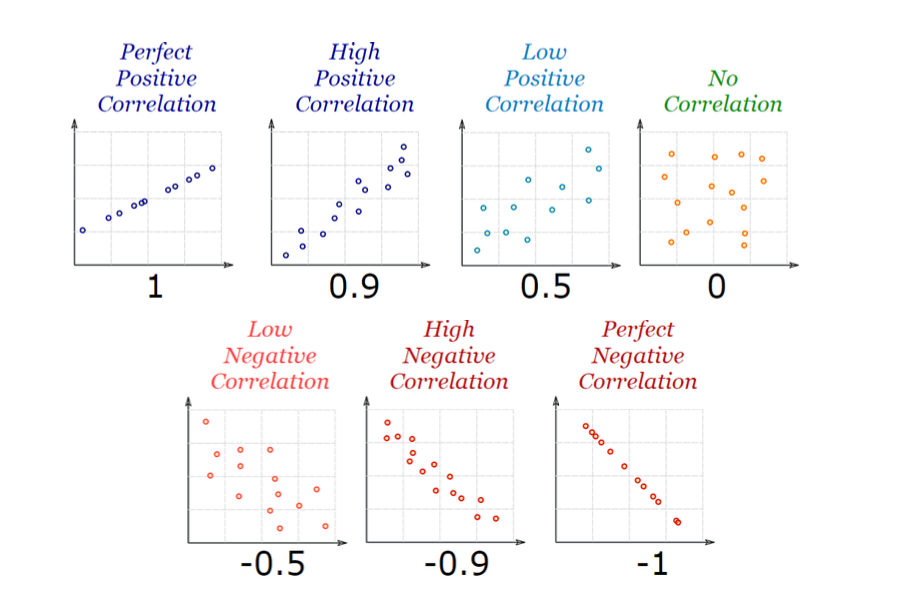
How to describe each
1
0.9
0.5
0
-0.5
-0.9
-1
The try to find for each graph on the left
Which is be more common
How is correlation affected by sampling
perfect + correlation
high + correlation
low + correlation
no correlation
low - correlation
high - correlation
perfect - correlation
will commonly see these
bottom right: weak negative
Top right: no correlation
Won’t see these
bottom left: weak positive
top left: perfect positive
Low correlations are more commonly to be found .2 or .3
correlation affected, as less data points are used, and not representative of the population that you are testing
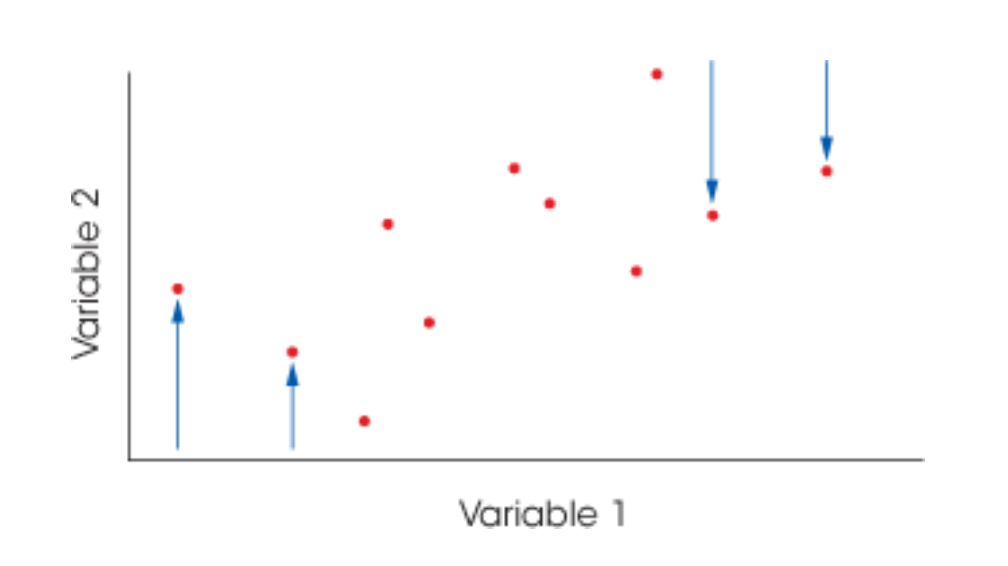
Regression towards the means
extreme stores (far away from the mean) tend to be followed by less extreme score that will be more closer to the mean (regressing)
Purpose of using correlations (4 reasons)
prediction (Y from X)
given one, you can predict another with a reasonable accuracy
validation (construct validity)
e.g. using test scores to predict behaviour
reliability (inter-rater reliability)
rater 1 and rater 2 should have similar results or else correlation does not work
Theory verification
The correlational matrix
looking at the correlation with several others
e.g. neuroticism is associated with openness and agreableness
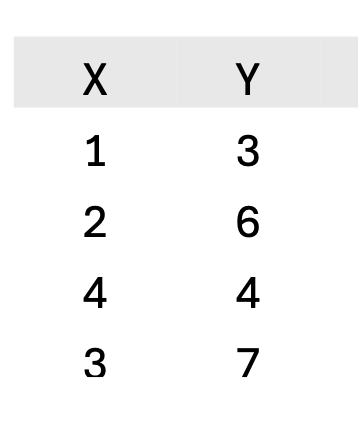
The calculation process for the Spearman correlation
first thing to do first always before calculation
What the first calculation required: what is it called
What is the alternative equation for it
Calculate it for the data on the left
What is the second calculation
Calculate it with the data on the left
What is the final correlation equation
Calculate with the data on the left
graph the data so then see if the values match with the graph and allow you to identify cases where r values are misleading (and outliers you may have to control, outliers affect the correlation)
Do a sum of products
𝑆𝑃 = Σ (𝑋 − 𝑀𝑋) (𝑌 − 𝑀𝑌)
or 𝑆𝑃 = Σ𝑋𝑌 − (ΣXΣY)/n
In the example: SP = 2
The the sum of squares for each variable
SS x = 5
SS y.= 10
r = SP / sqrt(SSxSSy)
r = 0.28
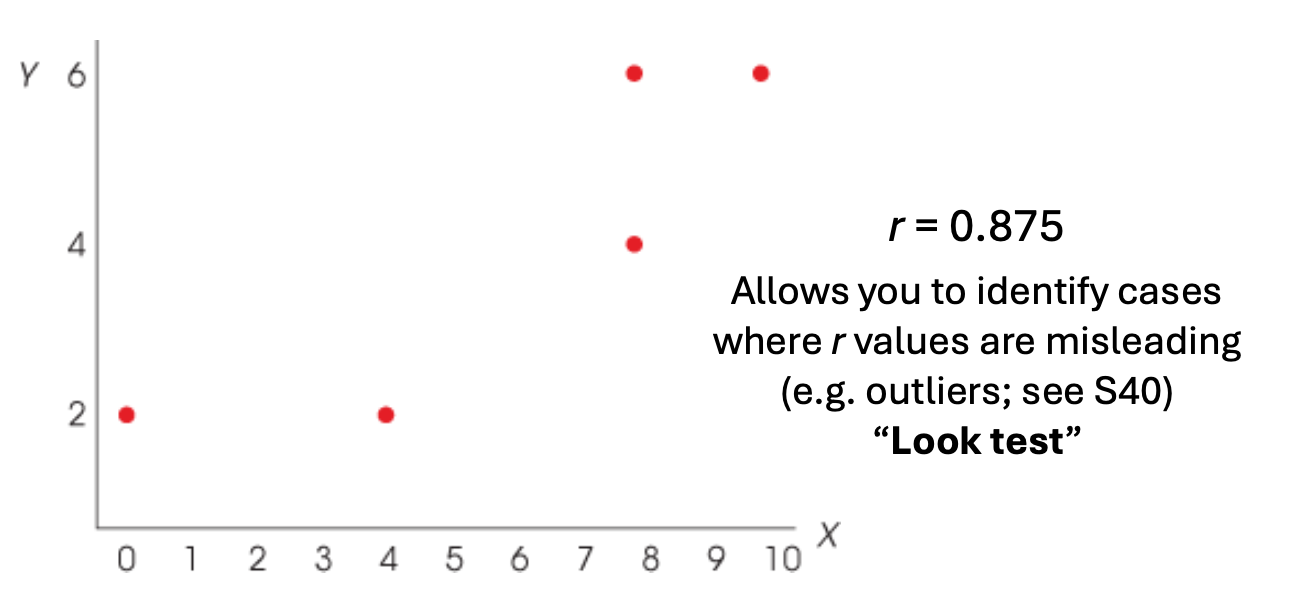
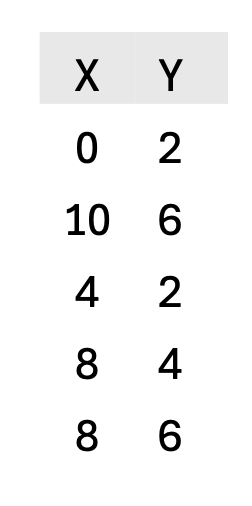
Calculate the correlation for the data on the left
ans : 0.875
Correlations are about patterns
what does adding or subtracting a constant from all X scores affect the correlation
how does multiplying all x scores (or y) affect the correlation
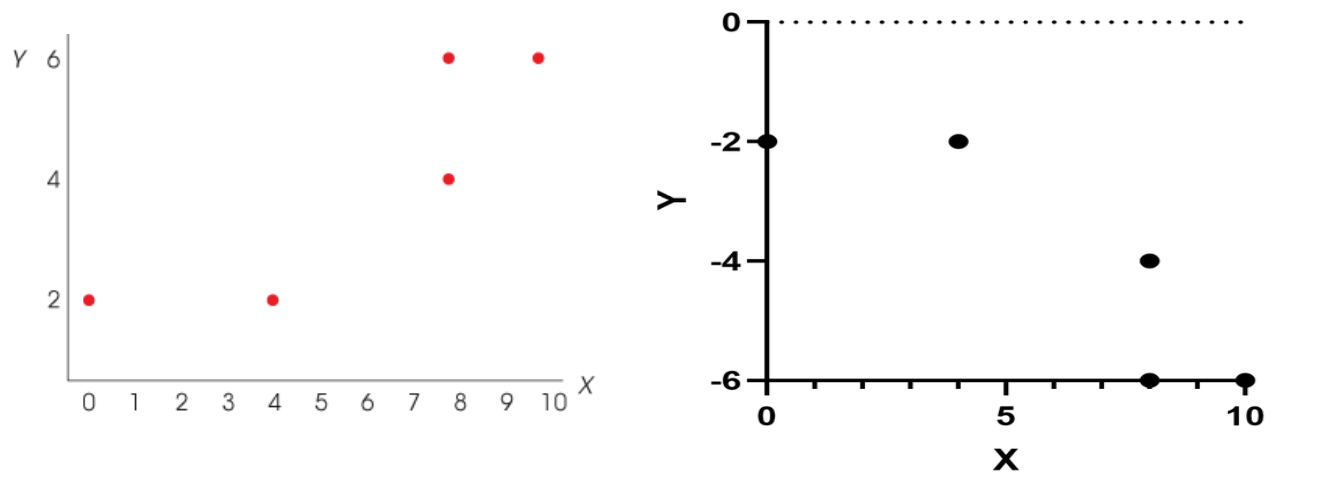
How does multiplying all x scores by a negative constance affect the correlation
No effect (all moves up, but eh placement of the score relative to each other doesn’t change)
No effect (+, all moves up, and the placement of the scares relative to each other doesn’t change)
The magnitude of the correlational doesn’t change, but the placement of the scores are opposite so the the sign of the correlation is the opposite - picture on the left
If both scores are multiplies by a negative constant (- x - = +, there is no change to the correlation)
What about r², what does it tell you compared to r?
what are two things this is called
R² is effect size, which explains the variability in X is accounted for by variability in Y
Which R² can be explain the other variable not accounted for that affects the relationship
Called effect size and coefficient of determination
Hypothesis testing
what are generally looking for in the correlation test
Two-tailed
one-tailed
Alpha threshold
Looking for a result that is more extreme than is probable if there was no effect - null hypothesis
non-directional two tailed
H0: p = 0
H1L p does not = 0
Directional one-tailed - positive shown
H0 p <=0
H1: P>0
a threshold: a = 0.05 or 0.01
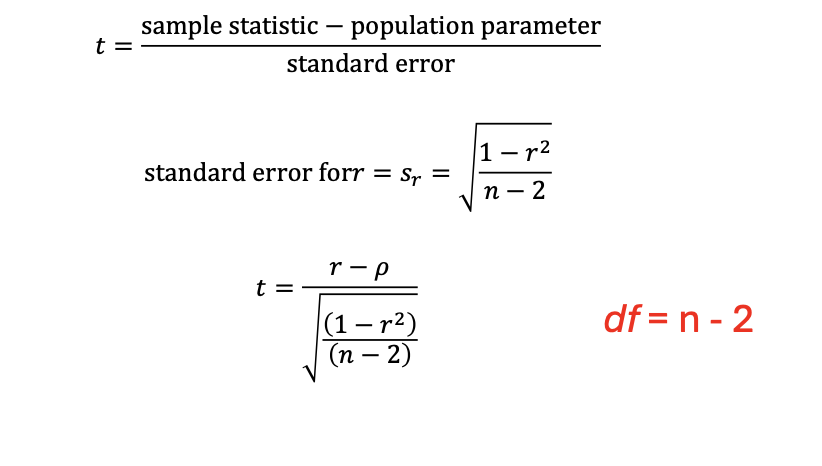
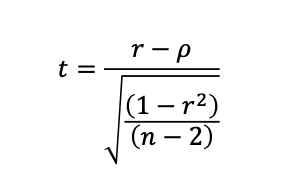
Test statistic for correlation
p is 0 because of null hypothesis
Practice
Sample of n = 30 scores, r = 0.35
Two-tailed, alpha = 0.05
df = 28, tcrit = 2.048
what is the t-score and is it significant?
Sample of n = 20 scores, r = 0.79
One-tailed, alpha = 0.01
df = 18, tcrit = 2.55
What is the t-score and is it significant
t = (0.35 – 0) / √ ((1-0.352)/(30-2)) = 1.98
not significant
t = (0.79 – 0) / √ ((1-0.792)/(20-2)) = 5.47
t > tcrit, this one is significant
five issues with correaltion
correlation is reserved for linear relationship
restricted range
correlation is sensitive to outlier
correlation is not equal to causation
correlations tells you nothing about the mechanism
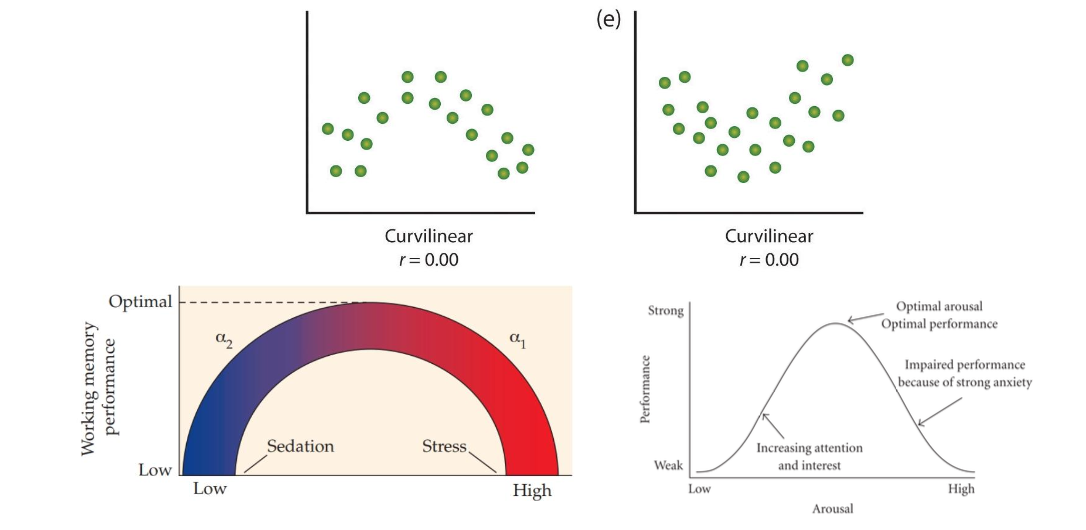
Explain why correlational calculations are not useful for non-linear relationship
what two characteristics of a non-linear relationships
they are monotonic (consistent and one direction) but has an asymptote (no loner linear)
The r value understates the the relationships of the two variables
Misrepresentation by correlations (r = 0.00 but still very meaningful)
Restricted range issue
explain why there is a restricted range, and what for?
Give an example
Therefore, what should you avoid?
the correlation can only be made by a certain range (low to medium scores), but not high scores (only prediction is consistent is a particular range)
e.g. SAT score and GPA
Low scores tends to struggle
but higher scores average out (have an asymptote)
You cannot predict any outcomes outside of the data scores you have (outside the range)
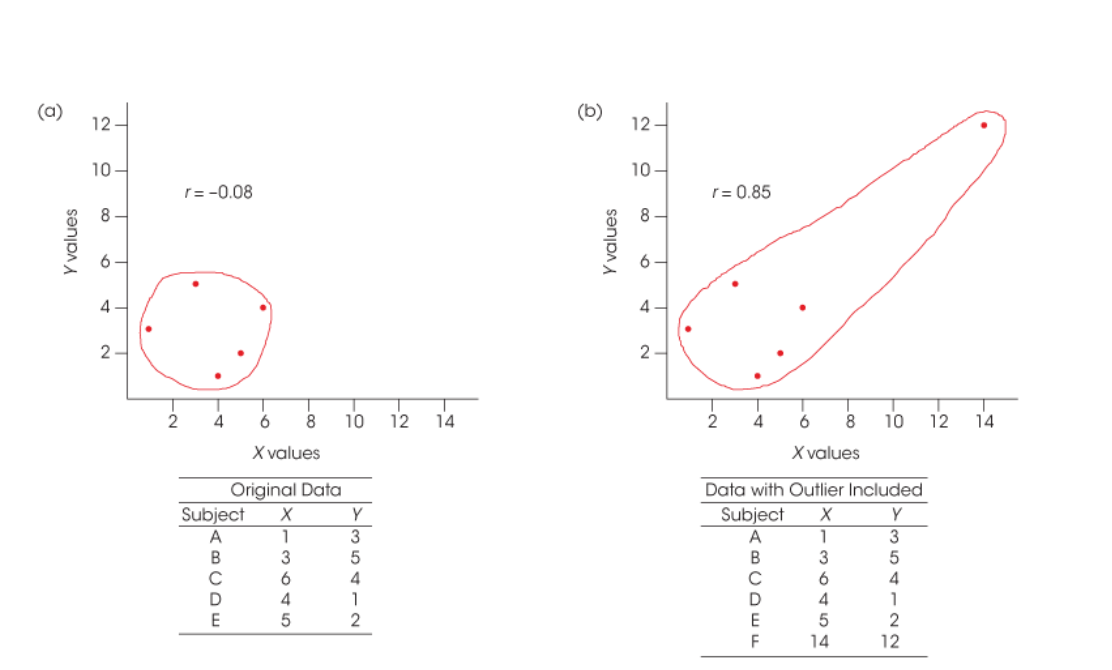
Outliers
explain outliers to correlations
e.g. out outlier can even change the direction of the correlation (becomes positive and super strong), especially for smaller samples
Therefore need to be very careful when making final conclusions (and what to expect)
Correlational does not equal causation
What is this called?
What is the multiple possibilities of the correlation
three possible things
post-hoc fallacyL If A preceded B and A+B is correlated, A must cause B
Explanation for superstitious and series concern in developmental fields
Three possible reasons for correlations
Is causally related, but directionality and mechanism unclear (how? and which causes what?)
The relationship is spurious (meaningless, coincidental)
Two things could be related, but there could be a third factor that causes the causation or correlation
e.g. ice cream and criminal activity correlated, but both is correlated with temperature
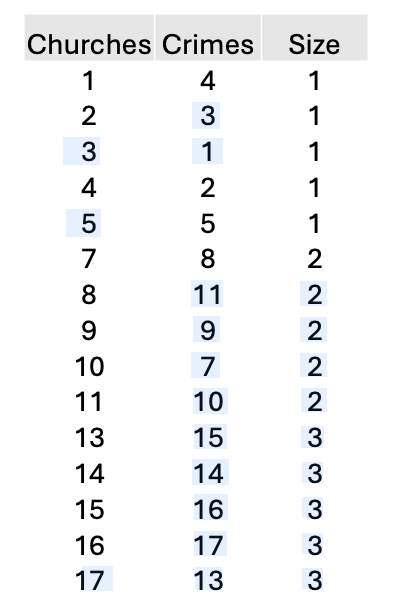
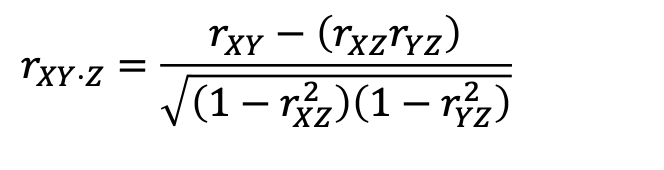
partial correlations: what is it (explain)
what is the equation
Practice with the data on the left and R XY given as 0.923
the correlation of two things, after controlling for another variable (e.g. ice cream and criminal activity and temp, after controlling for temp is obviously 0)
Practice
rXY = 0.923 (already done)
rYZ = 0.961
rXZ = 0.961
rXY.Z = 0
Spearman alternative correlations
what data would you use this for?
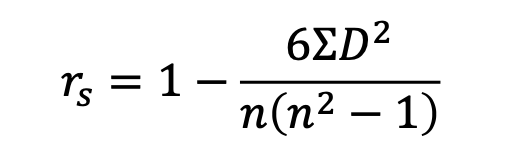
What is the equation + assumption need to do beforehand
the relationship is monotonic but has a asymptote or the r value is not useful based on the original data, but converting the scores into ranks make the relationships much stronger
Assuming there aren’t ties to the scores, the alternative formula will work (known as the spearman correlation or rs)
What happens if the scores are tied
take the means of the same ranked scores, and then do calculations as normal
Point-biserial correlation
what is it
between one continuous variance and a two category variable dichotomous
do binary numerical variable and then do the person correlation as normal
The Phi Coefficient: what is it?
the correlations between two dichotomous variables
record both into a binary numerical variable
Do the Pearson correlation