IMC Unit 2
1/674
There's no tags or description
Looks like no tags are added yet.
Name | Mastery | Learn | Test | Matching | Spaced | Call with Kai |
|---|
No analytics yet
Send a link to your students to track their progress
675 Terms
What's primary data
Data collected BY AN INVESTIGATOR with a SPECIFIC PROJECT in mind
What's Secondary data
Data collected BY SOMEONE ELSE for some other purpose
What's a population
All members of a defined group
What's a Sample
A subset of a population
What is the frequency of data in a histogram
Area of the bars
What are the types of sample
Random - each member of the population has an EQUAL CHANCE of being selected)
Non random – a selection criteria is used
What is systematic sampling?
A method where you select every k-th element from a population
What is stratified sampling?
Population is divided into subgroups and random samples are taken from each subgroup.
What's Discrete Data
Can only take certain values
What's Continuous Data
Can take any value
How are Discrete Data and Continuous Data collected
Discrete data is COUNTED
Continuous data is MEASURE
What are the different measures of Central Tendency
Arithmetic Mean
Median
Mode
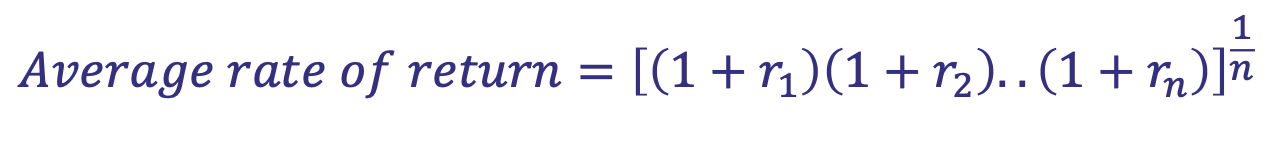
What does Geometric Mean calculate
Calculates the ‘average rate of change’
What is the formula for Geometric Mean
Remember that they are multiplied not added
Remember the 1 + r
What are measures of dispersion
• Standard deviation
• Range
• Interquartile range
• Percentile
What is standard deviation
Measures the VARIABILITY of a data set AROUND THE MEAN
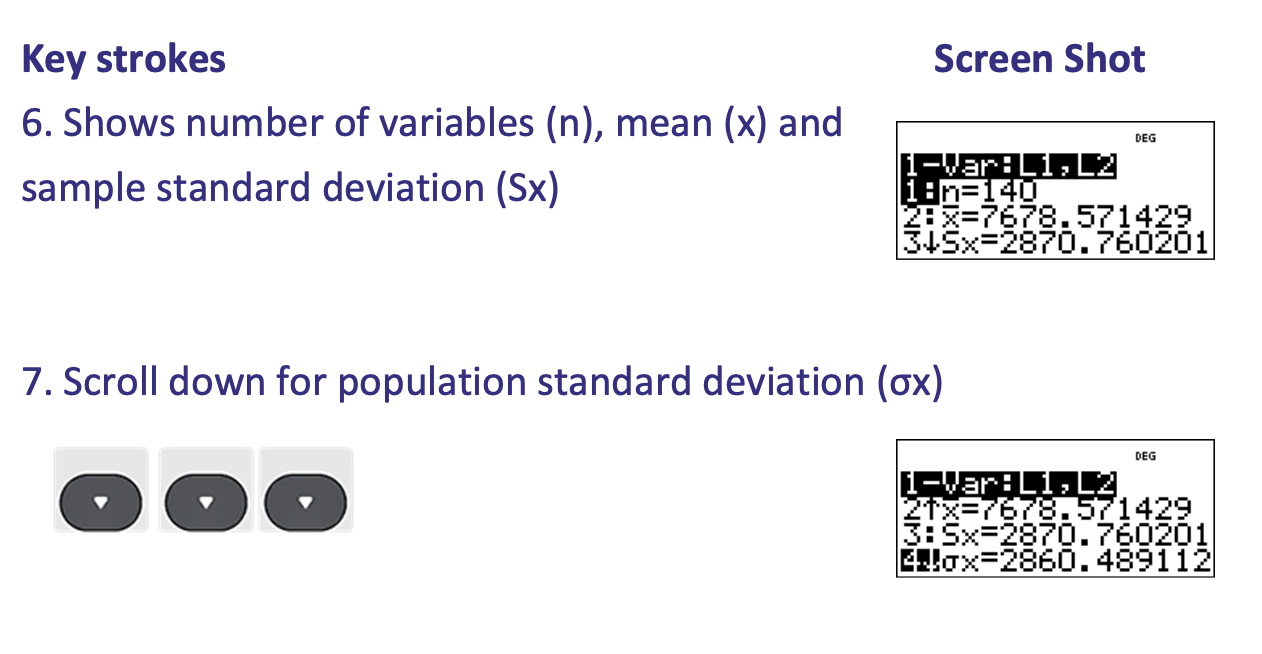
What is step 1 of calculating Standard Deviation (of a Data Set)
What is step 2 of calculating Standard Deviation (of a Data Set)
What is step 3 of calculating Standard Deviation (of a Data Set)
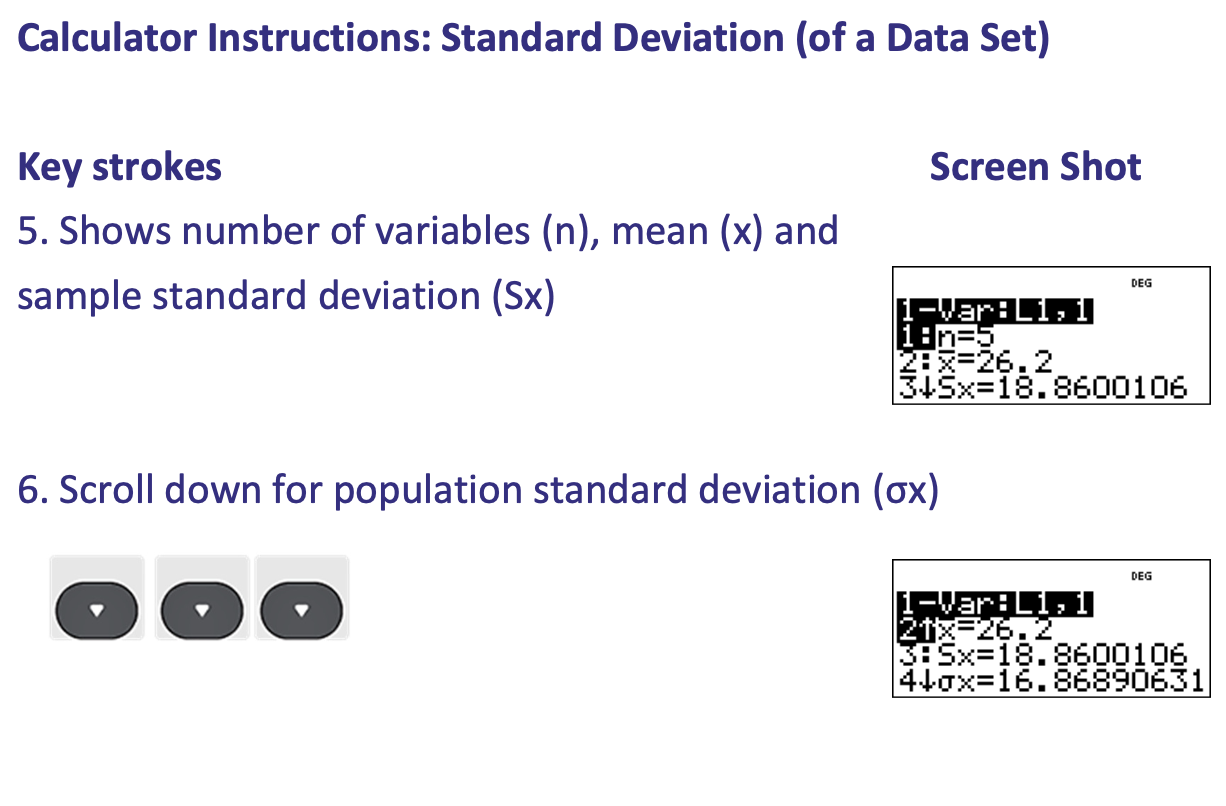
What is step 1 of calculating Standard Deviation (of a Frequency Distribution)
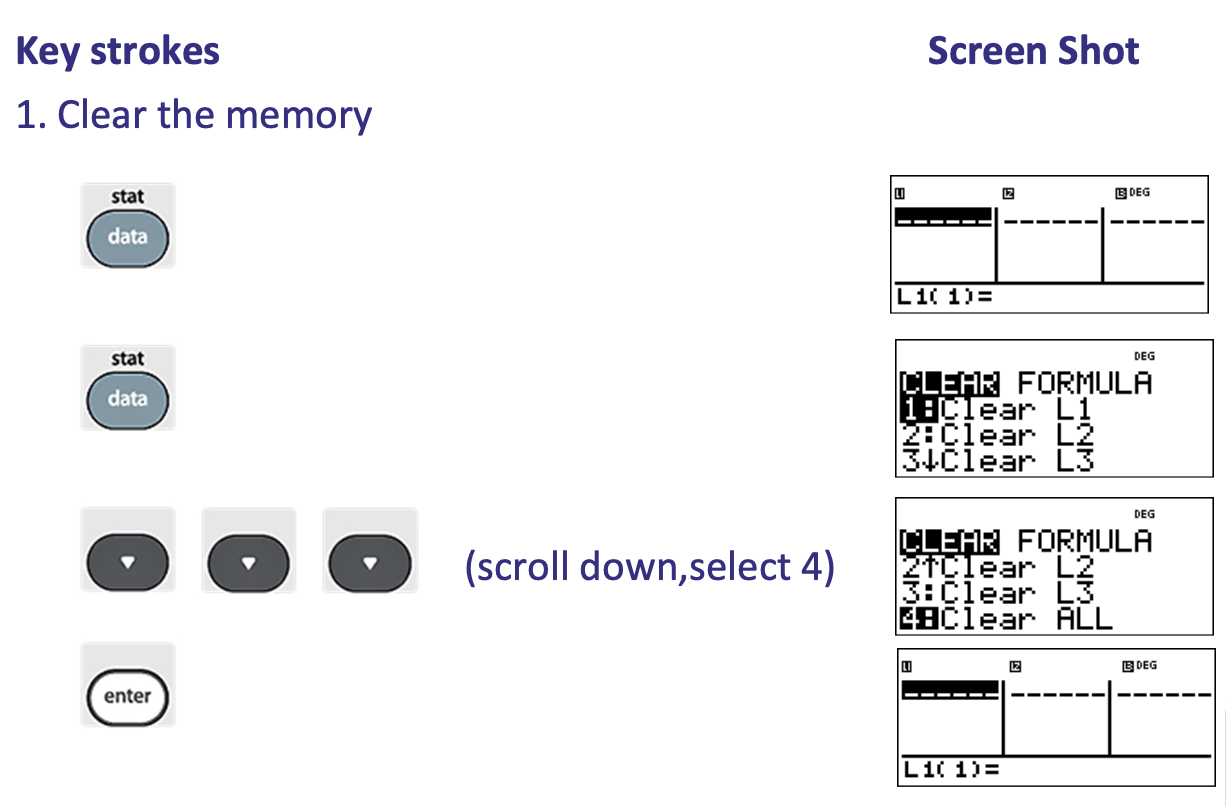
What is step 2 of calculating Standard Deviation (of a Frequency Distribution)
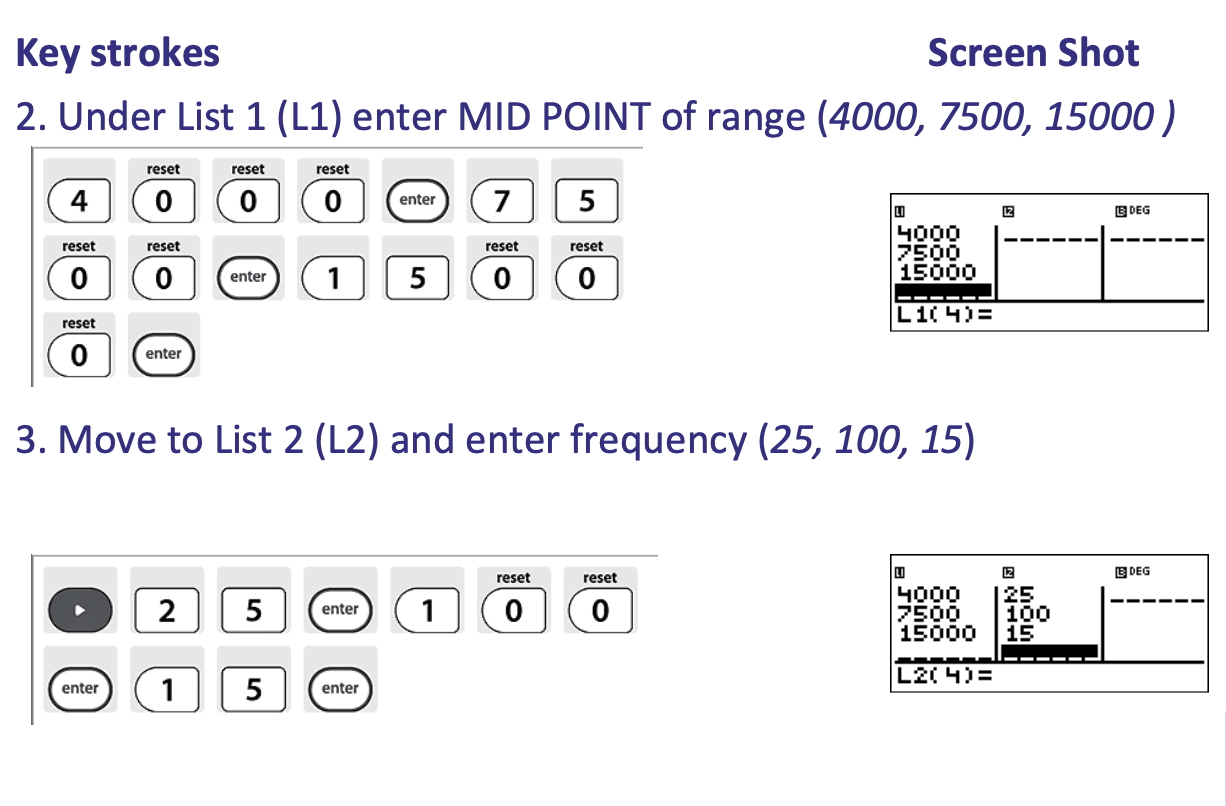
What is step 3 of calculating Standard Deviation (of a Frequency Distribution)
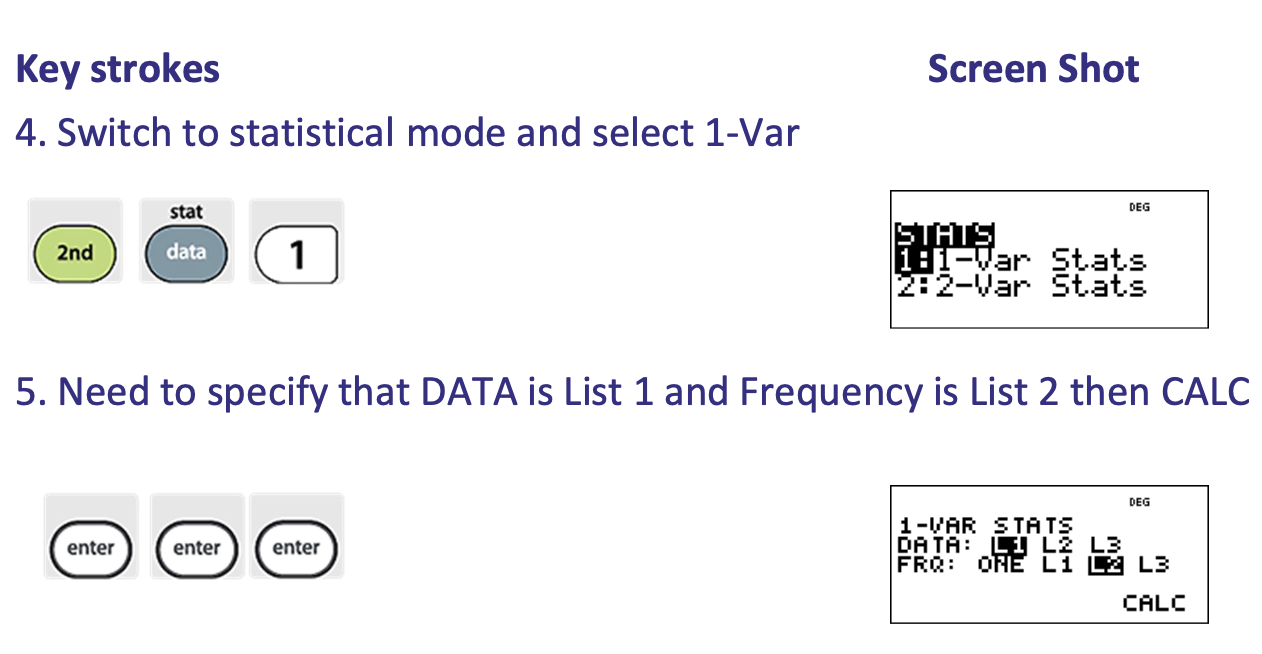
What is step 4 of calculating Standard Deviation (of a Frequency Distribution)
What is a Range
Difference between the highest and lowest values in a data set
What is Interquartile Range
Represents the ‘middle 50%’ of a data set
Difference between the 1st and 3rd quartiles
What is true of Inter quartile range
A measure of distribution not dominated by extreme values
What is 1st Quartile defined as
Mid-point between the lowest value and the median
What is 2nd Quartile defined as
The median
What is 3rd Quartile defined as
Mid-point between the median and the highest value
Where is the mean in a normal distribution
At the centre
What does it mean that a normal distribution is perfectly symmetrical
50% of observations on each side of the mean
How many observations are within one standard deviation of each side of the mean
~ 2/3rds
How many observations are within two standard deviation of each side of the mean
~ 95%
How is the shape of a normal distribution curve determined
By the Mean and Standard Deviation
What is the relationship between Mean, Median and Mode in a positively skewed frequency distribution
Mode <Median < Mean
What is the relationship between Mean, Median and Mode in a negatively skewed frequency distribution
Mean <Median < Mode
What is Regression/ Least-Squares/ Correlation analysis
The derivation of an equation in which one of the variables (the dependent variable, Y) can be estimated from other variables (the independent variables, X
What does the Least-Square method create
A simple ‘regression line’ (linear bivariate regression line
Y = a + bX
How is the line derived in the Least-Square method
Minimises the sum of the squared errors
What are the uses of the Least-Squares method
Extrapolation: forecast values OUTSIDE the range of the sample
Interpolation: filling in values missing WITHIN
the range
What does it mean if values are correlated
Values that increase/decrease together are positively correlated
Values that diverge are negatively correlated
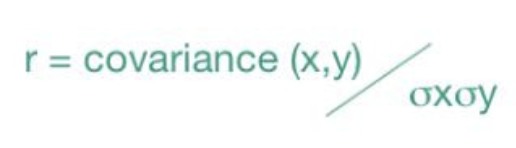
What is correlation co-efficient
How well a linear bivariate regression line summarises the data
A measure of how closely related two variants are
What is the formula for correlation co-efficient
What happens when price volatility increases over time
Correlation between securities increase
Example of how simple arithmetic indices are constructed
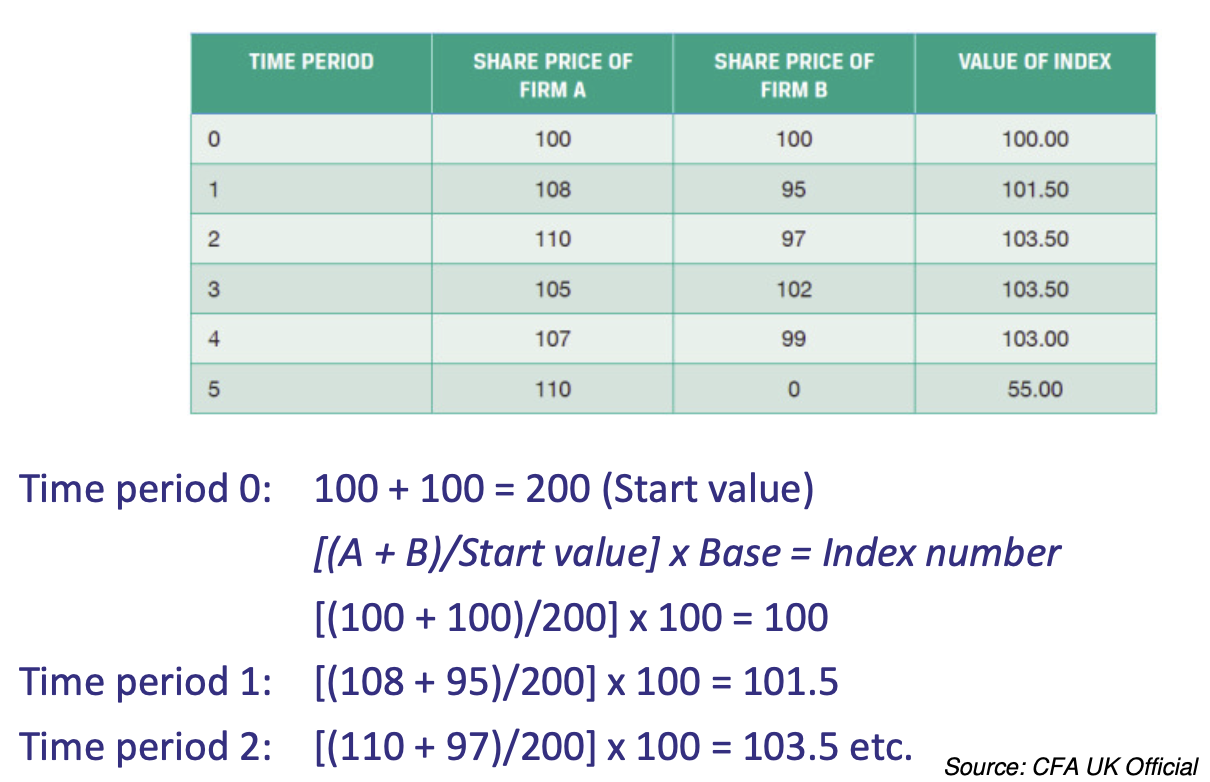
What is the equation for simple arithmetic indices
[(A + B) / Start Value) * Base] = Index Number
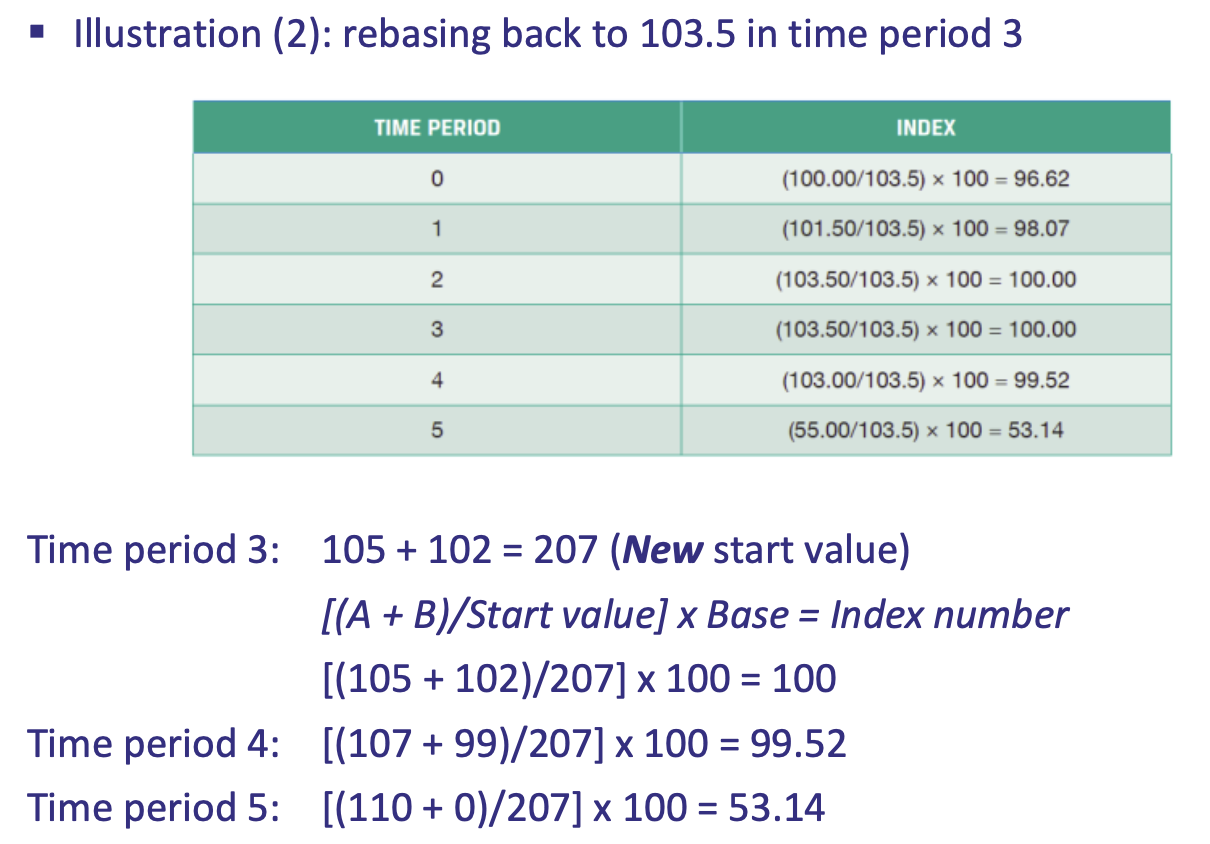
Example of how simple arithmetic indices can be rebased in a following time period
Do indices show percentage change or actual change
Percentage change
For a simple aritmetic index do all components have the same impact on value
Yes
What are the features of Geometric Indices
Less sensitive to changes in the price of constituents
Capital changes easy to accommodate
What is an example of a geometric index
Financial Times Ordinary Share Index (FT30)
What are the problems of Equally Weighted Indices (Why use Market Weighted Indices)
Give too much/little weight to companies, i.e. they are NOT REPRESENTATIVE of a whole market
Example of how Equally Weighted Indices are constructed
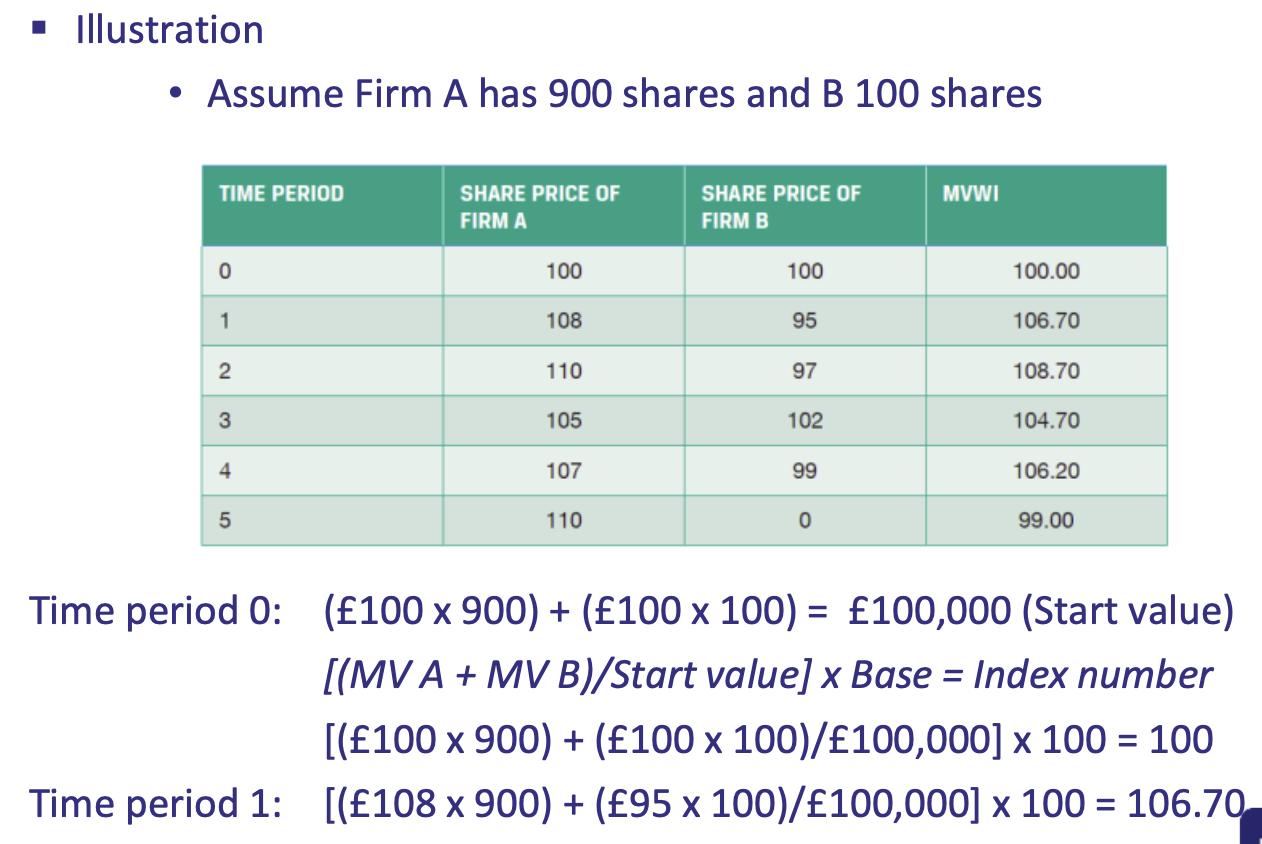
What is the equation for equally weighted indices
[(MV A + MV B) / Start Value] * Base = IndexNumber
MV no. of shares
Are all major indices total return indices
No
Are all major bond indices total return indices
Yes
What are some key UK equity market indices
FTSE100
• 100 largest UK companies
• Captures 70% of the value of UK listed shares
FTSE250
• The NEXT most valuable 250 UK companies (‘mid-cap stocks’)
FTSE All-Share
• Covers 98% of the UK stock market capitalisation
FT30
• Oldest UK index (set at 100pts in 1935)
What are some key US equity market indices
Dow Jones Industrial Average
• 30 largest industrial stocks on the NYSE and NASDAQ
• Calculation: unweighted arithmetic mean
Standard & Poor’s (S&P) 500
• 500 largest US companies
What is a German Key index
DAX
What is a Japan Key index
Nikkei 225
How is the Nikkei 225 calculated
unweighted arithmetic mean
What is the formula for Effective Annual Rate (EAR) Or Annual Percentage Rate (APR)
Where:
‘r’ = relevant periodic flat rate/number of periods
‘n’ = number of periods over which ‘r’ is compounded

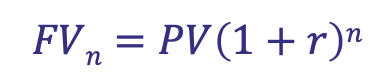
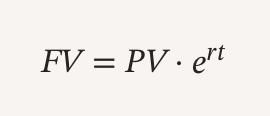
How is Future Value calculated
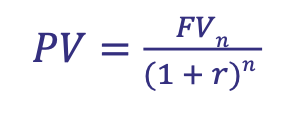
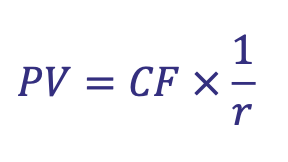
How is Present Value calculated
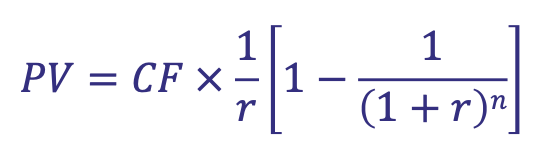
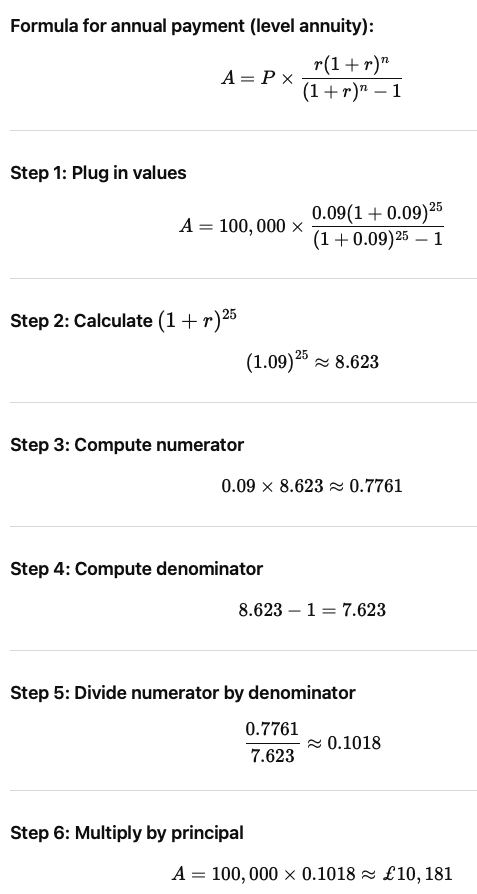
How are Annuities calculated
A repayment mortgage of £100,000 is taken out over 25 years.
What is the annual repayment required at the end of each year if the rate of interest is fixed at 9%?
£10,181
What is the formula for calculating the future value of an investment under continuous compounding?
Remember its r not 1+ r
How are Perpetuities calculated
What is Net Present Value (NPV)
The present value of inflows less the present value of the outflows
What is Internal Rate of Return (IRR)
The discount rate that makes the present value of the inflows equal to the present value of the outflows (i.e. net present value of zero)
What is the Production Possibility Frontier
Describes the maximum quantities of goods produced using all available resources in an economy
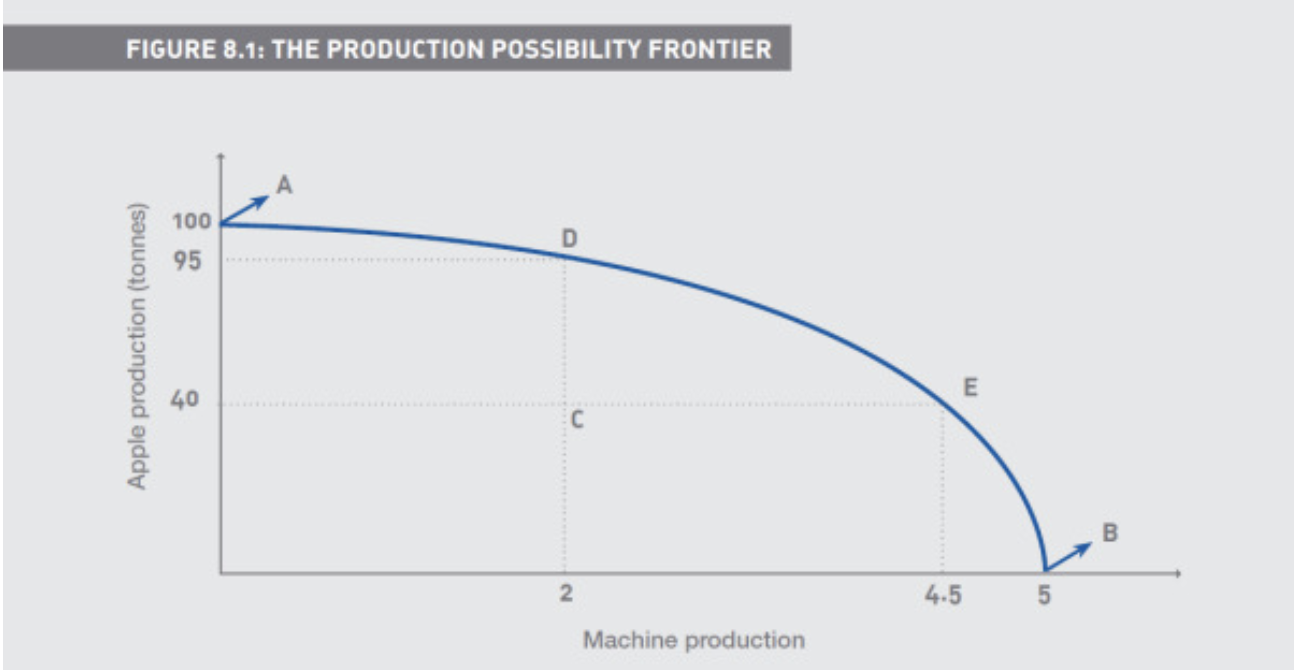
What are the inputs in the Production Possibility Frontier
Labour
Land
Capital
What are factors affecting demand
• Complementary goods
• Substitute goods
• Consumer income
• Tastes
• Advertising
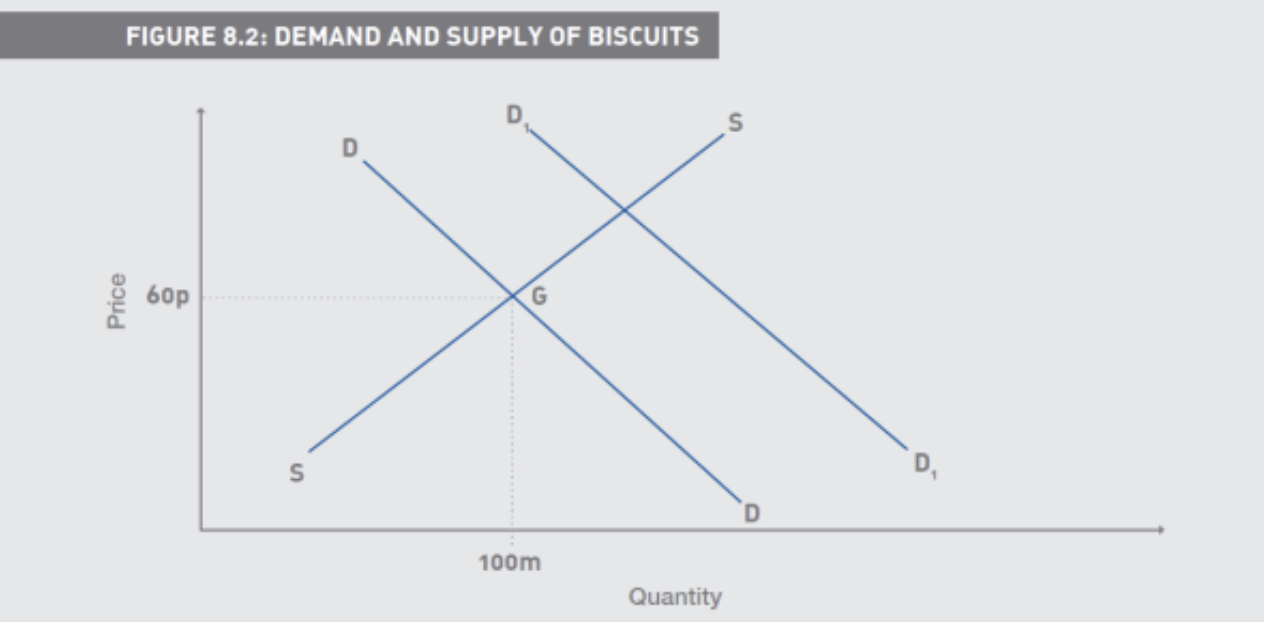
What does Price elasticity of Demand greater than one mean
Elastic demand
What does Price elasticity of Demand less than one mean
Inelastic demand
What does Price elasticity of Demand cause
Shift ALONG the curve
What is the formula for PED
(% change in quantity demanded)/(% change in price)
What is the elasticity of demand under perfect competition?
Infinity
What does positive Cross elasticity of Demand imply
substitute goods
What does negative Cross elasticity of Demand imply
complimentary goods
What does Cross elasticity of Demand cause
Shift IN the curve
What does a positive Income elasticity of Demand imply
normal goods
What does a Income elasticity of Demand greater than 1 imply
luxury goods
What does a negative Income elasticity of Demand imply
inferior goods (necessities)
What does Income elasticity of Demand cause
Shift IN the curve
What is Supernormal profit (Economic Profit)
Profit in excess of
• Measured costs
• Opportunity costs
Economic profit is calculated as:
Accounting profit minus the cost of the entrepreneur's time and capital
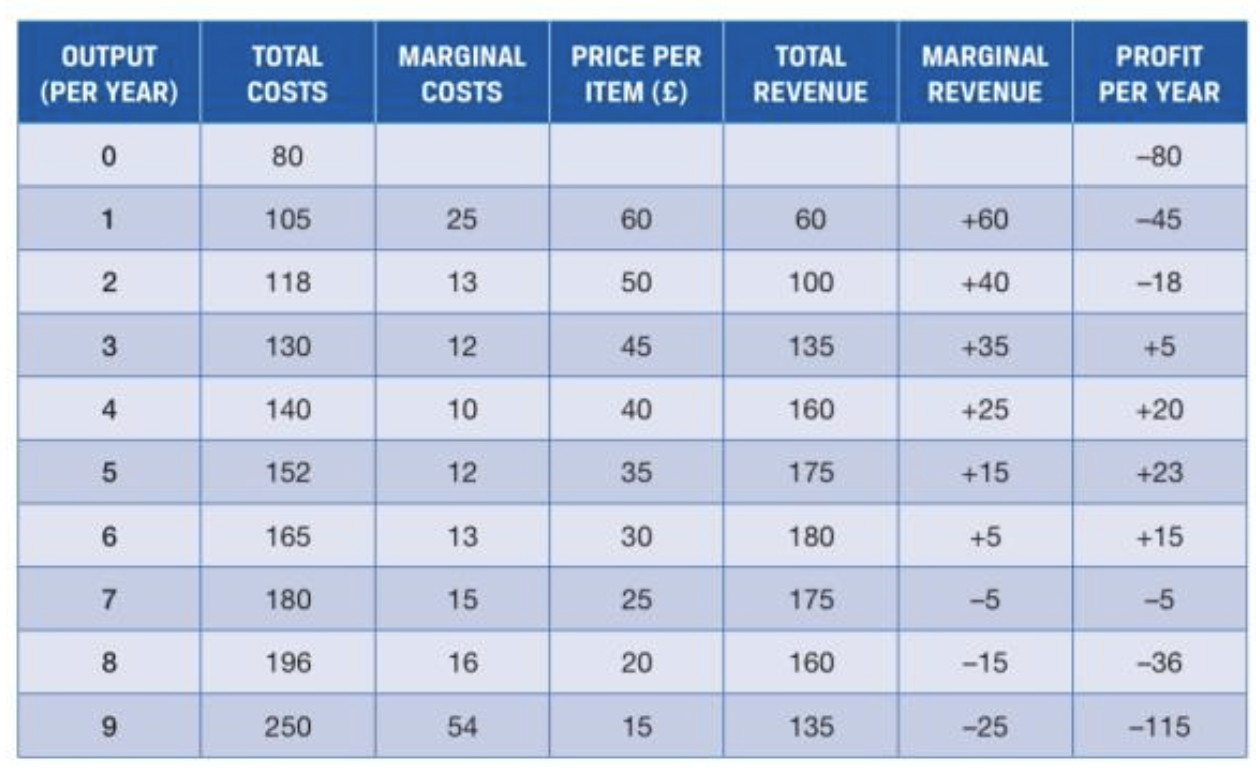
How do companies profit maximise
Firms will produce output until the level is reached where marginal cost and marginal revenue are equal
What is Economies of Scale
An lncrease inputs leads to a more than proportionate increase in output
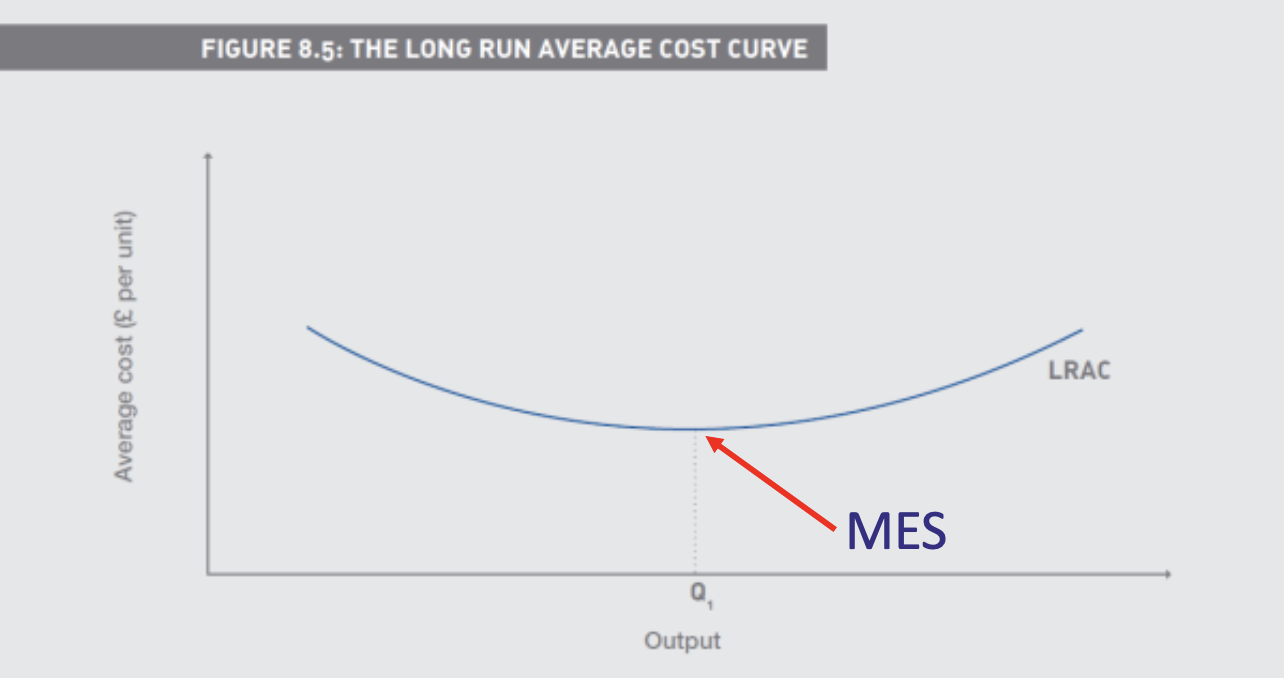
What is the bottom of the Long Run average cost curve
The minimum efficient scale
Where is a firm’s optimal output
Q1 is optimal output
A is where MR = MC,
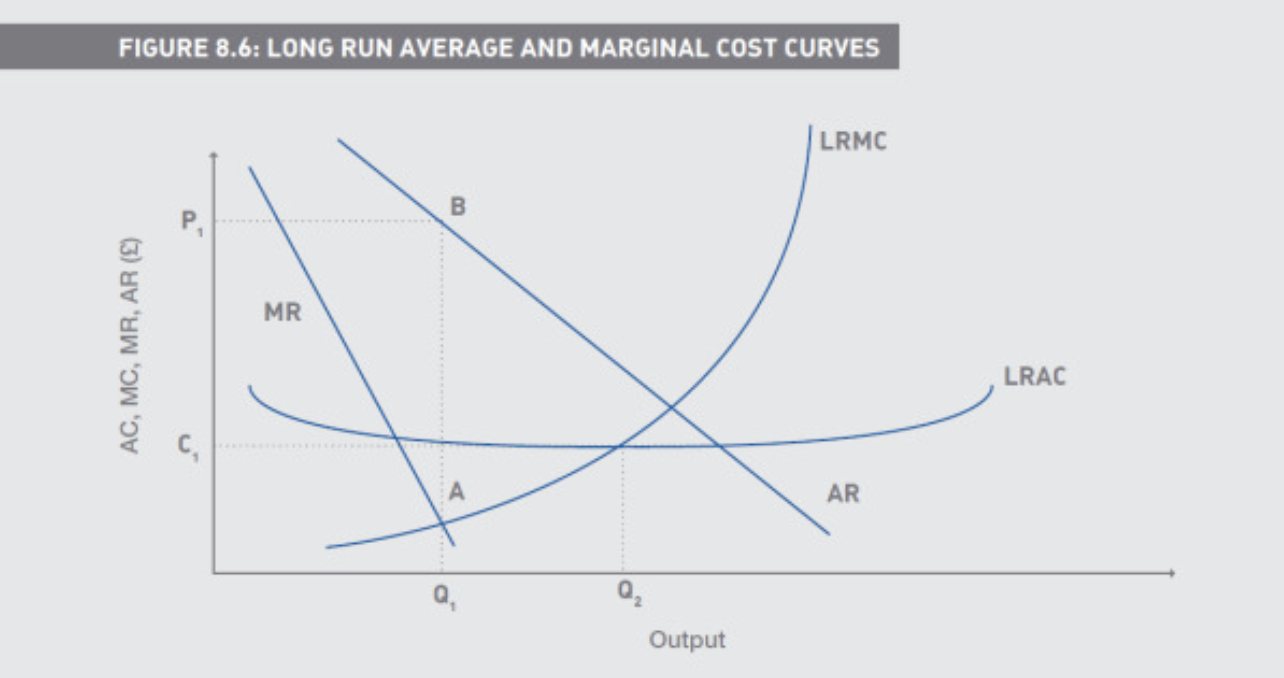
Where does a firm begin to experience diseconomies of scale
Q2

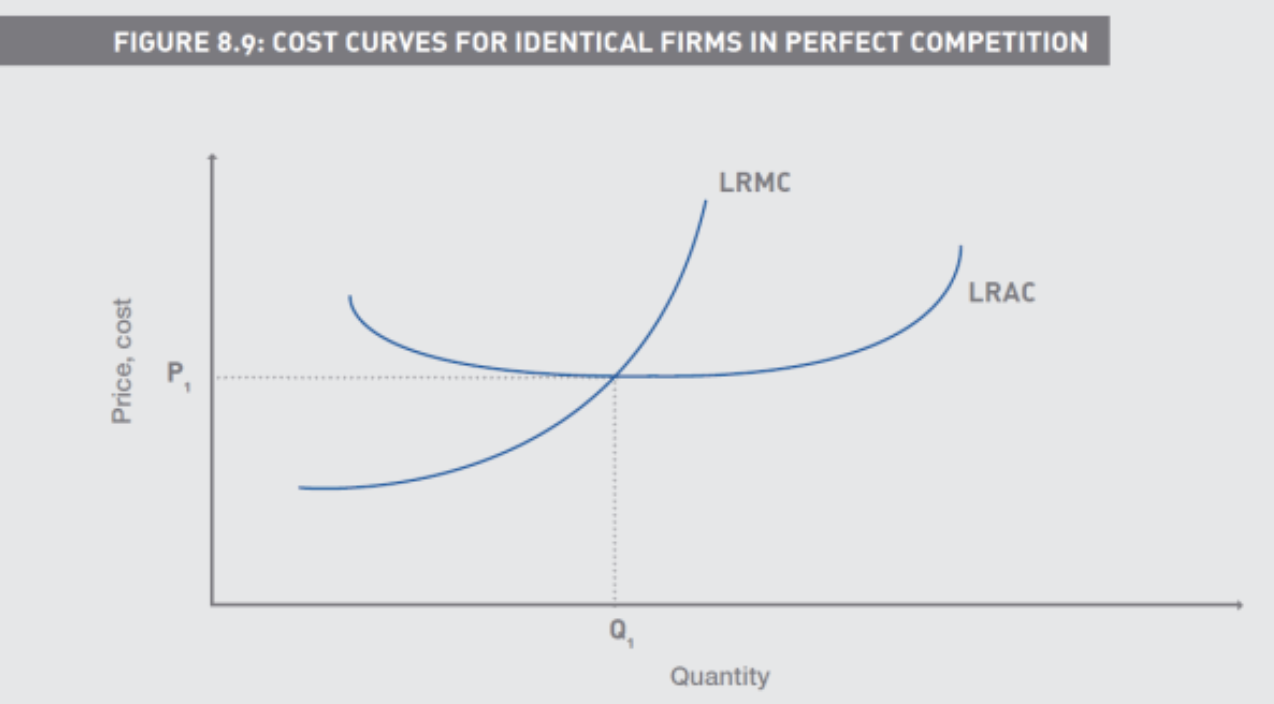
What is perfect competition
A market structure in which neither buyers nor sellers believe that they can influence the market price by any actions of their own Horizontal demand line (AR)
How do Buyers and Sellers view themselves in Perfect Competition
as Pricetakers
What are the characteristics of Perfect Competition
Homogeneous product
Large number of independent firms, each small relative to
Industry size
No barriers to entry or exit
Perfect information
Where is MR and AR in the short run in perfect competition
Equal to price

In the Short Run how does a firm in perfect competition decide whether to continue operating
We equate MR with SRMC, and check to see if this intersection is above the SRAVC curve
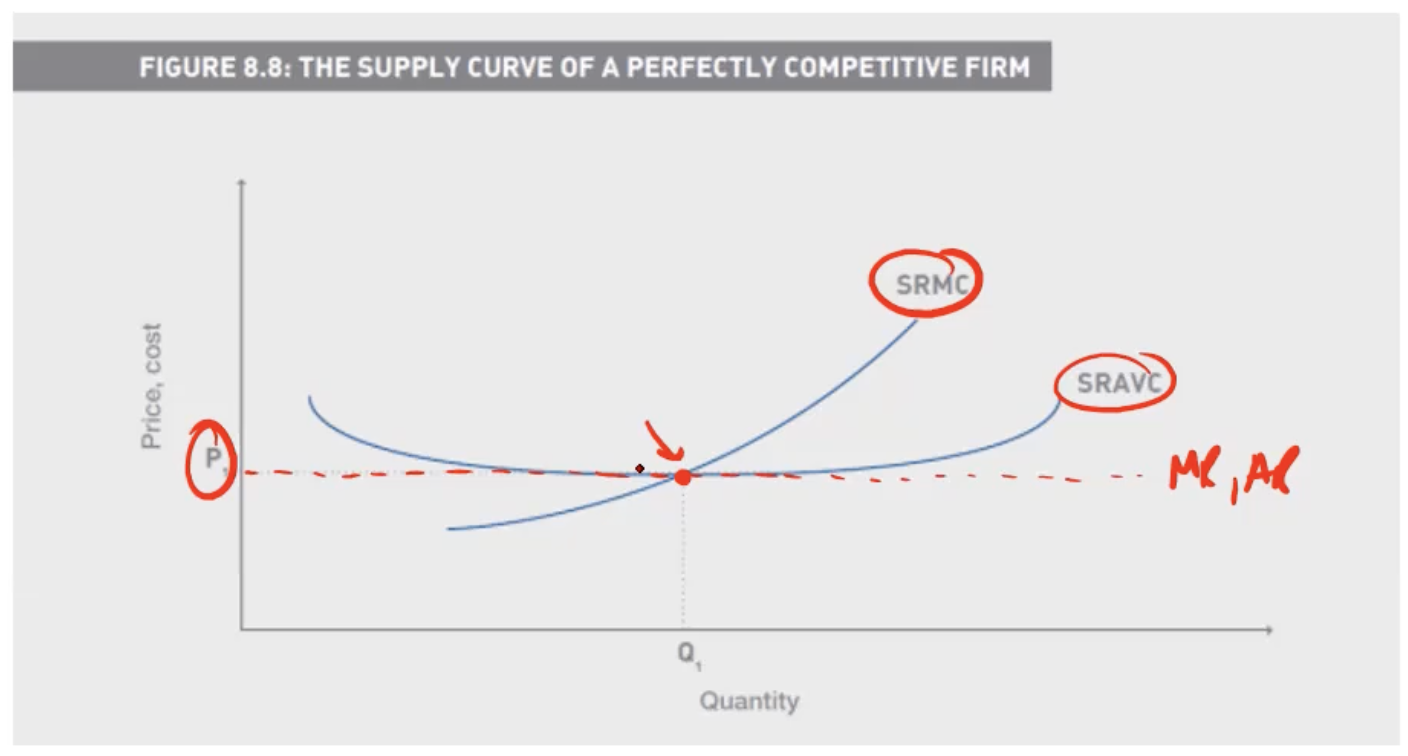
Why must Revenue be above Variable cost in perfect competition
A firm will only stay in business in the short run if it can at least cover its variable costs.
Where is MR and AR in the long run in perfect competition
Equal to Price

In the Long Run how does a firm in perfect competition decide whether to continue operating
If AR is below LRATC