Extinction Practice Problems
 Call Kai
 Learn
Learn Practice Test
 Spaced Repetition
 Match
Match Flashcards
 Knowt Play
1/26

There's no tags or description
Looks like no tags are added yet.
Name | Mastery | Learn | Test | Matching | Spaced | Call with Kai | Chat |
|---|
No analytics yet
Send a link to your students to track their progress
27 Terms
A microscopic fossil (or microfossil) of pollen grains are found at your dig site. Which type of fossil best describes pollen?
Preserved remains
Nitrogen-13 decays to carbon-13 with a half-life of 10 minutes. Assume that you are given a starting mass of 12.0 grams of nitrogen-13. How long (minutes) will it take for four half-lives to pass?
1. What information is given?
2. What is being asked?
3. Which equation do we use?
4. Ready to solve!
1. Half-life N-13 = 10 minutes, N0 = 12g, y = 4
2. Time
3. Time = half-life * y
4. Time = 10 min * 4 = 40 min!
From a sample of human bone, you determine that of the original 600.0 grams of carbon-14 present in the bone, only 75.0 grams remain. Knowing that the half-life of carbon-14 is about 5730 years, what do you determine is the age of this bone (and thus this civilization)?
1. What information is given?
2. What is being asked?
3. Which equation do we use?
4. Ready to solve!
1. N0 = 600g, Np = 75g, half-lifeC-14 = 5730 years
2. Time
3. Log(Np / N0)= y*log(0.5) and Time = half-life * y
4. Log(75/600)/log(0.5) = y = 3 time = 5730 years * 3 = 17,190 years!
An early group of vertebrates, known as the conodonts, went extinct about 425 mya. A number of polychaetae worms, graptolites, ostracods, ophiuroids, and other invertebrates also went extinct at this time. Which of the following is the most likely cause of this large extinction event:
A. Overhunting by humans
B. Background extinction
C. Primary extinction
D. Secondary extinction
C. Primary extinction
True or false: Extinction is always occurring
True
What do the “Big 5” mass extinctions have in common?
Climate change

Which of the following conclusions is supported by this graph? Select ALL that apply.
A. Extinctions occur faster for smaller populations.
B. Very large populations do not go extinct.
C. The relationship between population size and years before extinction is non-linear.
D. Longer generation times promote slower extinction rates.
A. Extinctions occur faster for smaller populations.
C. The relationship between population size and years before extinction is non-linear.
An early group of vertebrates, known as the conodonts, went extinct about 425 mya. A number of polychaetae worms, graptolites, ostracods, ophiuroids, and other invertebrates that conodonts fed on also went extinct at this time. Which term below best describes this extinction event?
Mass extinction
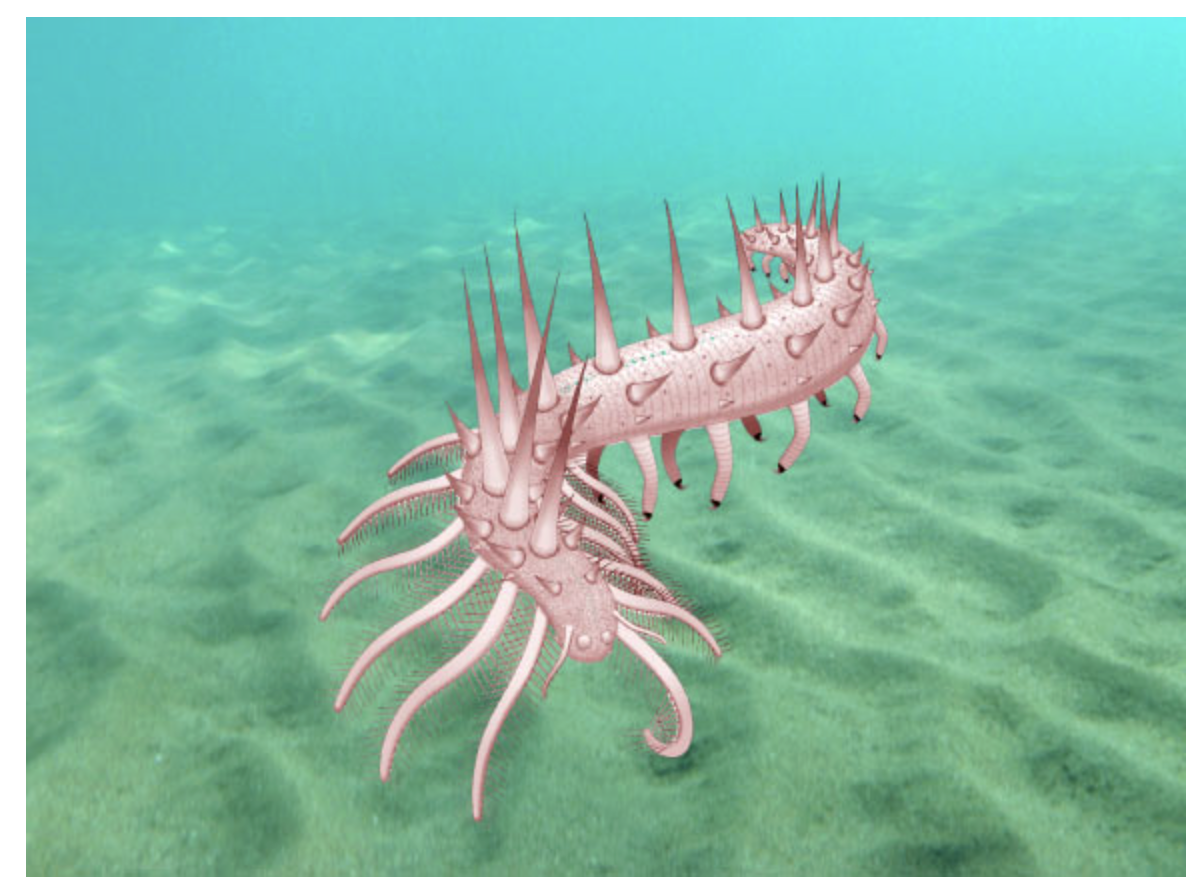
Below is an artist's rendition of Collinsium ciliosum, a fossil from an early Cambrian deposit in China. Yang et al (2015) described and placed the species in the same group as Anomalocaris, an animal that lived during the Cambrian period. Which of the following features does the animal below display that are associated with the diversification of animal forms during this period:
A. A segmented body plan (indicates Hox gene involvement)
B. Transition to terrestrial habitation
C. A head and directed movement (for predator-prey chases)
D. Hard body parts (such as spines)
A. A segmented body plan (indicates Hox gene involvement)
C. A head and directed movement (for predator-prey chases)
D. Hard body parts (such as spines)
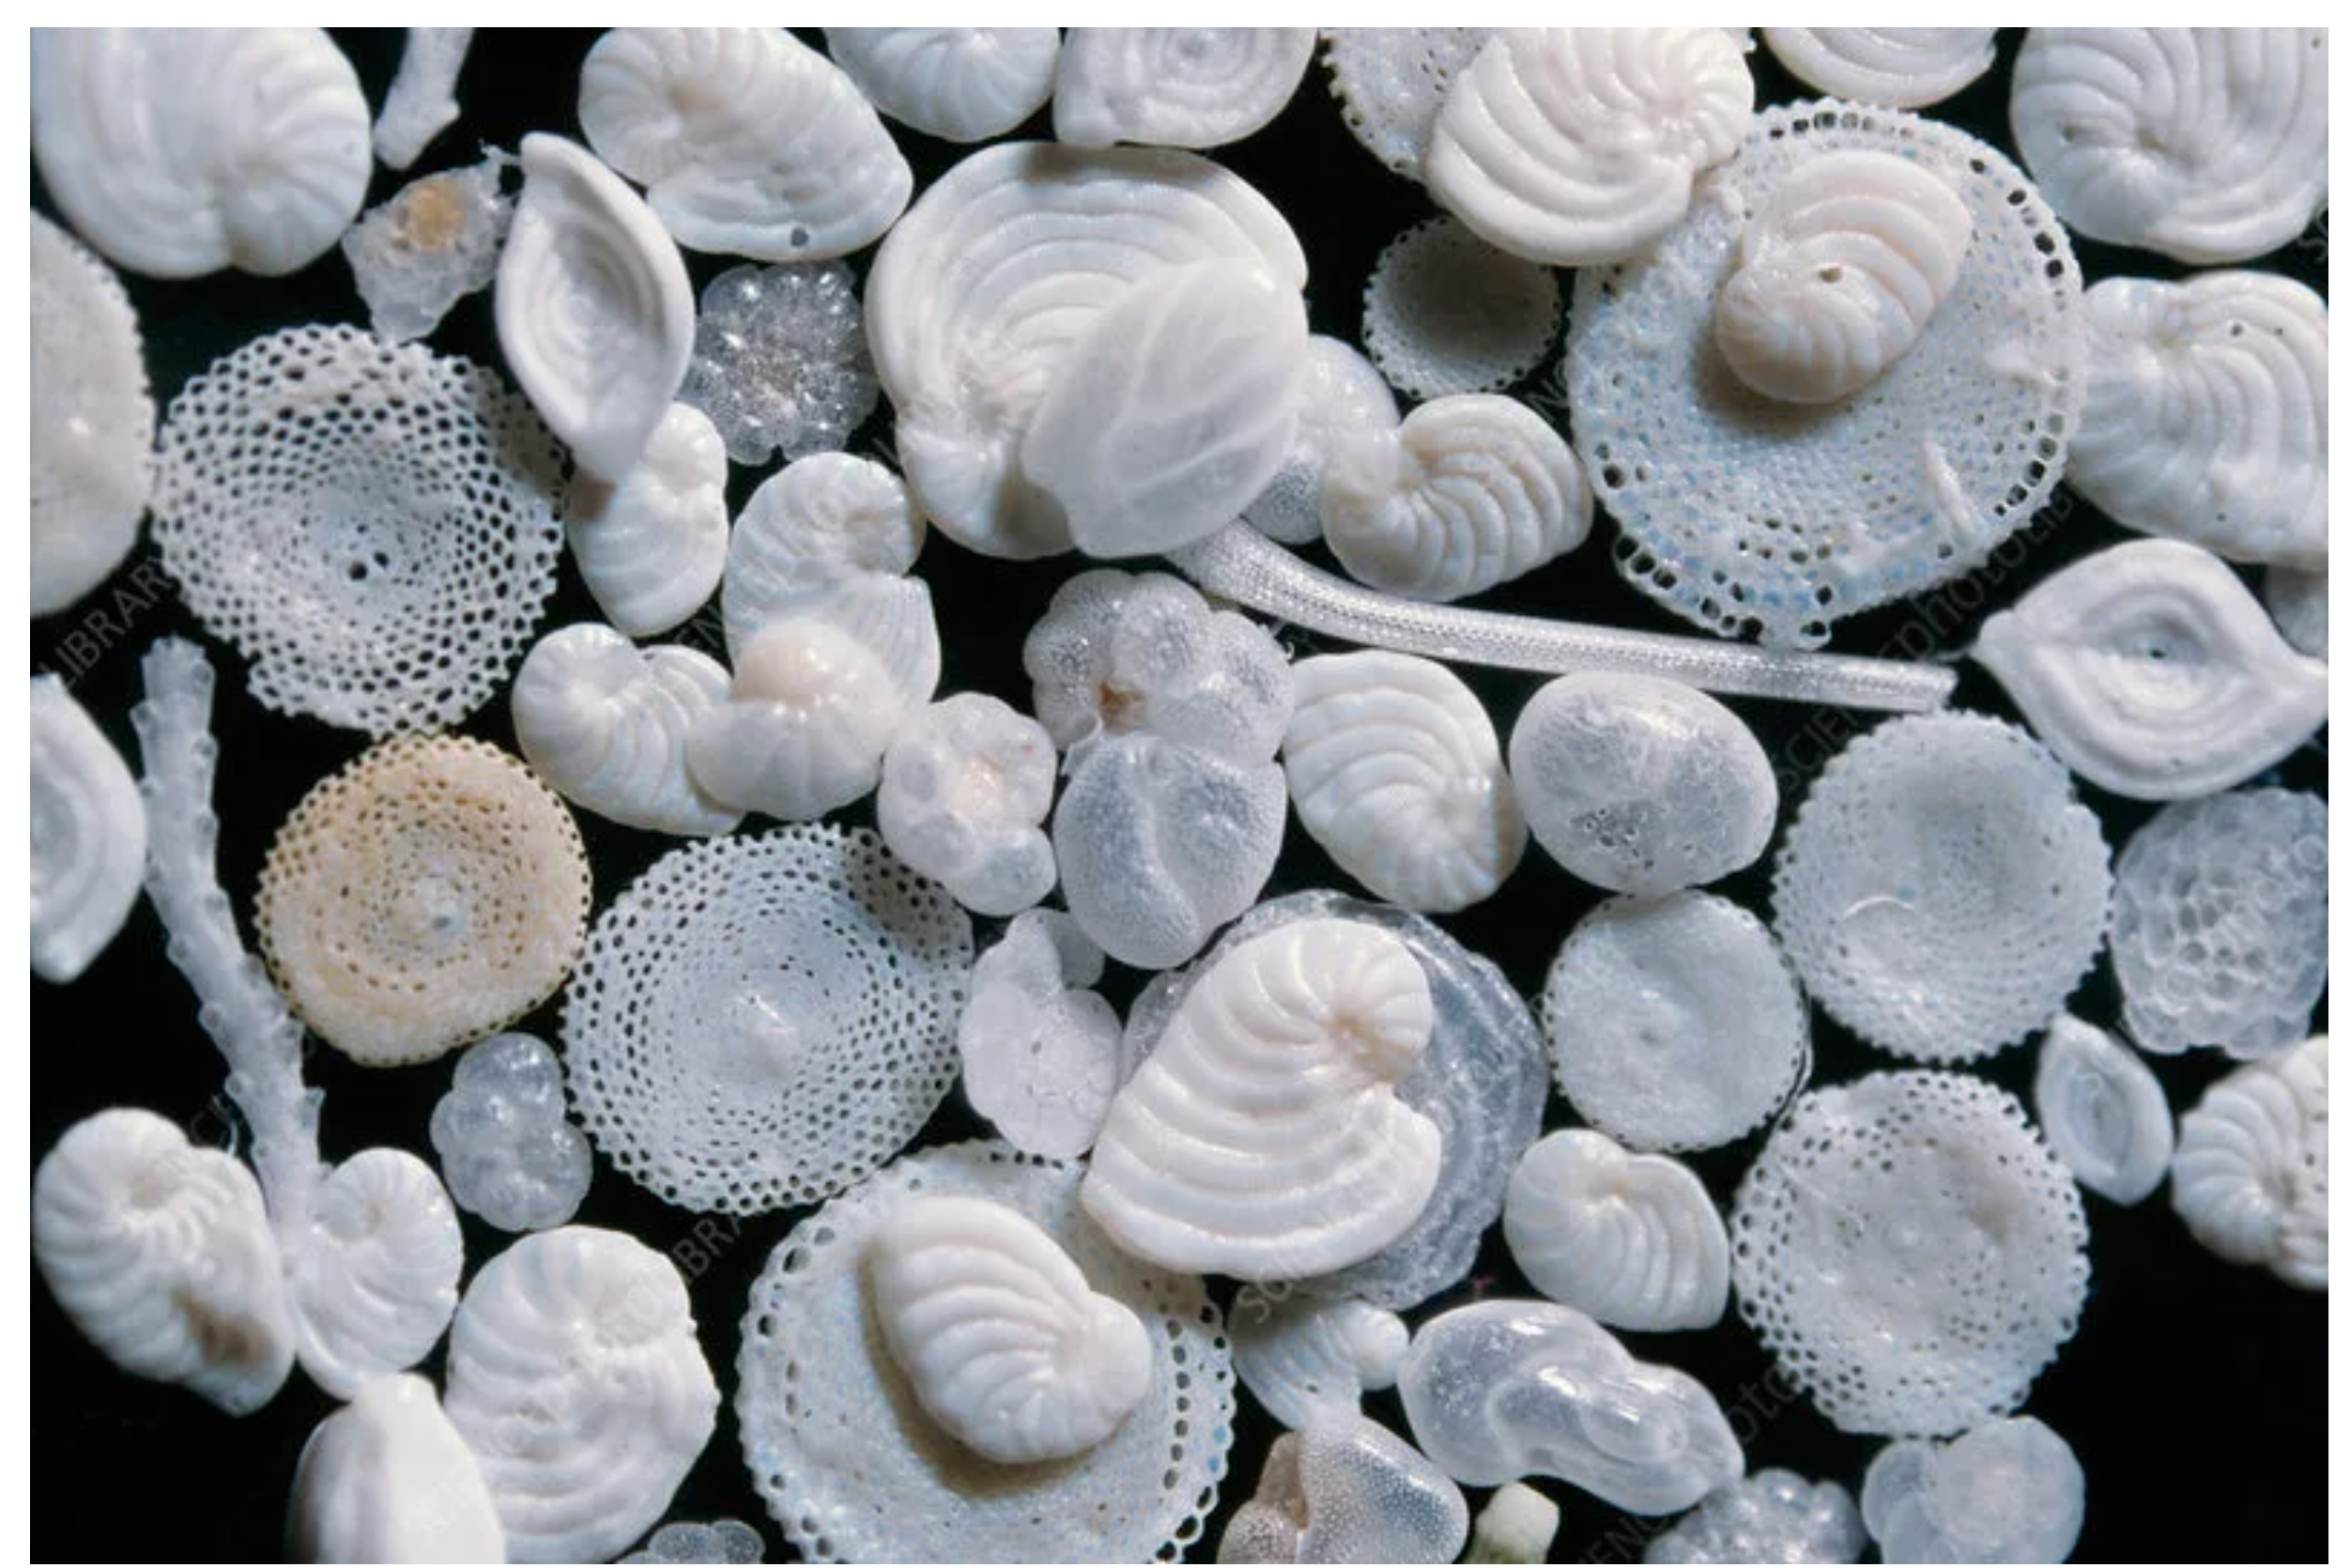
Foraminifera are a group of photosynthetic eukaryotes that form a wide variety of shell types as indicated in the photo above. The uniqueness of their shells and their abundance make them ideal for dating various fossil layers. Many forams exist for a few million years before going extinct, and each species is easy to identify by the shells they leave behind. Forams are an an example of ____.
Index Fossils
True or false: Most of the species that have ever existed on Earth have gone extinct.
True
True or false: The "Big 5" Mass Extinctions all involved world wide changes in climate conditions.
True
True or false: Background extinction occurs constantly.
True
True or false: Mass extinctions always follow adaptive radiations.
False
Which of the following periods is the earliest during which animals may have appeared?
A. Ordovician period
B. Cambrian period
C. Ediacaran period
D. Cryogenian period
D. Cryogenian period
What type of data is primarily used to determine the existence and appearance of early animal species?
Fossil data
The time between 542-488 million years ago marks which period?
Cambrian period
Until recent discoveries suggested otherwise, animals existing before the Cambrian period were believed to be:
Small and soft-bodied
Plant life first appeared on land during which of the following periods?
Ordovician period
Approximately how many mass extinction events occurred throughout the evolutionary history of animals?
5
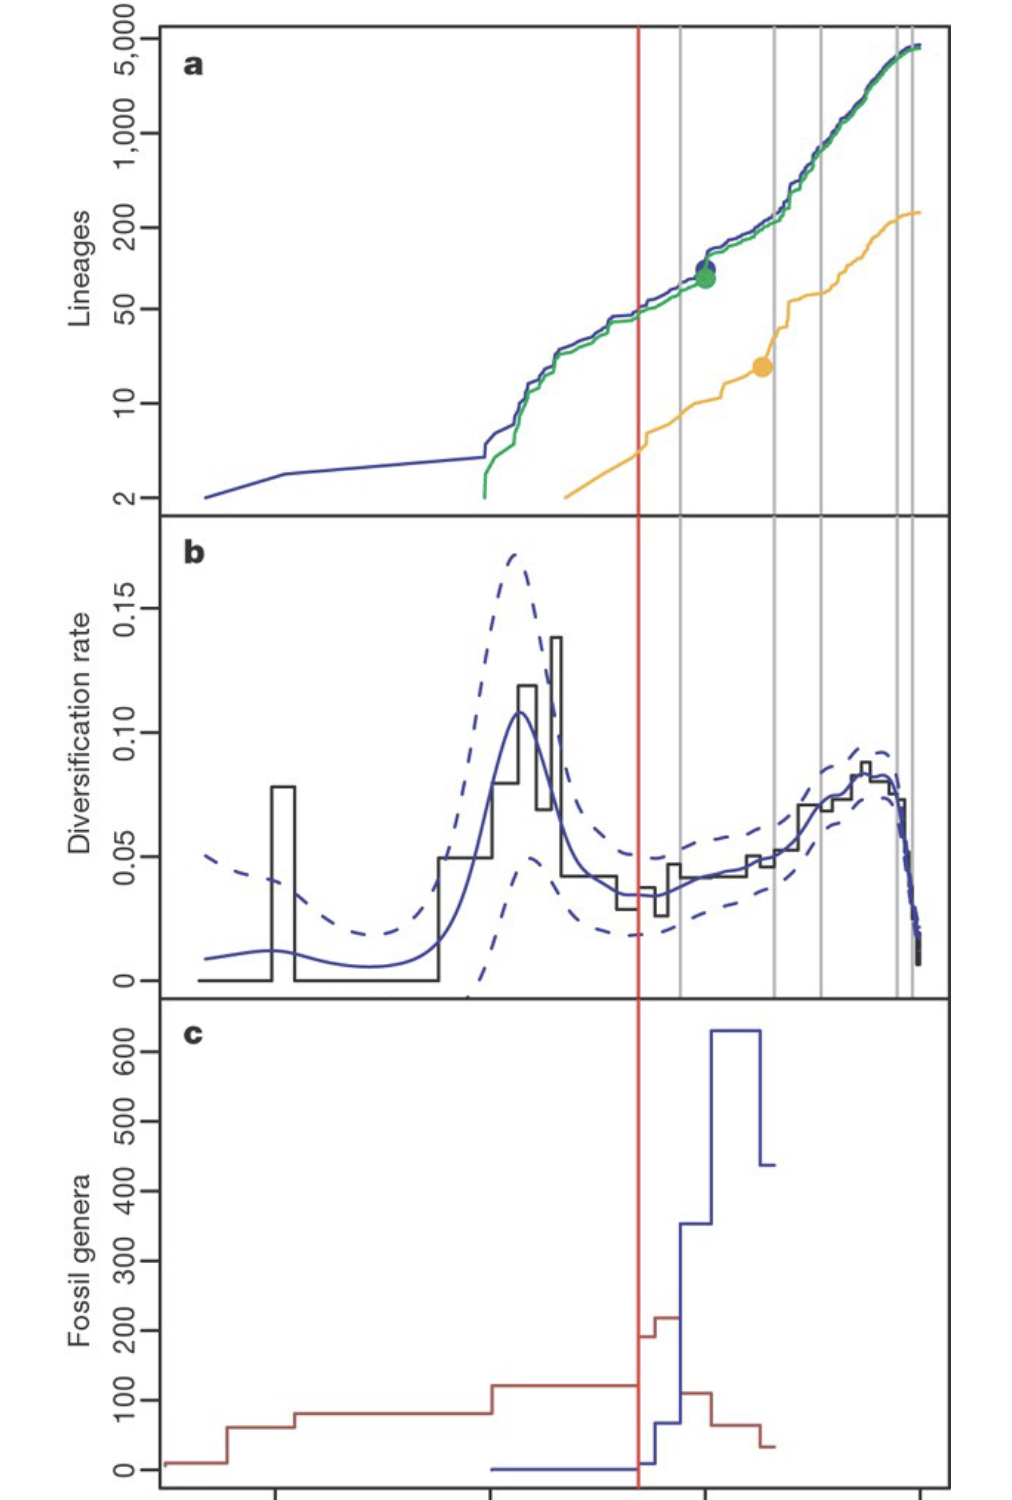
On the previous page is Figure 2 “Temporal patterns of mammalian diversification” from Bininda-Emonds et al (2007). The authors wished to answer when mammals diversified and whether the diversification of mammals coincided with the KPg Mass Extinction (KPg-ME) of 67 mya. (a) Suborder Lineage-through-time plot for all (blue), placental (green) and marsupial (orange) mammals. Filled circles indicate when resolution in the phylogeny dropped below 85%. (b) Net diversification rates in each time period (stepped line) and generalized additive model (GAM for short) estimate (solid blue curve, χ2 = 241.5, estimated degrees of freedom = 14.75, P ≪ 0.001, adjusted R2 = 77.6%, deviance explained = 20.3% with dashed curves representing the 95% confidence intervals). GAMs are a category of algorithms that allow you to estimate the effect size of numerous parameters. Think of parameters as being the settings for an app where the GAM is the app. (c) Counts of mammalian genera in each time period (Late Triassic to Late Eocene) according to the Unitaxon database. Red and blue lines represent genera whose families diversified predominantly before or after the Palaeocene/Eocene boundary, respectively. Throughout, the red vertical line is the KPg-ME boundary and grey lines separate Cenozoic time periods. The authors hypothesized that the KPg-ME was not important for the diversification for mammals. Instead, mammal suborder diversification began before the KPg-ME, flatlined during the KPg-ME, then rose again several million years after. Is their data consistent with this hypothesis? Explain
While, there were diversification peaks (graph B) before and after the KPg-ME, it seems that most of the diversification before was due to “lineages” (presumably, suborders) that kept a more or less constant rate of diversification starting around 100 mya (graph A), and most of the diversification after the KPg-ME was due to genera diversification (which is a lower taxon than suborder; graph C).

Above is Figure 2 from Meredith et al (2011) “Time scale of major mammalian divergence events during the past 110 My.” (A) Colored circles represent diversification events. Mammals can be represented by three orders: Monotremata (light purple), Marsupialia (dark purple), and Placentalia (light blue). Placentalia is further broken into four supergroups: Laurasiatheria (olive green), Euarchontoglires (dark blue), Afrotheria (pink) and Xenarthra (not pictured). Orange circles are various suborders of Marsupials and Placentals. 95% composite credibility intervals are shown as horizontal bars. Diversification rate shifts detected by (B) TreePar and (C) likelihood analysis of speciation and extinction rates (LASER) are denoted with green (rate increase) and red (rate decrease) arrows for rate shifts that were identified in analyses with both amino acid and DNA time trees. (D) Sliding window analysis of the net diversification rate (originations, lineage, and window) is based on mean divergence estimates from eight different analyses. The authors hypothesized that mammalian orders diversified before the KPg-ME, and that mammalian suborders diversified after the KPg-ME. Does their data support this claim?
The authors provide quite a bit of evidence of increased diversification 100-80 mya. But only one of their graphs (A) shows data of diversification rates from less than 40 mya. (Furthermore, the authors distinguish between order and suborder diversification, but taxonomy is a human construct. In other words, humans distinguish between order and suborder, not life. The preference between distinguishing between order and suborder diversification is entirely imposed by human sensibilities, not an artifact of life itself.) The authors have reasonably good evidence of one or two peaks before the KPg-ME as establishing many of the lineages of extant mammals. Their data are less robust in describing what occurred after the KPg-ME.
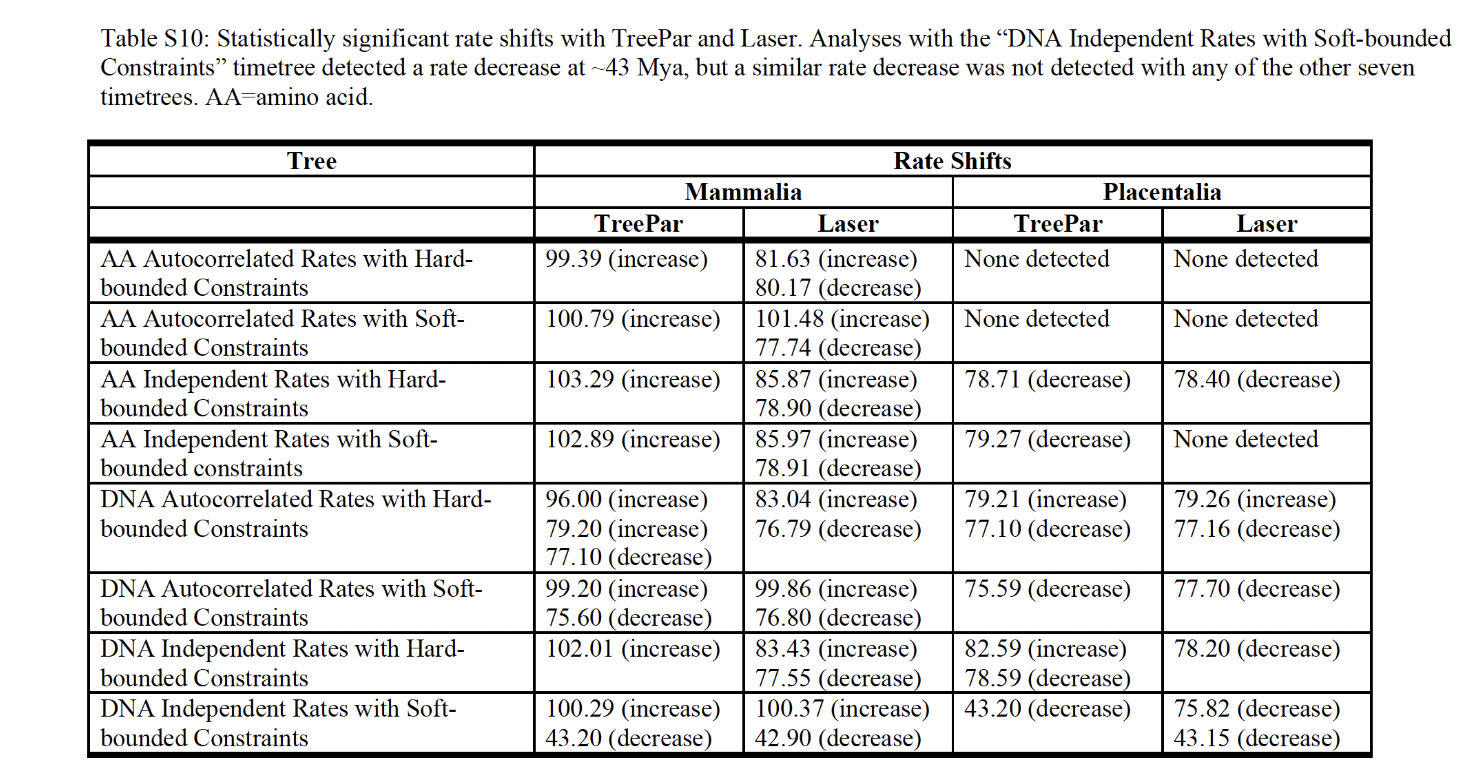
Above is Figure S10 (a supplemental figure) are the results used to inform parts (B), (C), and (D) of Figure 2. As you can see, they used several different parameters in constructing their estimates of diversification rate for the orders and supergroups. The authors argue that these results refute the hypothesis that order and supergroup diversification occurred at the KPG-ME boundary as presented by Bininda-Emonds et al (2007). Do you agree with their assessment? Explain.
The Bininda-Emonds et al (2007) paper didn’t make that claim, so that part is not supported. Most of their estimates center around either 100 mya or 80 mya. The authors interpreted this to mean that there were two diversification peaks prior to the KPg-ME. However, since these are models of the same data with different parameters, it would probably be better to add the confidence intervals together (this would expand the size of the CI unfortunately), to estimate that diversification occurred somewhere between 100 mya and 80 mya.
Meredith et al (2011) also argued that suborder and family diversification occurred after the KPg-ME because ecological niches were opened up. Do you agree with this conclusion? Explain.
They did not study the post-KPg-ME time frame as thoroughly as they studied the pre-KPg-ME timeframe so it would be difficult for them to support this claim. They did not illustrate an increase in diversification after the KPg-ME, so their claim about a mechanism for this diversification is not very stable
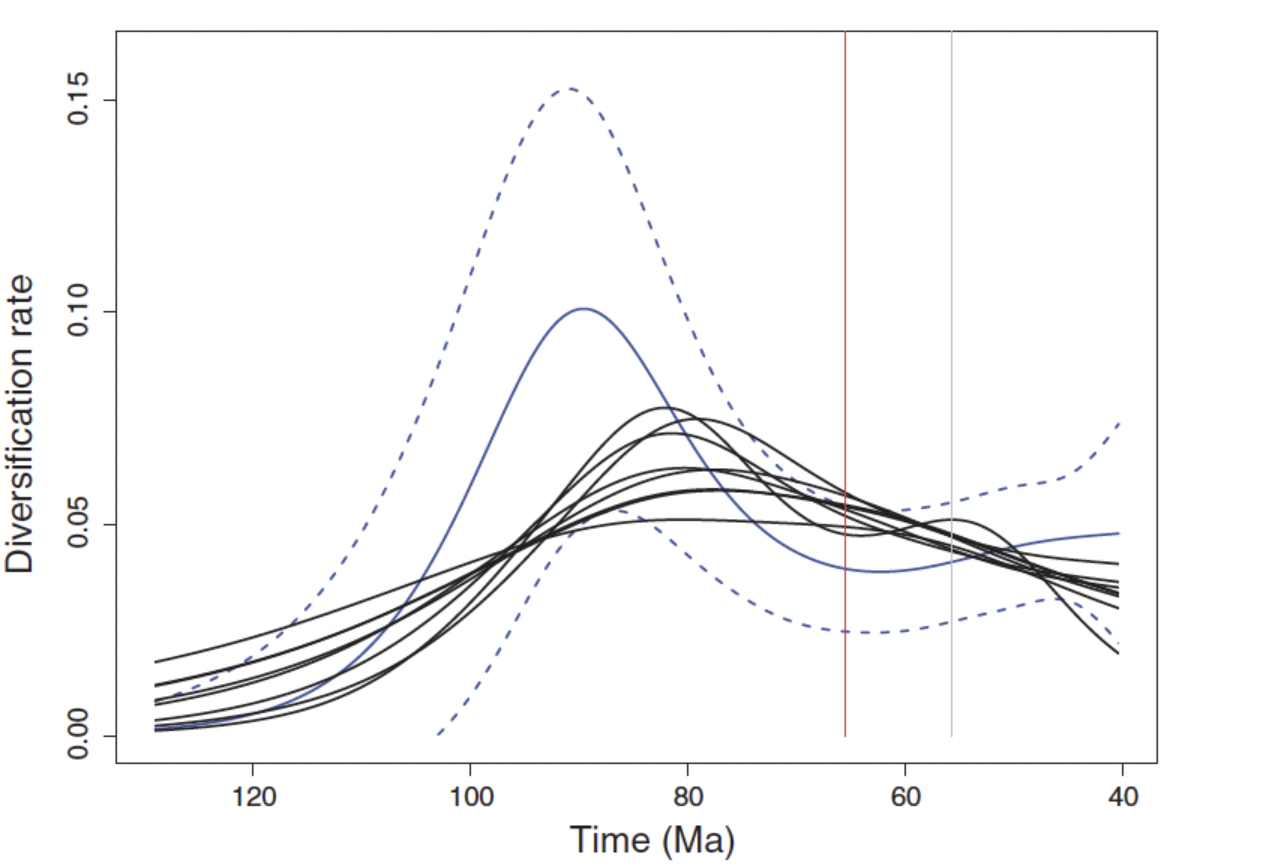
Bininda-Emonds and Purvis (2012) responded to this “criticism” by reanalyzing the data using both their own methods from both Bininda-Emonds et al (2007) and Meredith et al (2011). The reanalysis is presented as Fig. 1 “Net diversification rates through time inferred from GAMs.” The blue curve are rates from Bininda- Emonds et al.’s preferred dates; dashed curves, 95% confidence intervals. The black curves are rates from Meredith et al.’s eight supertrees. The red vertical line is the KPg boundary; gray vertical line, Paleocene-Eocene boundary. The authors wrote “In conclusion, contrary to the impression promoted in their paper, Meredith et al.’s data broadly confirm our delayed-rise scenario for the temporal pattern of extant mammalian diversification: high rates well before the KPg boundary in the KTR; stable, lower rates across the boundary; and a subsequent rise in rate sometime after the Paleocene.” Do you agree that the two papers draw the same conclusion using different methods? Explain.
Not fully. The peaks of the Meredith et al (2011) paper are slightly offset from the peak of the Bininda-Emonds and Purvis (2012) paper, and Meredith’s results do not indicate an increase in diversification after the KPg-ME. However, the Meredith results do broadly confirm that at least some mammal diversification occurred before the KPg-ME
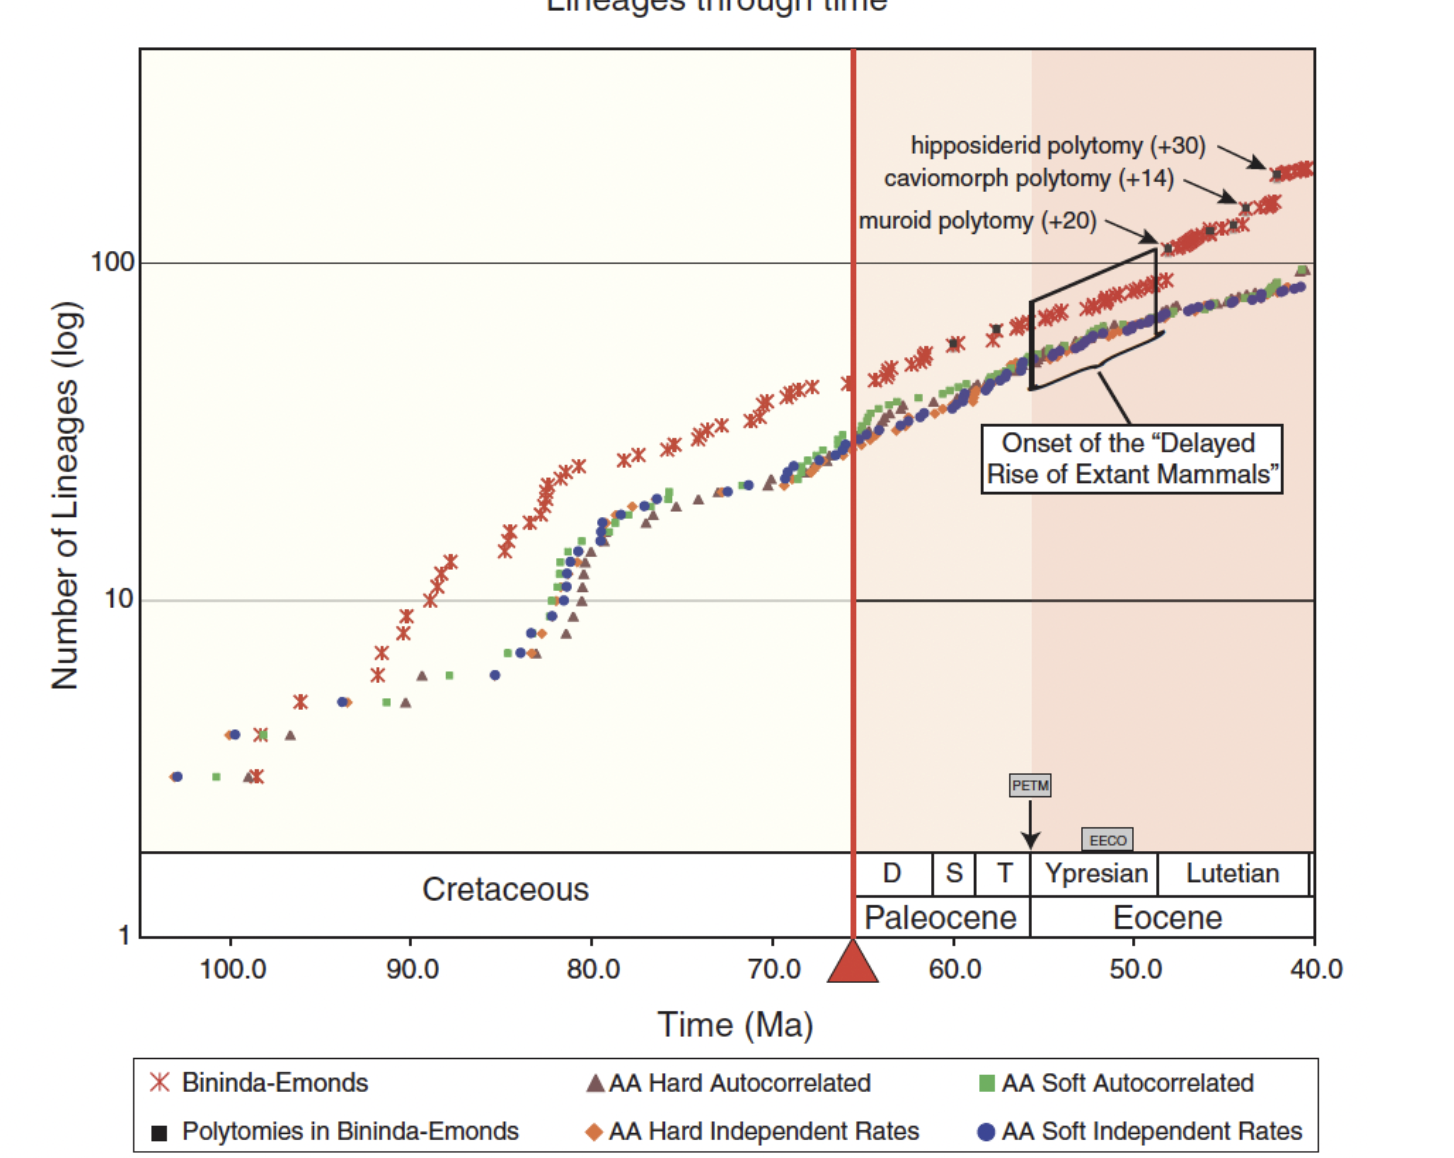
Science Magazine—the publisher for Meredith et al (2011) and the comments by Bininda-Emonds and Purvis (2012)—allows a “Response” paper to be written by the authors when someone “Comments” on their article. Both the “Comment” and the “Response” are published at the same time. Meredith et al (2012) chose to write a response. They wrote “In summary, Bininda-Emonds and Purvis (1) asserted that macroevolutionary differences between Meredith et al. (2) and Bininda-Emonds et al. (3) “are either simply not present or not statistically significant, but this claim is false and, instead, there are fundamental differences between the two studies that have profound implications for the overall pattern of mammalian diversification.” They presented their own lineage-through-time plot, Fig. 1 “LTT plots comparing the four amino acid time trees from Meredith et al. (2) to the MRP time tree of Bininda-Emonds et al. (3).” Meredith et al push for ~11 million years younger peak before the KPg-ME and an absence of diversification rate peaks after the KPg-ME. Do you agree that the conclusions of the papers are “fundamentally different?” Explain.
In general, the papers are not fundamentally different. They both acknowledge a diversification of mammals before the KPg-ME and that mammals continued diversifying after. Their disagreement is one of “degrees not direction.” A difference of ~11 million years is still within the uncertainty of both groups’ estimates. Both agree that mammals did not diversify immediately after the KPg-ME but took several millions of years to recover. Overall, both support that mammal diversification is not linked directly with the KPg-ME
Reflect on the tone of the argument between these two research groups. Both groups claim that the other either misrepresents or misunderstands their own conclusion. What exactly are the two research groups quibbling about? How do they resolve this conflict?
Multiple answers acceptable. Most of the debate seems to be about how accurate their specific conclusions are, and both authors do misrepresent the other (and sometimes their own) work. In general, there is more agreement than Meredith acknowledges but less agreement than Bininda-Emonds claimed.