Handout Week 9b: Standardization
1/11
There's no tags or description
Looks like no tags are added yet.
Name | Mastery | Learn | Test | Matching | Spaced | Call with Kai |
|---|
No study sessions yet.
12 Terms
How does standard deviation act as a ruler?
Finding the z-score (take the point, subtract mean, & divide by standard deiviation)
tells us how unusual the data point is
how many standard deiviations the point is from the mean
negative z-score: below the mean
positive z-score: above the mean
What is standardizing?
Comparing individual data values to their mean, relative to their standard deviation
using the z (z-score) formula → the result is called standardized values
unitless → allows for comparison
z = 0.6 (not unusual)
z = 4.5 (very unusual)

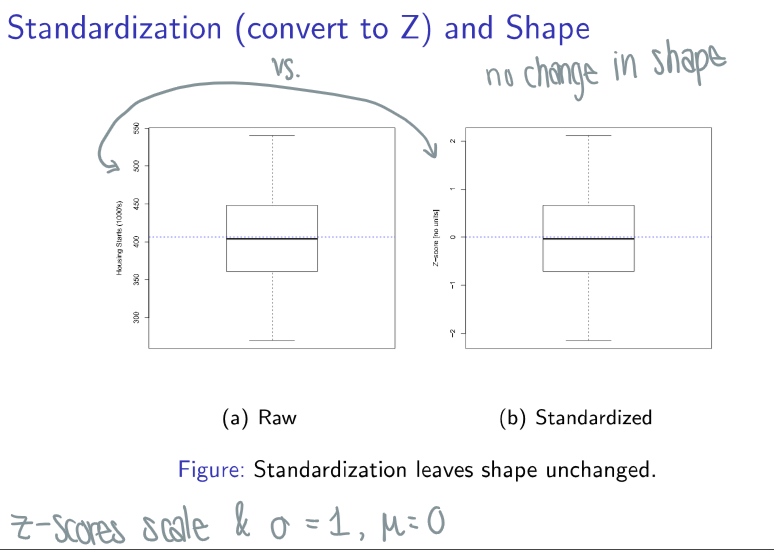
What happens to values when you standardize them (convert to z)?
There is no change in shape
standardizing shifts the mean to 0
rescales standard deviation to 1
What happens if you add a constant to each value?
Location: all shifts by the same amount
Spread: ± a constant → no impact on spread
What happens if you multiple or divide all the data values by a constant?
Location & spread: are divided/multiplied by the same value → changes spread
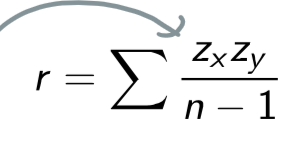
What is the correlation coefficient formula?
A numerical measurement of strength of the linear relationship between explanatory & response variables
sum of all z scores of x & y multiplied by eachother
divide by number of data points - 1
What are the 3 conditions for correlation?
Quantitative variables condition → not categorical
Straight enough condition →can calculate a correlation coefficient for any pair of variables (but it is only meaningful for linear associations)
Outlier condition → outliers can distort correlation (rxy) dramatically (can change the sign)
calculate correlation with & without outlier
What are the properties of correlation?
Unaffected by standardization (shift/rescaling)
are only meaningful for linear associations
the sign of rxy gives the direction of the association
correlation is always between -1 & 1
correlation near 0 is a weak association
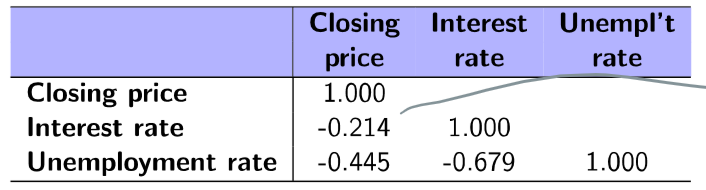
What are correlation tables?
Common format for summarizing linear correlations among a set of variables
useful when you have more than 2 quantitative variables
What is a lurking variable?
A hidden variable that stands behind a relationship & is the true determinant by affecting both variables
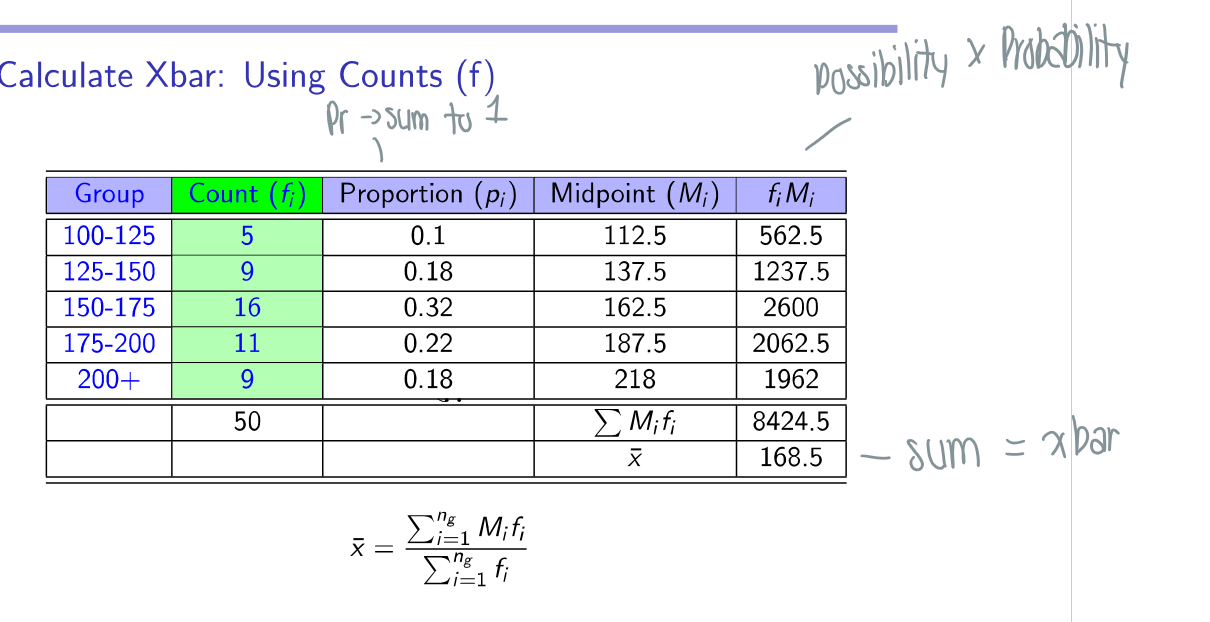
How do you calculate Xbar?
Sum of all possibilities x probabilities
same as finding expected value
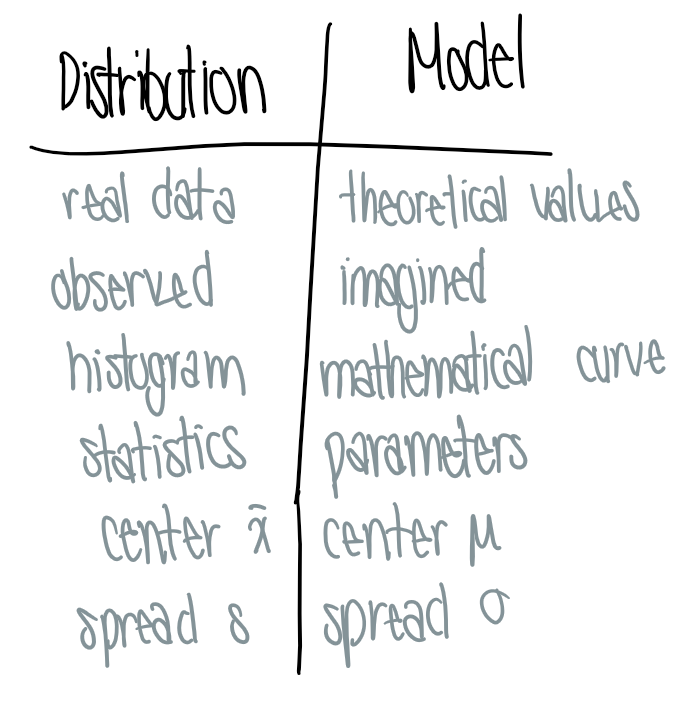
What is the difference between a distribution & a model?