BIOL123 (plant bio)
1/110
Earn XP
Description and Tags
Sem 2 2025
Name | Mastery | Learn | Test | Matching | Spaced |
|---|
No study sessions yet.
111 Terms
Steps of Darwin’s theory of evolution by natural selection
Individuals in a population are not identical.
This variation is at least partially heritable.
Most individuals die before reproduction.
Surviving individuals are a non-random subset (fitter organisms more likely to survive) and are not equally represented in subsequent generations.
Change through time, adaptation to specific environment as desirable traits are passed on.
Outline artificial selection for plants
When humans choose to breed plants with certain desirable traits, e.g. bigger/tastier. Can eventually result in many different versions of the same species, e.g. kale/broccoli/cabbage etc are all Brassica aleracea.
Differences between artificial and natural selection.
Artificial selection focuses on a few characteristics, natural selection acts on all of them. Artificial selection done by humans, natural selection by the environment
Outline case study for environmental selection for lead tolerance (evolution/adaptation)
Transplant experiments of bent grass showed that mine plants (high lead/zinc soil) grew slower in normal soil, pasture plants grew slowly and mostly died in mine soil, a few pasture plants survived in the mine soil (genetically related), natural selection can act quickly (less than 100 years).
Mine bent grass had adapted to high lead and zinc enviro.
What is Darwinian fitness
The ability to survive and reproduce. Alleles for more favourable (fitter) phenotypes will become more common over time (more survival and reproduction), natural selection.
Outline Punnet squares
Predicts genotype frequencies. Dominant alleles given as capital letters, override recessive alleles in heterozygotes. Recessive alleles only expressed in homozygotes.
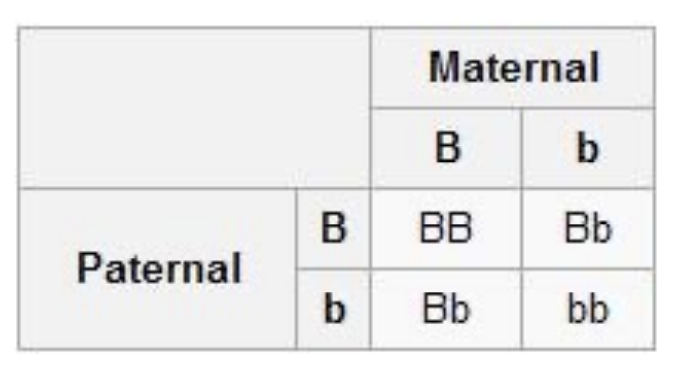
(important) Outline the Hardy-Winberg Law (equation)
p = frequency of B in population (dominant), q = frequency of b in population (recessive.
p² is the frequency of BB inds (homozygous for B allele).
2pq is the frequency of Bb inds (heterozygous).
q² is the frequency of bb inds (homozygous for b allele).

Alleles are in equilibrium - if frequency of one changes, so does the other.
If no evolution takes place, frequencies stay the same.
(important) Outline the Hardy-Weinberg Equilibrium (needed conditions for allele frequencies to stay the same)
No mutations (could change alleles).
Isolation (no movement in or out, could change allele frequencies).
Large population size (allele frequencies are probabilities, alleles more easily lost in small population).
Random mating (mate choice can alter allele frequencies).
No natural selection (some genotypes could increase fitness, increasing frequency of favourable alleles).
What is the purpose of the Hardy-Weinberg law
Changes in allele frequencies are always occurring in natural populations. Hardy-Weinberg Law is a tool to measure this change.
Example for how mutations provide variation
Viper’s bugloss - most flowers normally purple due to dominant allele (A), most plants AA. Recessive mutation (a) in one allele forms heterozygous cells (Aa). Transmission of recessive allele in gametes (pollen/ovules), some offspring are homozygous recessive (aa), have white flowers.
Outline gene flow (in terms of plants remember)
Movement of pollen or seeds into or out of a population.
Diminishes with distance, changes allele frequencies (introduce or take away), reduces differences between populations, counteracts natural selection (source pop can have diff selection pressures), increases genetic variation within populations, decreases genetic variation between populations.
Outline genetic drift (+ in large vs small populations)
Changes in gene pool as a result on chance.
In large pops, alleles with low frequencies can still be plentiful (e.g. in 1 million inds, 2 million alleles, “a” has 1% frequency = 20,000 copies). Negligible effect if some inds lost before reproducing, genetic drift probs not important.
In small pops, alleles with low frequencies very rare (e.g. in 50 inds, 100 alleles, “a” has 1% frequency = 1 copy). Allele would be lost if that 1 ind didn’t reproduce, genetic drift important (founder effect and bottleneck).
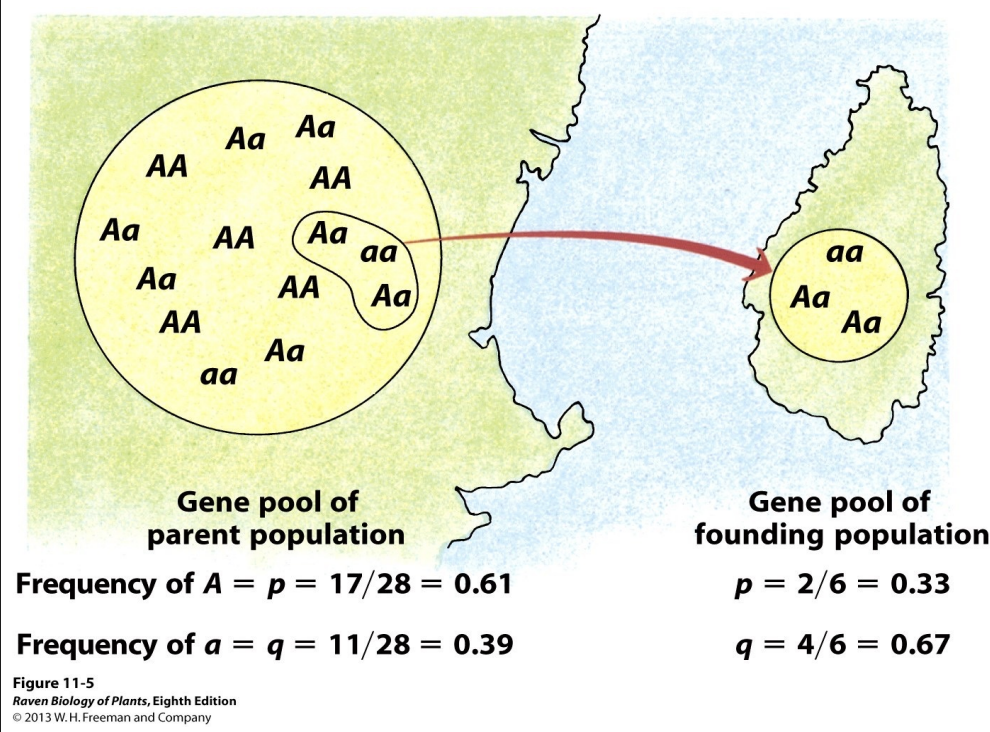
Outline the founder effect
Smaller population (subset) derived from a larger one may not have the same genetic composition. Some alleles can be overrepresented or absent.
Outline bottlenecks
Dramatic reduction in population size. E.g. from glaciation, floods, fires. Can change allele frequencies.
Example of a bottleneck in NZ
Much of NZ submerged during the Oligocene (26 million years ago), land area significantly reduced, bottlenecks in many species. Oligocene drowning.
Example of a general bottleneck
In past 1 million years, cycles of ice ages and interglacial periods have restricted available landmass, bottlenecks.
(not on exam apparently) Outline how natural selection acts on the phenotype
Phenotype = physical features/traits of the organism, what interacts with the enviro. Phenotype + enviro interactions = reproductive success. Natural selection acts on the phenotype, not directly on the genotype (but genotype has influence on the phenotype).
(not on exam apparently) Outline epistasis + example
When one gene affects the phenotypic expression of another gene, e.g. flower colour in foxglove caused by 2-step process of anthocyanin production and expression (range of shades between pink and white).
(not on exam apparently) Outline pleiotropy + example
One gene affects a number of phenotypes, because most proteins have multiple roles in cells and tissues. Many genes can get repurposed for different jobs.
Outline how the phenotype is the relationship between the genotype and the enviro + example
Environmental conditions can affect the phenotype (e.g. tree grows sideways in high winds), but not necessarily the genotype (e.g. offspring of tree will grow straight if not in high wind, sideways growing isn’t genetic).
(important) Outline phenotypic plasticity + example
Variation without a genetic basis in a trait that increases the fitness of the individual. E.g. shade-grown leaves are larger (but often thinner) than sun-grown leaves.
(important) Outline adaptation
Variation in traits that have a genetic basis - can be passed directly onto offspring.
(important) Example of adaptation
Potentilla glandulosa in North America - 4 ecotypes, coastal ones meadium sized and leafy, plant size becomes taller with fewer leaves at higher altitudes until the highest altitudes, which are very small very smaller leaves.
Allopatric speciation (geography separating populations), differences in inds maintained in pot transplant experiments (offsprings look like the parents and different from each other despite changed enviro conditions from parents), showing genetic basis of adaptation.
What is a species (basic definition)
“Kind”. Different kinds of organisms.
(Important) List the 3 species concepts
Biological, morphological, phylogenetic
(Important) Outline the biological species concept + Issues
Organisms are the same species if they have the ability to interbreed.
But many different plant species can form fertile hybrids. Can be difficult to breed organisms in labs.
(Important) Outline the morphological species concept + issues
Organisms that look similar are likely to be the same species.
Practical but can be confused by cryptic diversity, phenotypic plasticity, convergent evolution.
(Important) Outline the phylogenetic species concept
Can work out if organisms are the same species from shared evolutionary history.
Need to know evolutionary history (not always available or reliable, can’t find for most fossils).
Often combined with morphological species concept.
Outline allopatric speciation
Gene pools isolated by distance/habitat barrier. Populations evolve separately from diff selection pressures, become distinct.
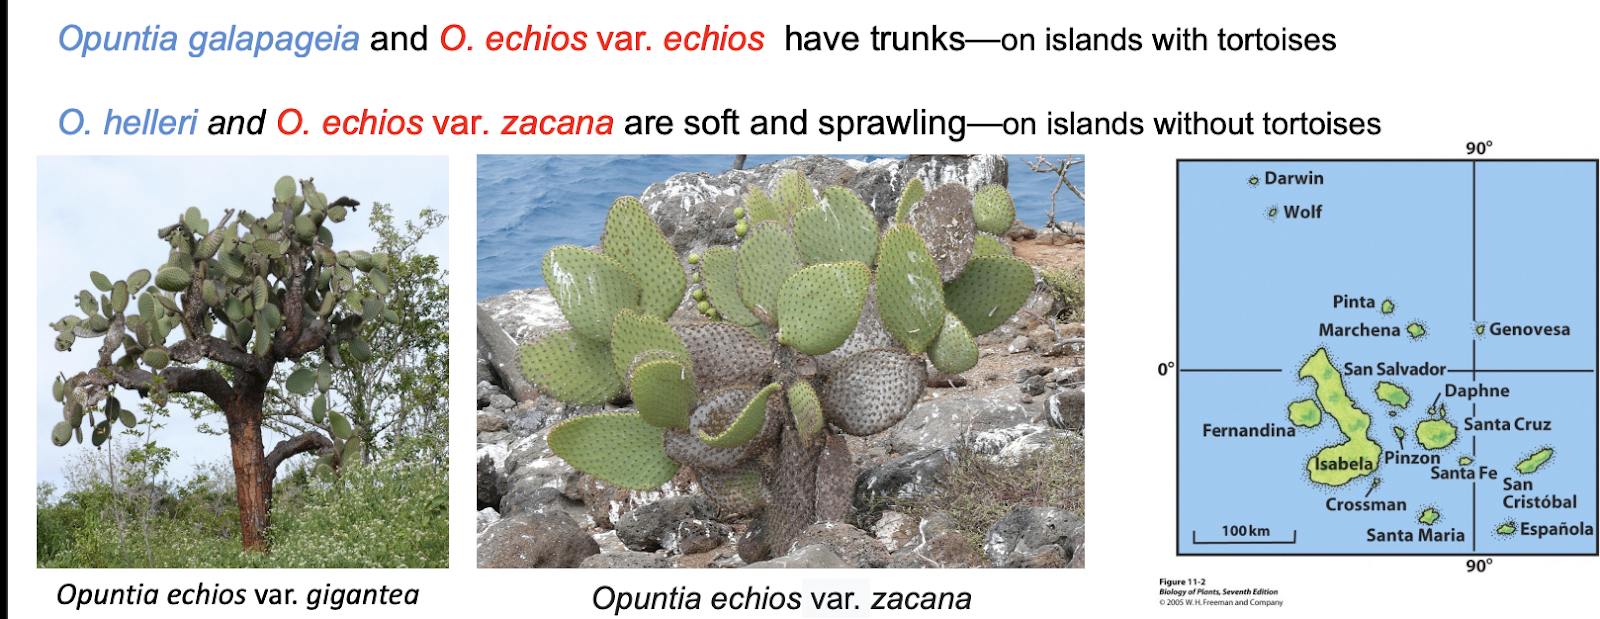
Example of allopatric speciation
Opuntia on the Galapagos - several species, 2 ancestors. On island with tortoises, Opuntia evolved to have large spines and grow taller than island without tortoises.
Outline sympatric speciation + example
Divergent evolution despite overlapping (or identical) range - not separated.
Can be from reproductive barriers e.g. phenology, polyploidy.
E.g. radiation of silverswords in Hawaii, different species in different habitats.
Outline phenology (sympatric speciation)
Phenology = time, e.g. flowering time. Some individuals may have better resources (more sun, water, nutrients) that cause them to flower earlier, and over time individuals could be flowering at such different times than those with worse resources that the groups don’t interbreed, reproductive barrier.
Outline polyploidy (sympatric speciation)
Ind’s genome can be duplicated (double amount of genes vs rest of the population), chromosomes don’t match up in gametes of non-polyploid individuals, reproductive barrier
Name 2 evolutionary models
Gradualism and punctuated equilibrium
Outline gradualism (evolutionary models)
As new species evolve, they become gradually different from their relatives (accumulate differences/mutations).
Species, genera, families, Kingdoms (general groups) evolve by this mechanism.
Outline punctuated equilibrium (evolutionary models)
Abrupt bursts of evolution in the fossil record. New species mostly evolve unique characteristics early in their history, and spend most of evolutionary time relatively unchanged. Existing species become extinct and new species form by rapid speciation in small, isolated populations, often from big events.
How do gradualism and punctuated equilibrium work together?
Things are evolving gradually, but certain events (e.g. warm periods) can drive rapid evolution, while other events (e.g. ice ages) can restrict evolution.
How does evolutionary modal/mode depend on selection pressure? (NZ example)
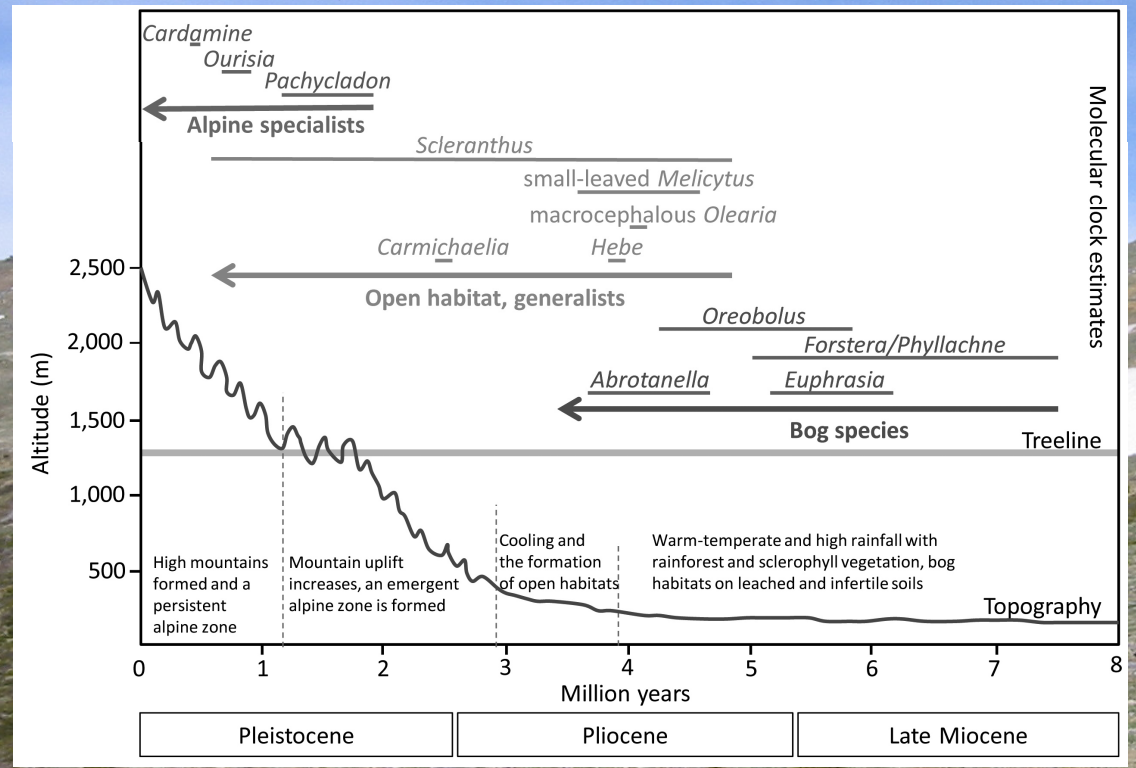
When NZ was low-lying with stable enviro, plants evolved and diversified gradually (gradualism), while mountains being uplifted in NZ later on drove faster evolution of species adapted to alpine environments (punctuated equilibrium).
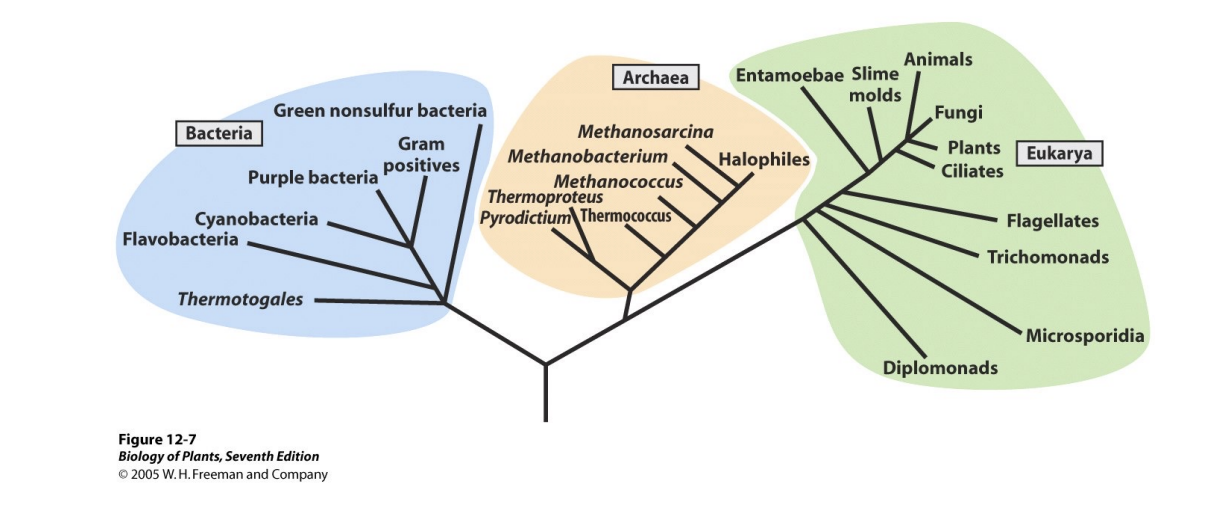
Outline systematics
Scientific study of biological diversity and evolutionary history.
Aim to discover all the branches of the tree of life (phenological trees).
Outline taxonomy
Identification/classification/naming (using rules of nomenclature). Science of organising things.
taxis = order/arrangement, nomos = science/law.
Most influenced by Carl Linnaeus.
Outline the Species Plantarum
Book by Carl Linnaeus, helped identify plants - start of binomial naming system, e.g. Olea europaea, Olea capensis.
Outline the binomial naming species (invented by Carl Linnaeus)
Species name includes the genus + specific epithet (e.g. Olea capensis). Latin binomials. Convenient, good for identifying plants, avoiding confusion/generic terms, overcoming language barriers.
Outline the International Code of Nomenclature for algae, fungi, and plants (ICN)
Earliest binomial name has priority over later names. Rules of ICN apply to plants, photosynthetic protists, and fungus-like organisms. Rules can be changed every 6 years.
Outline type specimens
Each species has a type specimen (specific specimen), housed in a herbarium. Basis for comparison with other specimens (e.g. to work out if other “species” actually the same species, etc). Paper trail back to a single, example specimen for the species.
Outline classification of organisms
Organisms grouped into broader taxonomic categories (ranks), hierarchy. Kingdom, Phylum, Class, Order, Family, Genus, Species.
Outline artificial classification
Classifying organisms based on generic features (not evolutionary relationships) e.g. trees/shrubs/under-shrubs/herbs, number of stamens (Linnaeus’ Systema sexuale). Convenient aid to identify, early classifications.
Outline the importance of Darwin’s Origin of the Species (1859)
Organisms seen as a product of their evolutionary history. Classifications then aimed to reflect evolutionary relationships - natural classification.
Outline natural classification
Classification reflects evolutionary (phylogenetic) history. Based on DNA sampling in modern times (more accurate than overall similarity, used in past). Differences of opinion have resulted in different classifications.
Outline convergent evolution
When different species evolve similar traits due to adaptation to similar selection pressures.
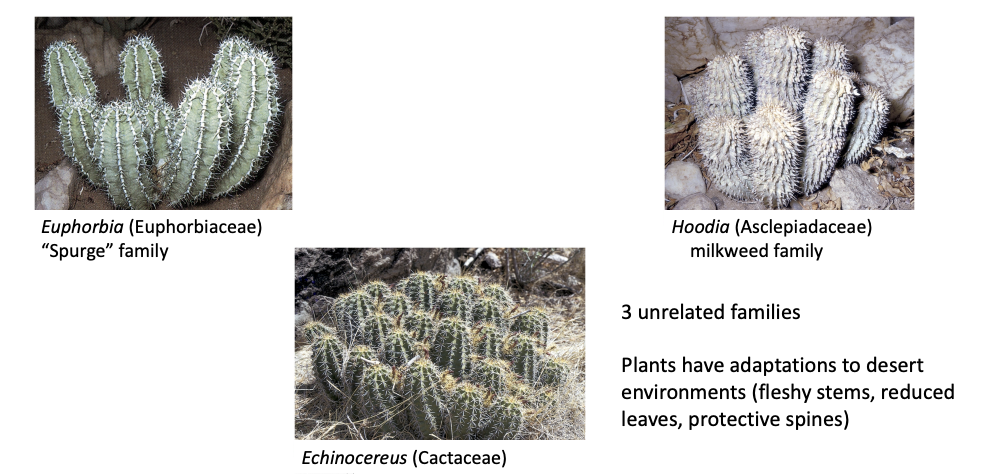
(Important) What are homologous features?
Features that have a common origin but not necessarily a common function (e.g. cactus spines are modified leaves, so cactus spines are homologous to leaves).
(Important) What are analogous features?
Features that have a common function but different evolutionary origins. E.g. spine of cactus (modified leaf) is analogous to a hawthorn thorn (modified stem).
Outline cladistic classification
Recognise groups of organisms that are monophyletic (entire group has a single common ancestor). Monophyletic groups = a clade.
What does classification aid in?
Communication, predictive power, identification, understanding the evolution of traits (features).
Why do estimates on how many plant species there are vary?
Because not all plants have been discovered or described (scientifically).
Corlett (2016) estimates of how many land plants there are
500,000 (450,000 angiosperms, 1000 gymnosperms, 10,000 ferns, 300 lycophytes, 17,000 mosses, hornworts, liverworts)
List 4 important angiosperm families
Asteraceae, orchidaceae, fabaceae, poaceae
Outline asteraceae (important angiosperm families)
Daisy family, ~33,000 species, ~2000 genera, e.g. Tikumu
Outline orchidaceae (important angiosperm families)
Orchid family, 28,000 species, ~765 genera, e.g. Pekapeka
Outline fabaceae (important angiosperm families)
Pea family, 19,000 species, ~750 genera, e.g. ngutukaka
Outline poaceae (important angiosperm families)
grass family, 12,000 species, 780 genera, e.g. Wi Kura
What is biodiversity?
Total biological diversity, taking into account genetic, species, functional, and phylogenetic diversity.
Can impact ecosystem function and ecosystem services.
What is species richness?
The number of species in a given area.
Condition for comparison of species richness
Samples need to be equivalent (same size areas)
What is species diversity?
Evenness, composition, and interactions between species.
Outline local variation in species richness
Patterns in species richness on scales from cm to a few km. Independent of climatic factors. Well studied by ecologists, experimentally controllable.
List 3 factors that cause local variation in diversity
The competitive exclusion principal, environmental complexity, intermediate disturbance hypothesis
Outline the competitive exclusion principal (factors that cause local variation in diversity)
2 species cannot occupy the same niche at the same time - one will be better at exploiting the most limiting resources, leading to the exclusion/decline of the other species.
Outline environmental complexity (factors that cause local variation in diversity)
More complex environments have more niches, more opportunity for specialisation, allows competitive avoidance (reduced niche overlap)
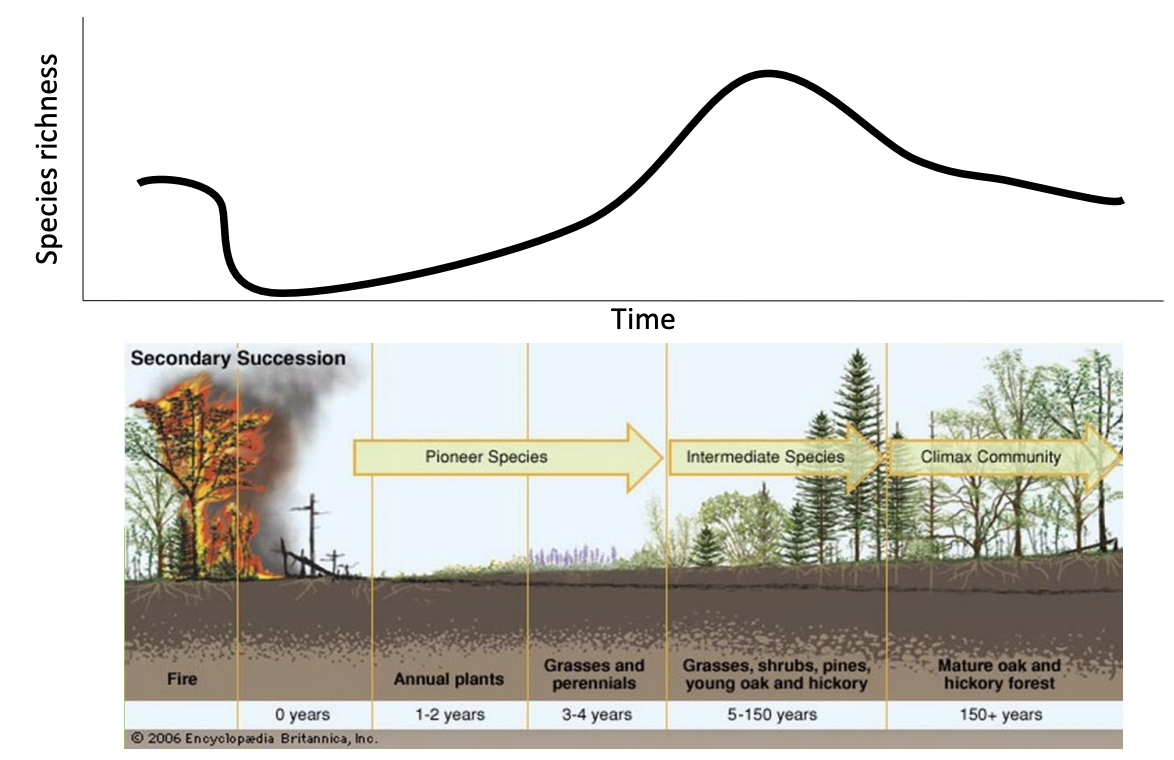
Outline the intermediate disturbance hypothesis (factors that cause local variation in diversity)
Local species diversity maximised when disturbance is neither too rare or too frequent. Ecological succession - intermediate = mix of pioneer and climax (most dominant) community species. Different levels of disturbances in different areas, overall diversity.
What is the main contributor to global variation in biodiversity/global species richness?
The latitudinal diversity gradient
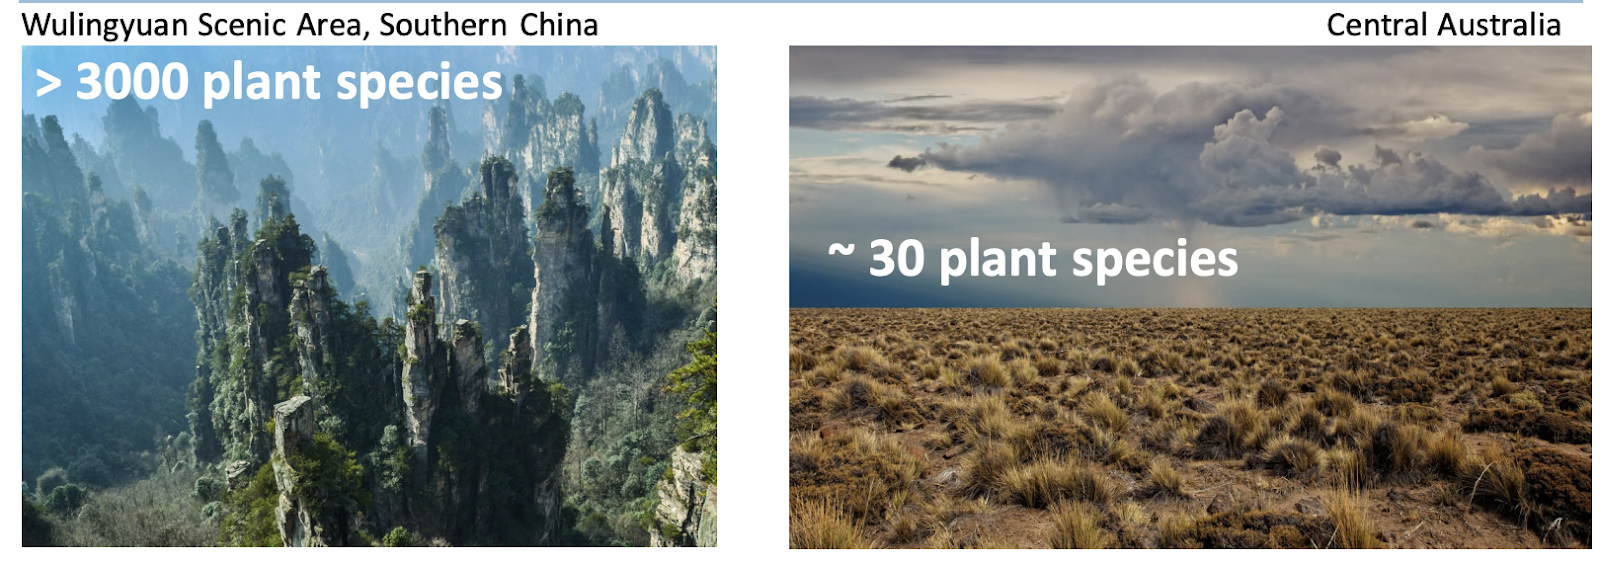
Outline the latitudinal species diversity gradient (the holy grail of ecology)
Species richness generally increases as latitude decreases (most diverse around the equator).
First recognised by Alexander von Humboldt in late 1700s. Cause still debated. Has existed for millions of years, evidence in fossil record (90 million years ago in Cretaceous, gradient of flowering plant fossils).
List 2 hypotheses for the latitudinal species gradient
The climate stability hypothesis, the competition hypothesis.
Outline the climate stability hypothesis (latitudinal species gradient)
Compared to higher latitudes, low latitudes (tropics) have experienced stable climates through geological time.
High latitudes experience harsher conditions, e.g. glaciations, floods, droughts. Likely to cause increase rates of extinction in higher latitudes.
Stable climate in the tropics provides better conditions for evolution and speciation. Innovation allows species to avoid competition, can evolve more quickly in stable climates.
Outline the competition hypothesis (latitudinal species gradient)
Stability means competitive biotic interactions are stronger in the tropics, leading to specialisation in smaller niches.
In temperate zones, disturbances are more common and drive evolution of high fecundity traits, promoting dominance and larger niches.
Thus more species in the tropics.
What is the ultimate cause of variation in diversity?
Evolutionary processes, time
What is a clade?
A group of species including a common ancestor and all descendants.
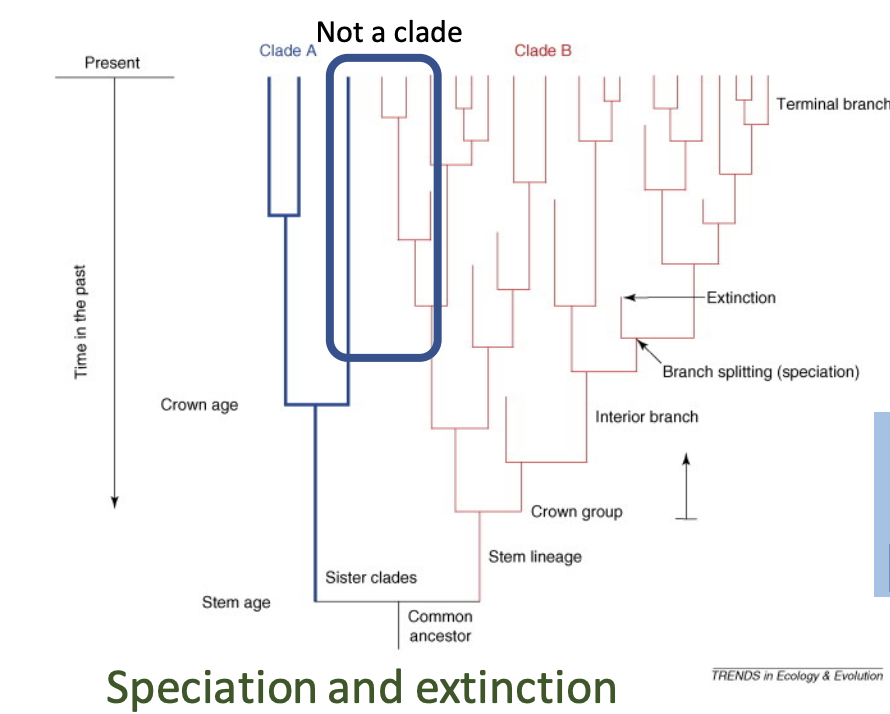
Outline the effect of time on the variation in diversity
Species richness is a consequence of speciation and extinction occurring within linages through geological time.
Rates of speciation and extinction vary across time and space, e.g. based on conditions, resources.
List 2 competing hypotheses for what controls diversification
Bounded diversification hypothesis, unbounded diversification hypothesis
Outline the bounded diversification hypothesis
First suggested by Raup (1972).
Finite nature of niche space places ecological limits on species diversity (bounded by limits). Competition for resources drives density dependent ceiling - any ecosystem can only hold so many species.
Prediction: diversification should slow as niche overlap increases between related species.
Outline evidence for the bounded diversification hypothesis
Species richness in linages is highly correlated with proxies for resource availability such as area and productivity (more resources = more niches = more species).
Species richness is stable for much of the fossil record (suggests a density dependent ceiling).
Species richness rebounds (up to the cap) following mass extinction.
Outline the unbounded diversification hypothesis
First suggested by Wallace (1878).
No ecological limits to species diversity. Evolution and ecological opportunity accompanies speciation (species can make their own niche), allowing new species to avoid competition. No limit to the number of species (infinite potentially). Communities always open to new species, rates of evolution determines diversification rate.
Predictions: Rate of evolution should be positively correlated with species richness. Clade niche size should increase or be partitioned more as diversity increases. Diversity should increase with time.
Evidence for the unbounded hypothesis
Different interpretation of fossil evidence
Even very diverse ecosystems are open to invasion from exotic plants
Natural rates of disturbance are so high that even if limits exist, no community will ever reach them
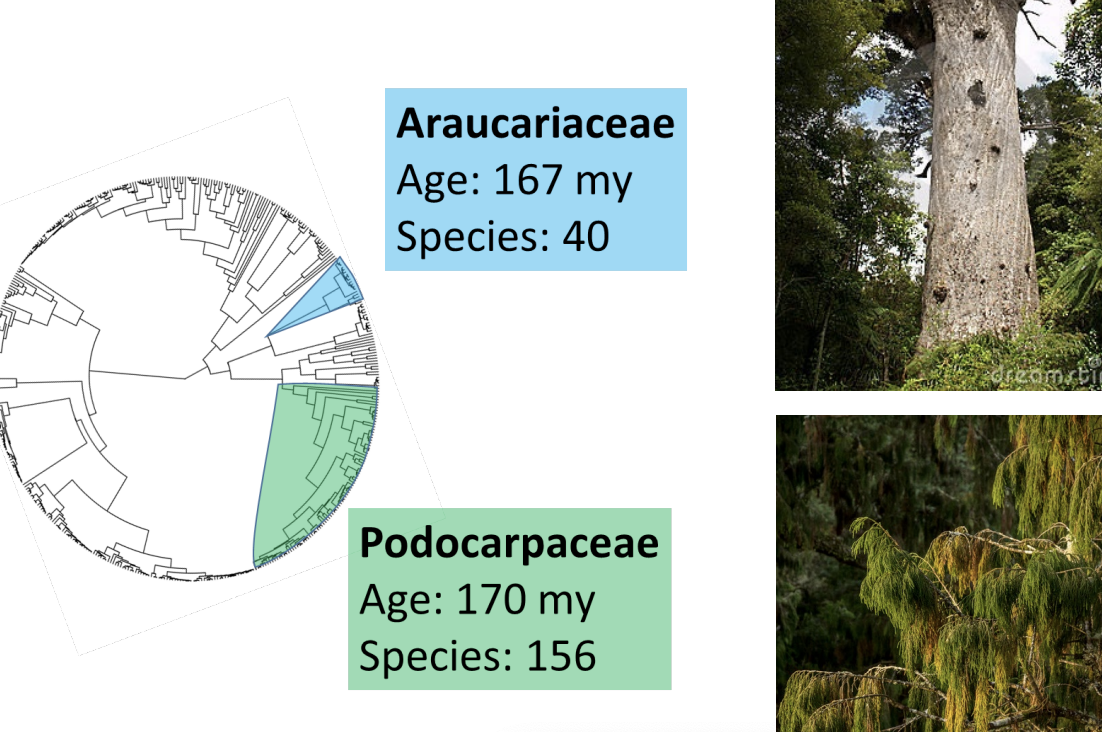
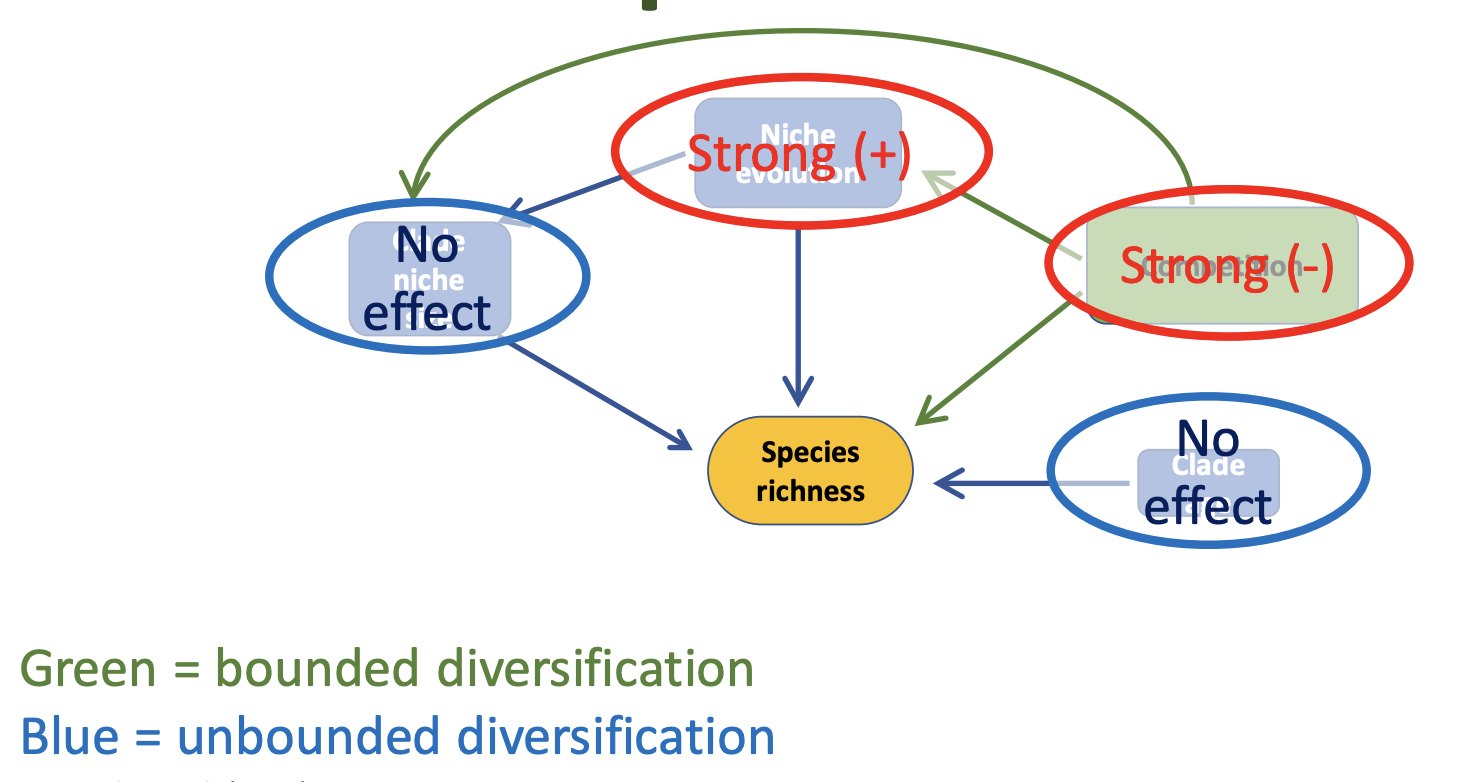
Outline study on the bounded vs unbounded diversification model
Bounded: does diversification slow as niche overlap increases between species.
Unbounded: is the rate of niche evolution positively correlated with species richness, does clade niche size increase or become partitioned more as diversity increases, does species richness increase with clade age.
Found clade niche size and age had no effect on species richness, but niche evolution (unbounded) had a strong positive effect, and competition (bounded) had a strong negative effect. Interplay.
Outline what energy is
Energy is the capacity to do work. Different forms: heat, light, chemical, potential, etc. Can be transferred from one form to another.
Outline energy flow in an ecosystem
All living organisms need a supply of energy to survive. Ecosystems need a source of energy - photosynthetic organisms.

Outline thermodynamics
The science of energy transformations. Energy is released (lost) as heat in many conversions (energy still in the system, but no longer available to do useful work).
Outline the 1st law of thermodynamics
‘Energy cannot be created or destroyed, only changed from one form to another’.
E.g. light energy converted to chemical energy (via photosynthesis). Chemical energy can be converted into another type of chemical energy when one animal eats another.
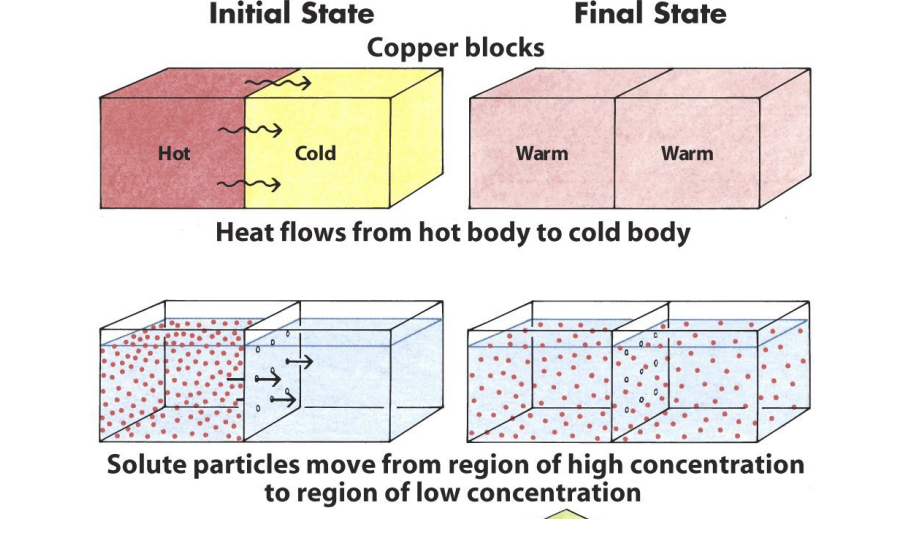
Outline the 2nd law of thermodynamics
‘In all energy exchanges and conversions, if no energy leaves or enters the system, the potential energy of the final state will always be less than the potential energy of the initial state’.
Energy generally lost in conversions. This law used to predict the direction of events involving energy changes.
Concentration of energy is dissipated, moves from high to low energy, towards equilibrium - state in which a system’s energy/matter is evenly distribution.
Outline entropy
The disorder or randomness of a system.
To maintain order requires energy inputs. Living systems continuously expend energy to maintain a position far from equilibrium (which has the highest entropy - systems constantly moving towards randomness).
Define exergonic
Potential energy of the final state is less than that of the initial state.
Exothermic reactions release energy.
Define endergonic
Potential energy of the final state is greater than that of the initial state.
Endothermic reactions require energy input.
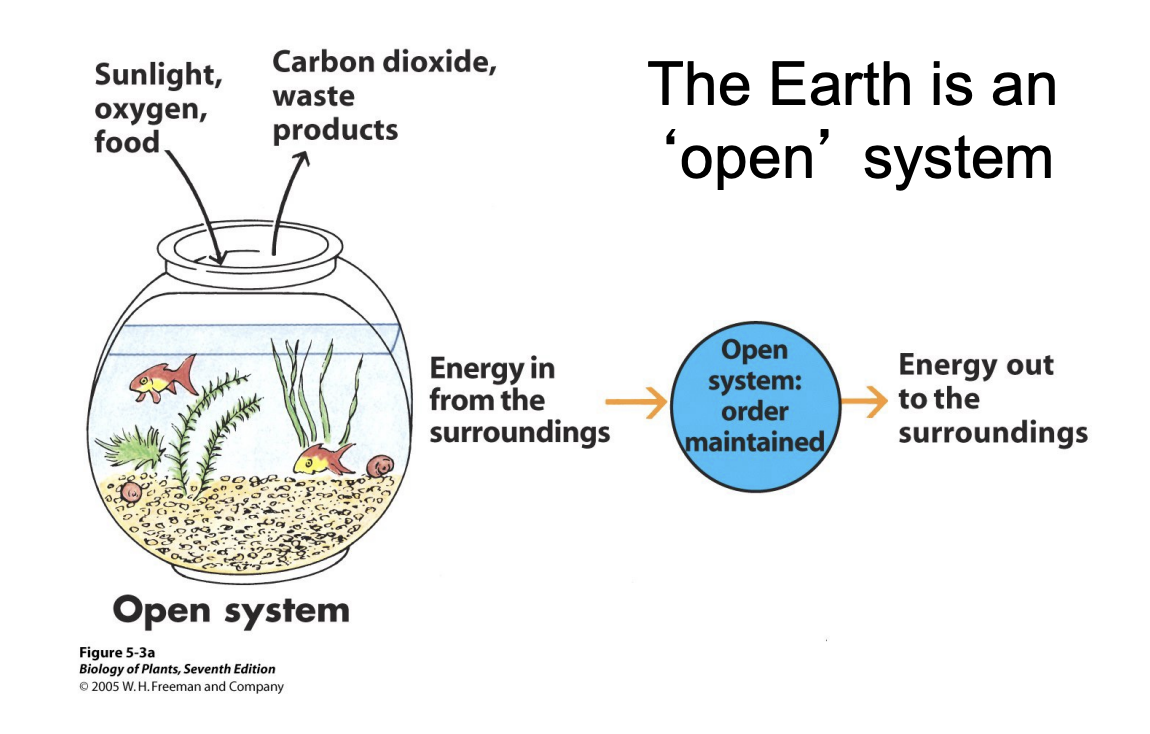
What kind of system is Earth?
An open system - because taking up external light energy, which is then converted to chemical energy via photosynthesis, other forms of energy released.
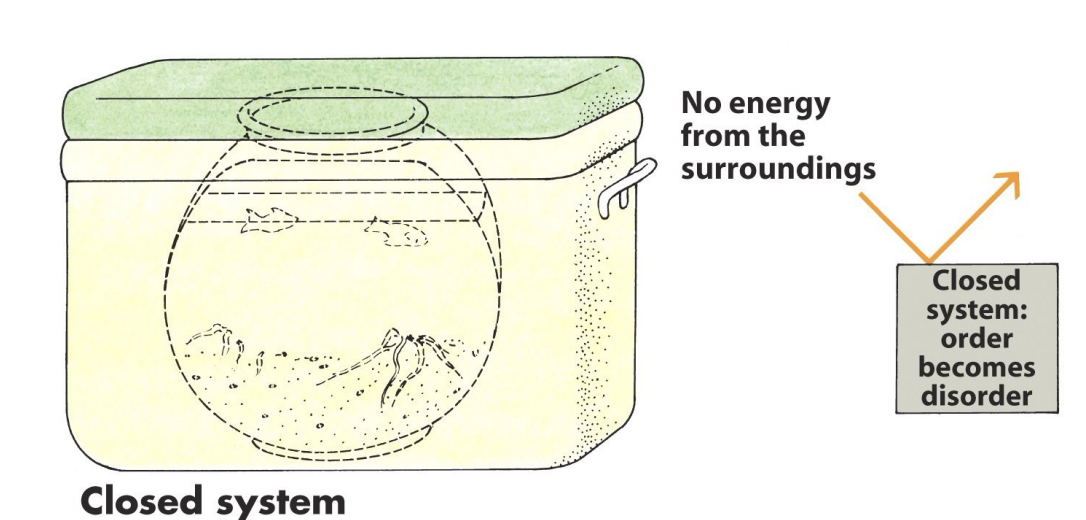
What kind of system is the Universe?
Closed system - no external sources of energy coming in.
Outline light energy
Formed from nuclear fusion reactions in the sun. 13×1023 calories reach the Earth each year. 30% reflected, 20% absorbed by atmosphere, 50% absorbed by Earth and converted to hear (drives global climate), <1% absorbed by plant pigments.
Light energy absorbed by chlorophyll (in photosynthetic organisms), converted to chemical energy, crucial for life on Earth.
Map of chlorophyll concentation of Earth
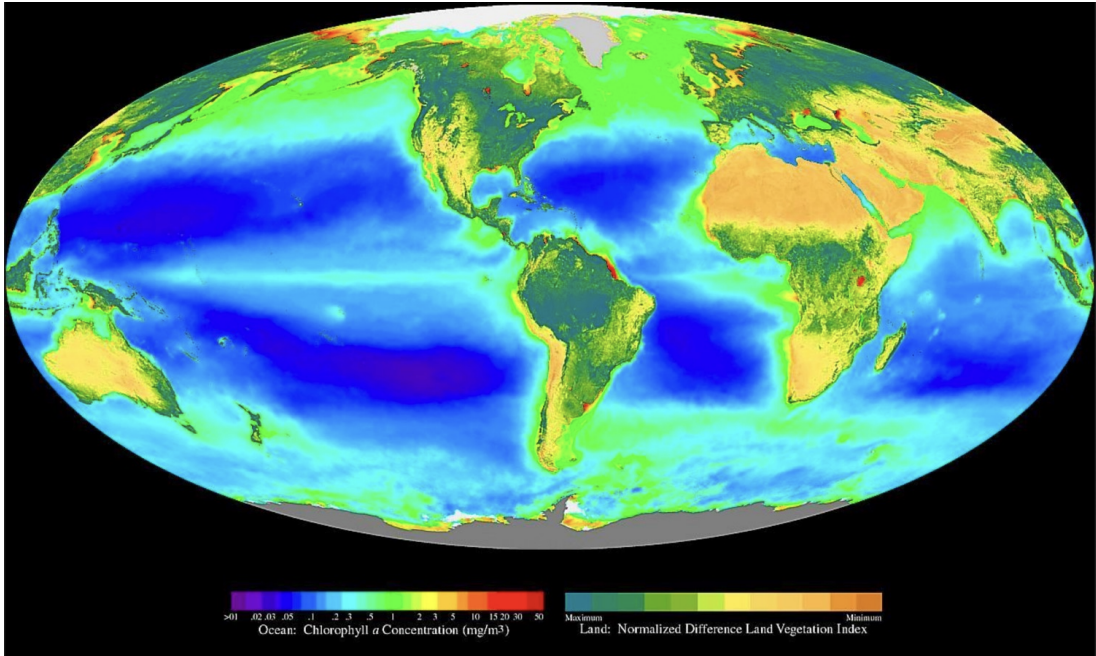
Highest amounts of photosynthesis at the equator, on land, around the continents, closer to the poles.
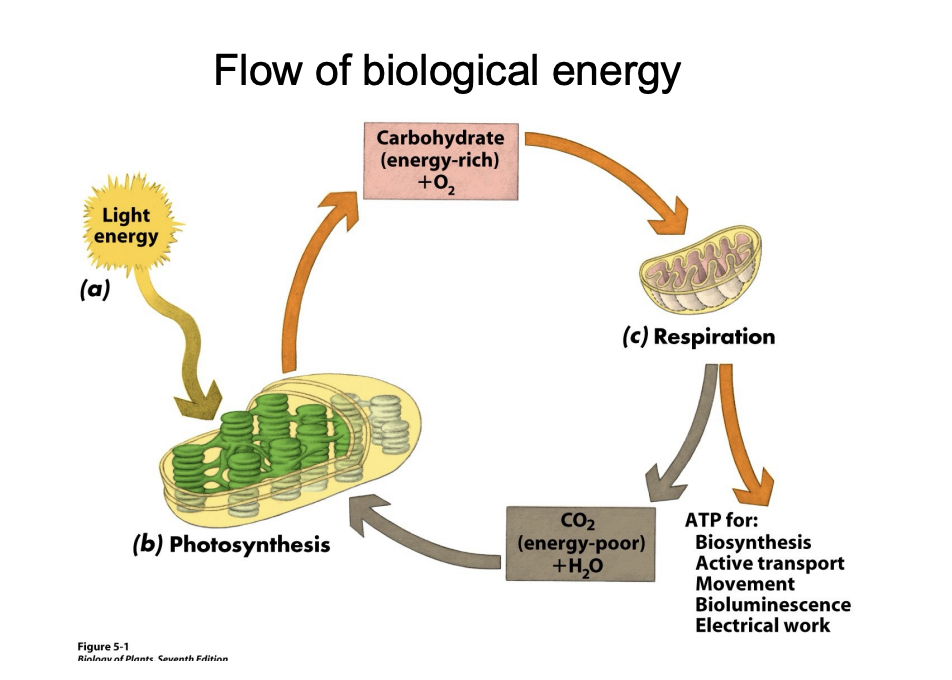
Outline the biological flow of energy
Capture light energy.
Convert to chemical energy - sugar.
Break down the sugar to useable chemical energy form.
Chemical energy drives biological processes (growth, movement, maintaining organisation, etc.)
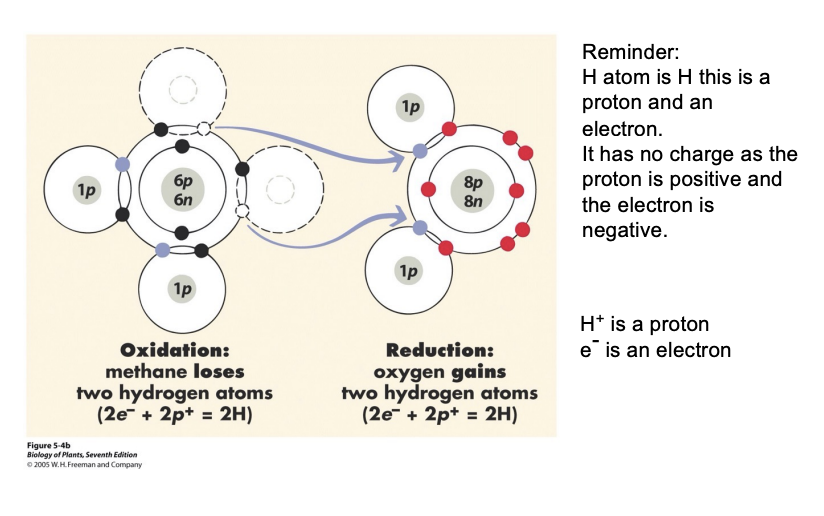
Outline oxidation-reduction (redox) reactions
Chemical reactions are energy transformations - energy stored in chemical bonds is transferred to newly formed bonds.
Essential for flow of energy and living organisms.
Redox reactions are simultaneous (reduction of one molecule accompanied by the oxidation of another).
OIL RIG: Oxidation Is Loss (of an electron), Reduction Is Gain (of an electron).
In biological reactions, an electron often travels with a proton (H atom)
Outline reduction of carbon dioxide
Photosynthesis (light to chemical energy): 6CO2 + 6H2O + Energy → 2 C3H6O3 + 6O2
H atoms (electrons and protons) transferred to carbon dioxide, carbon dioxide reduced to a three-Carbon sugar.
Water is oxidised to oxygen (loses H atoms).
Endergonic process (electrons moved to a higher energy level, energy input from light).
Outline oxidation of glucose
Respiration: C6H12O6 + 6O2 → 6CO2 + 6H2O + Energy
Glucose loses H atoms (electrons and protons), oxygen gains H atoms and is reduced to water.
Exergonic process - energy is released, electrons moved to a lower energy level.
Why is energy released in small steps?
If all energy from e.g. the oxidation of glucose was released at once, most would be as heat, killing the cell.
Mechanisms evolved so that energy is released in a series of small increments (less release of heat all at once).
Energy is stored in chemical bonds (e.g. in carbohydrates, which are gradually broken down, releasing energy at each step)