CHEM 2510 / Topic 3: Evaluating Analytical Data
1/40
There's no tags or description
Looks like no tags are added yet.
Name | Mastery | Learn | Test | Matching | Spaced |
|---|
No study sessions yet.
41 Terms
What are the 4 key types of systematic errors?
> Sampling.
> Method.
> Measurement.
> Personal.
Where does samp err come from, and how can you fix them?
> From non-rep spls / non-homog spls.
> Fix by true rep spl collection.
Where does method error come from, and how can you fix them?
> From non-ideal behaviour of reagents & reactions, e.g. incomplete reactions, instability of reagents.
> Fix by another analysis but w/ different method.
Where does measurement error come from, and how can you fix them?
> From instrumental limitations / calibration drifts.
> Fix by calibration.
Differentiate graduation vs. tolerance.
> Graduation = smallest, readable volume.
> Tolerance = max error allowed for total volume readable.
Example: A 50 mL buret (±0.05 mL) means your reading could be off by up to 0.05 mL — even if you read it perfectly.
Where does personal error come from, and how can you fix them?
> From human judgement / observation mistakes.
> Fix by more focus & consistent technique.
Where does random error come from, and how can you fix them?
> From tiny / uncontrollable fluctuations in physical & chemical environment / instruments.
> Not fixable but can reduce by taking more trials & statistical analysis.
An accumulation of random errors → fluctuating data around mean of dataset.
What is measurement uncertainty, and why does it exist?
> Uncertainty is doubt about how valid / accurate a result is.
> It exists b/c variables can’t be perfectly controlled → repeated results vary.
What are 2 statistical requirements for a measurement?
Measured value (best estimate) & its uncertainty (range of confidence).
> Statistically, what does uncertainty show?
> What are 4 key statistical expressions of uncertainty?
> Random difference in your measurements / how much your data scatter.
> Range, standard deviation (SD), variance (var), & confidence interval (CI). SD & CI matter the most.
What does statistical range mean?
> Range = difference b/w highest + lowest values.
What’s the equation of mean / average (x̄)?
x=\frac{\Sigma_{i}x_{i}}{n}
wherein:
> x̄ = mean
> xi = each individual data point
> n = number of values in the set.
As n increases, the sample mean (x̄) gets closer to the true population mean (µ). More data → better estimate → less random error.
What’s the equation of SD (s)? What does it tell you?
SD=\sqrt{\frac{\Sigma_{i}\left(x_{i}-\overline{x}\right)^2}{n-1}}
Tells you how tightly data spread around mean, wherein:
> s = sample SD
> xi = each individual data point
> x̄ = sample mean
> n = # of measurements.
As n increases, the sample SD gets closer to the true population SD (σ). Additionally, SD shows how big the scatter is from uncertainty, not why or where the random error happened.
What happens if we repeat an experiment many times?
Results cluster symmetrically around the mean → form a Gaussian (normal) distribution.
> What’s the formula for coefficient of variation (CV) or RSD?
> What does CV tell you?
RSD=\frac{s}{x}\cdot100
> How large the SD is relative to the mean.
Values are consistent → small RSD → higher precision.
Values vary a lot → large RSD → lower precision.
> What ‘s the null hypothesis?
> When do we reject it?
> Assumes both data sets come from pops w/ the same properties → any diff is due to random variation.
> Rejected if there’s less than a 5% chance that the population is similar.
What does the F-test & t-test compare?
> F-test = Compares the variances (σ) of two datasets if they are statistically different, not just numerically different.
> T-test = Compares the means (x̄) of two datasets if they are statistically different, not just numerically different.
> What’s the formula for Fc?
> What’s the difference b/w Fc vs. Ft?
> When do you reject the null & when do we fail to, in regards to F-tests?
> What does a big & small F mean?
F_{c}=\frac{s_1^2}{s_2^2} , where s1 > s2 to ensure F ≥ 1.
> Fc = from your data ; Ft = from stats table (cutoff point).
> If Fc > Ft → reject the null ; if Fc ≤ Ft → fail to reject null.
> If big F → precision differs ; if small F → precision same.
> What’s CI?
> Why do we use CI?
> What are the 2 key variables for CI, and why?
> Range of values that likely contains the true value of a measurement.
> Used b/c repeated measurements vary (random error) → mean may ≠ true value.
> Precision of individual measurements (smaller spread → narrower CI) ; # of measurements (more data → narrower CI).
> What’s the formula for CI?
> What does t do?
CI=x\pm\frac{ts}{\sqrt{n}}
> t = scales the SD when finding the confidence interval.
50% CI = “I only wanna be 50% sure, so I’ll draw a smaller zone around my mean.”
95% CI = “I wanna be 90% sure, so I’ll draw a bigger zone.”
What are the formulae for s of the x̄ (µi) & var (v)?
\mu_{i}=\frac{s_{i}}{\sqrt{n_{i}}}
v=\left(s\right)^2
What determines if you need to reject the null, in regards to the t-test?
If tc > tt → reject H0 = difference is statistically significant.
What are the 3 cases of the t-test in both what they compare & what they ask?
> (1) Comparing x̄ to a known value, (2) comparing x̄1 to x̄2 w/ replicate samples, and (3) comparing two methods where samples are not duplicated.
> (1) Does x̄ compare to accepted answer µ? (2) Does x̄1 agree w/ x̄2 w/in uncertainty? (3) Do the two methods agree w/ uncertainty?
How do you check if x̄ compares to accepted answer µ?
> Calculate CI.
> If range includes µ → data is considered the same.
How do you check if x̄1 agree w/ x̄2 w/in uncertainty if F-test determines similar SDs (not significantly different)?
> SDs of two datasets → spooled.
> Calculated tc, 2a.
> If tc, 2a > tt → reject H0 = difference in mean is statistically significant.
What’s the formula for spooled?
s_{pooled}=\sqrt{\frac{\Sigma_1\left(x_{i}-x_1\right)^2+\Sigma_2\left(x_{j}-x_2\right)^2}{n_1+n_2-2}}=\sqrt{\frac{s_1^2\left(n_1-1\right)+s_2^2\left(n-1\right)}{n_1+n_2-2}}
What’s the formula for tc, 2a?
t_{c,2a}=\frac{\left\vert x_1-x_2\right\vert}{s_{pooled}}\sqrt{\frac{n_1n_2}{n_1+n_2}}
How do you check if x̄1 agree w/ x̄2 w/in uncertainty if F-test determines dissimilar SDs (significantly different)?
> Find tc, 2b.
> Find df2b → round df to nearest integer.
> Compare tc, 2b to tt @ 95% confidence using appropriate df.
What’s the formula for tc, 2b?
t_{c,2b}=\frac{\left\vert x_1-x_2\right\vert}{\sqrt{\left(u_1^2\right)+\left(u_2^2\right)}}
What’s the formula for df2b?
df=\frac{\left(u_1^2+u_2^2\right)^2}{\frac{u_1^4}{n_1-1}+\frac{u_2^4}{n_2-1}}
How do you check if two methods agree w/ uncertainty?
> Find the differences (d) between each measurement.
> Find davg.
> Find the s, using d (instead of x) and davg (instead of xavg).
> Find the tc, 3.
> Compare tc, 3 to tt @ 95% confidence using normal df.
What’s the formula for tc,3?
t=\frac{\left\vert\overline{d}\right\vert\cdot\sqrt{n}}{s_{d}}
What’s the purpose of the Grubbs test?
Decides if an “odd-looking” value is truly an outlier or just random noise. Used when you have small n, since outliers can mess mean up.
How do you check for an outlier?
> Check if there is a recorded blunder. If recorded blunder → remove. If none → Grubbs.
> Calculate x̄ and s.
> Find the “most extreme” value.
> Compute Gc.
> Compare to table value @ 95% confidence.
> If Gc > Gt → reject H0 → it is an outlier → remove it.
What’s the formula for Gc?
G_{c}=\frac{\left\vert x_{ex}-\overline{x}\right\vert}{s}
What does propagation of uncertainty from random error (efinal) tell you?
How errors from different measurements combine to affect the final result of a calculation.
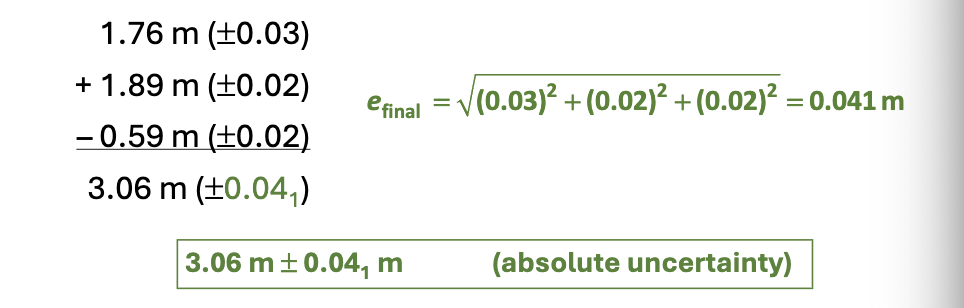
How do you calculate efinal via addition & subtraction?
e_{final}=\sqrt{\Sigma_{i}e_{i}^2}
How do you calculate efinal via multiplication & division?
\%e_{final}=\sqrt{\Sigma_{i}\%e_{i}^2}
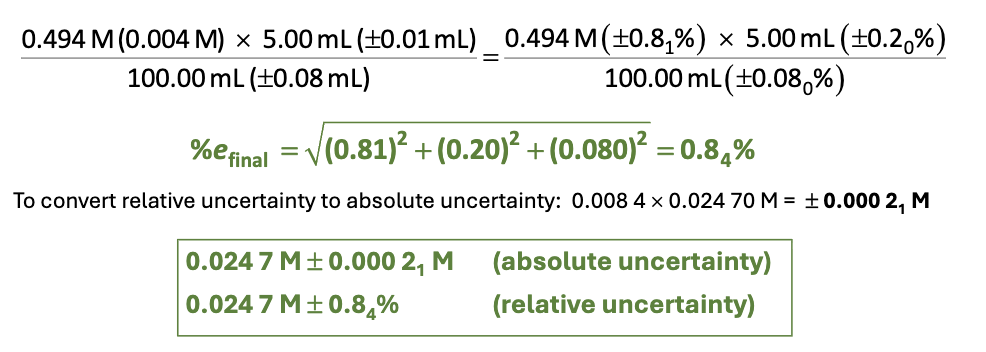
How do you calculate efinal via multiplication & division?
> Find each %ei by [(uncertainty/measurement)(100)].
> Find %efinal → get % relative uncertainty.
> Multiply relative uncertainty, (%efinal/100), and final, calculated measurement → get absolute uncertainty.
> Report both (1) final measurement & relative uncertainty and (2) final measurement & absolute uncertainty.
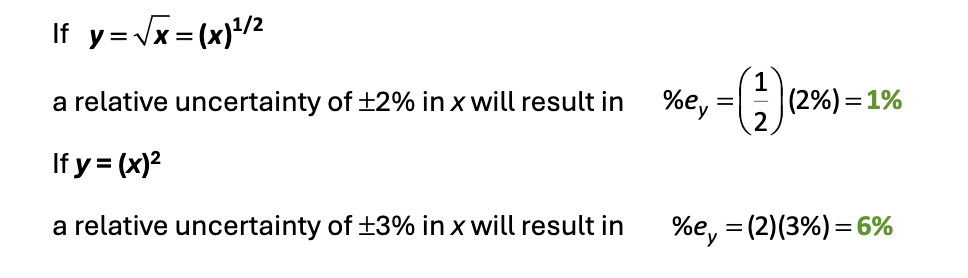
What’s the rule for uncertainty when y = xa?
\%e_{y}=a\left(\%e_{x}\right)
How do you calculate for calibrated results?
Calibrated result = measured result • calibration factor
e.g. galibration factor = 24.991mL/25.000mL