AP Bio - Unit 8: Ecology (overview)
0.0(0)
Studied by 185 people0%Unit 8 Mastery
0%Exam Mastery
Build your Mastery score
Supplemental Materials Call Kai
Card Sorting
1/18
Earn XP
Description and Tags
Last updated 7:28 PM on 3/28/23
Name | Mastery | Learn | Test | Matching | Spaced | Call with Kai |
|---|
No analytics yet
Send a link to your students to track their progress
19 Terms
1
New cards
what is ecology
study of organisms ond their environment
2
New cards
types of species distribution
uniform (brids, plants), random (plants), clumped (animals, shows social-ness)
3
New cards
density equation
D = n/a
n = # of species a = area size
n = # of species a = area size
4
New cards
abundance
size, ,methods of measuring:
* quadrats
* mark and recapture
* lincoln peterson index estimate populaiton size from M&R data
* N = (M\*S)/R
* M = # marked
* S = size of second sample
* R = # marked in recapture
* quadrats
* mark and recapture
* lincoln peterson index estimate populaiton size from M&R data
* N = (M\*S)/R
* M = # marked
* S = size of second sample
* R = # marked in recapture
5
New cards
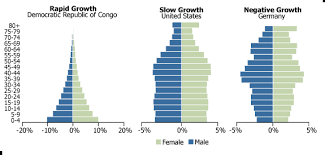
demography
graphs show percent of population by age
left = increasing pop.
middle = stable pop.
right = decreasing pop.
left = increasing pop.
middle = stable pop.
right = decreasing pop.
6
New cards
life history
pattern of survival (when they first reproduce, how many offspring, how many reproductive cycles)
7
New cards
fecundity
the ability to make offspring
8
New cards
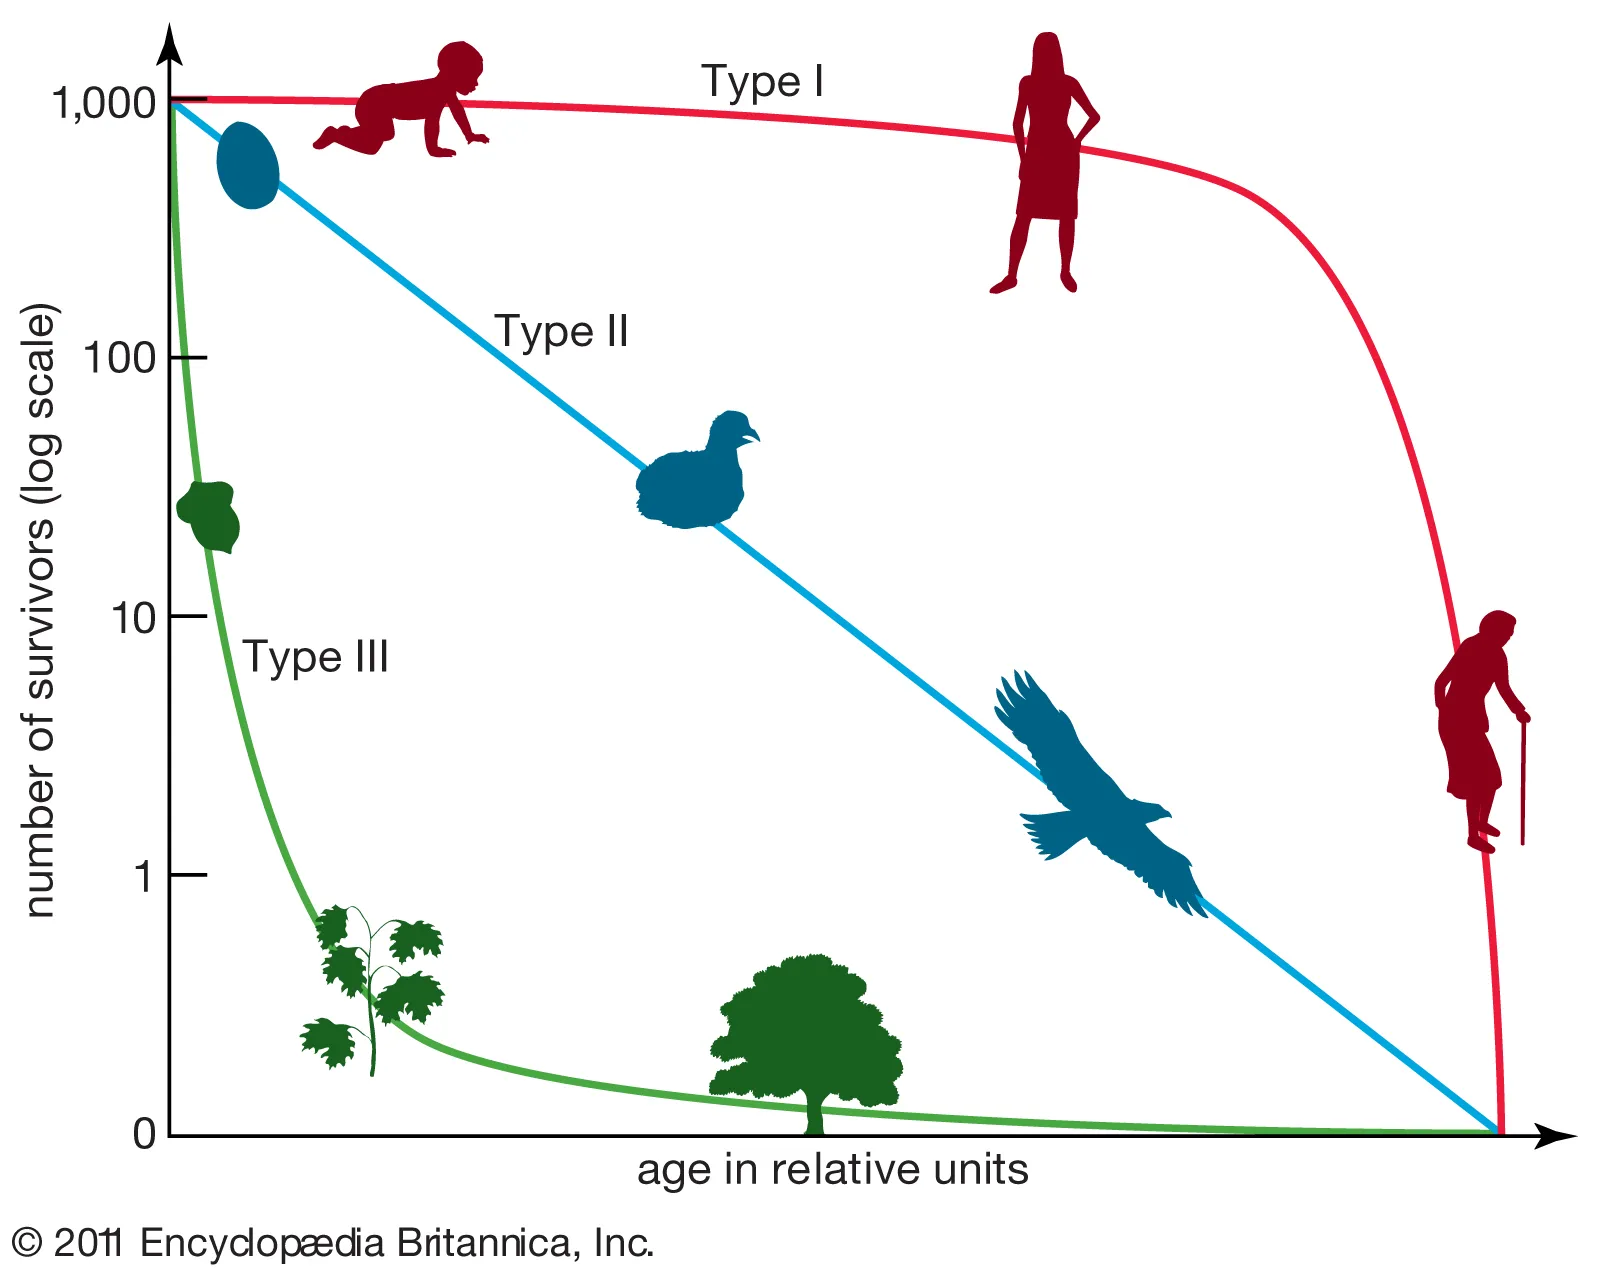
suvivorship curve
graph that shows # of births in relation to survival
red = K selection, high infant survival rate, less offspring
blue = constant death rate
green = R selection, high infant death, lots of offspring
red = K selection, high infant survival rate, less offspring
blue = constant death rate
green = R selection, high infant death, lots of offspring
9
New cards
formulas for populaiton growth
Birth rate(B) = # births/time
Death rate (D) = # deaths/time
per capita birth (b) = B/n (total population)
per capita death (d) = D/n
exponential growth rate = b-d also written as r (used for population calculations without carrying capacity)
if…
* r>0 = incline
* r<0 = decline
* r=0 = no change
logistic growth = r(n)((k-n)/k)
k = carrying capacity
10
New cards
density dependent factors
competition, predation, disease, ect
11
New cards
density independent factors
natural disasters, climate change, ect
12
New cards
community
the study of interspecific interation of populaitn of different species
13
New cards
ecological niche
a particular role that a species has in a community
14
New cards
interspecific interaction relationships (and who benefits)
* competition (neither)
* predation (one)
* herbivory (one)
* parasitism (one)
* commencalism (one benefits, other isnt bothered)
* mutilism (both)
* predation (one)
* herbivory (one)
* parasitism (one)
* commencalism (one benefits, other isnt bothered)
* mutilism (both)
15
New cards
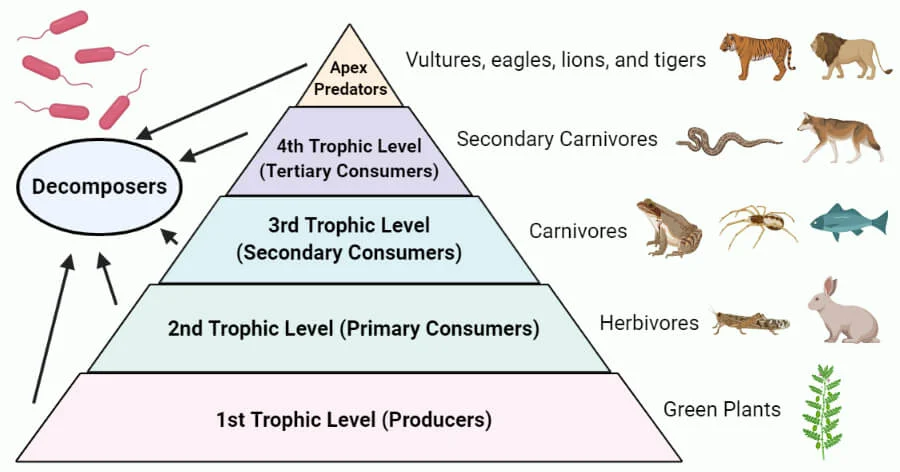
food webs
a way to map energy flow in a community
16
New cards
10% rule
approximently 10% of energy move up a trophic level
17
New cards
keystone species
a species that other species in a community rely on
18
New cards
invasive species
non-indigenous speciese that can cuse harm to the balence of an ecosystem
19
New cards
simpson’s diversity index
measures diverity, more diversity = better health
D = 1-Σ(n/N)^2
n = # of species in community
N = total individual
D = 1-Σ(n/N)^2
n = # of species in community
N = total individual