BYU-STAT-121 Combined Practice Quiz
0.0(0)
Studied by 3 peopleCard Sorting
1/136
Earn XP
Description and Tags
Last updated 3:10 AM on 11/15/22
Name | Mastery | Learn | Test | Matching | Spaced | Call with Kai |
|---|
No analytics yet
Send a link to your students to track their progress
137 Terms
1
New cards
a. This is an observational study; it is not reasonable to conclude any cause-and-effect relationship.
Researchers followed a group of 10,892 middle-aged adults over a period of nine years. They found that smokers who quit had a higher risk of diabetes within three years of quitting than either nonsmokers or continuing smokers. Does this show that stopping smoking causes the short-term risk for type 2 diabetes to increase?
a. This is an observational study; it is not reasonable to conclude any cause-and-effect relationship.
b. This is an experiment; it is reasonable to conclude a cause-and-effect relationship.
a. This is an observational study; it is not reasonable to conclude any cause-and-effect relationship.
b. This is an experiment; it is reasonable to conclude a cause-and-effect relationship.
2
New cards
b. Type of cell phone service
Which one of the following variables is categorical?
a. Fuel efficiency of vehicles
b. Type of cell phone service
c. Number of phone calls made from hotel rooms
d. Body temperature
a. Fuel efficiency of vehicles
b. Type of cell phone service
c. Number of phone calls made from hotel rooms
d. Body temperature
3
New cards
d. Weight of a football team member
Which one of the following variables is quantitative?
a. Car color
b. Brand of detergent
c. ID number of a BYU student
d. Weight of a football team member
a. Car color
b. Brand of detergent
c. ID number of a BYU student
d. Weight of a football team member
4
New cards
b. Minimum, Q1 , median, Q3 , maximum
The five number summary consists of the following five numbers:
a. Minimum, Q1 , mean, Q3 , maximum
b. Minimum, Q1 , median, Q3 , maximum
c. Minimum, μ-σ, mean, μ+σ, maximum
d. Minimum, μ-σ, median, μ+σ, maximum
a. Minimum, Q1 , mean, Q3 , maximum
b. Minimum, Q1 , median, Q3 , maximum
c. Minimum, μ-σ, mean, μ+σ, maximum
d. Minimum, μ-σ, median, μ+σ, maximum
5
New cards
b. Is equal to
If the distribution of data is symmetric, then the mean of the data ___________ the median.
a. Is greater than
b. Is equal to
c. Is less than
d. Cannot be compared to
a. Is greater than
b. Is equal to
c. Is less than
d. Cannot be compared to
6
New cards
b. Median
Which one of the following is NOT affected by outliers?
a. Mean
b. Median
c. Standard Deviation
d. Range
a. Mean
b. Median
c. Standard Deviation
d. Range
7
New cards
d. 22.2%
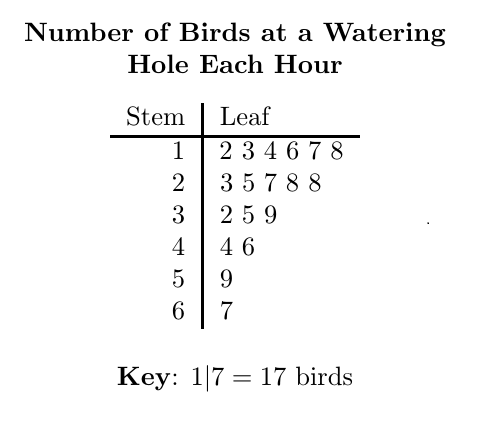
What percent of hours had more than 40 birds at the watering hole?
a. 4.0%
b. 11.1%
c. 18.0%
d. 22.2%
e. 29.2%
a. 4.0%
b. 11.1%
c. 18.0%
d. 22.2%
e. 29.2%
8
New cards
c. The mean is greater than the median.
Referring to the stemplot in the previous question, how does the mean compare with the median?
a. The mean is less than the median.
b. The mean is equal to the median.
c. The mean is greater than the median.
a. The mean is less than the median.
b. The mean is equal to the median.
c. The mean is greater than the median.
9
New cards
d. 39
Referring to the stemplot in the previous question, what is the value of Q3?
a. 17
b. 27.5
c. 37
d. 39
e. 41.5
a. 17
b. 27.5
c. 37
d. 39
e. 41.5
10
New cards
b. How much the observations in a data set vary about their mean.
Standard deviation measures
a. Where an observation is relative to the other data points.
b. How much the observations in a data set vary about their mean.
c. The change of a variable across time.
d. Where the data tend to center.
a. Where an observation is relative to the other data points.
b. How much the observations in a data set vary about their mean.
c. The change of a variable across time.
d. Where the data tend to center.
11
New cards
c. A list of possible values of a variable together with how often each value occurs.
What is a distribution of a random variable?
a. The range of the values of a variable as centered around the mean.
b. The numerical values placed on a histogram at varying points about the mean.
c. A list of possible values of a variable together with how often each value occurs.
d. The position of a variable within an observed data set.
a. The range of the values of a variable as centered around the mean.
b. The numerical values placed on a histogram at varying points about the mean.
c. A list of possible values of a variable together with how often each value occurs.
d. The position of a variable within an observed data set.
12
New cards
d. Right skewed
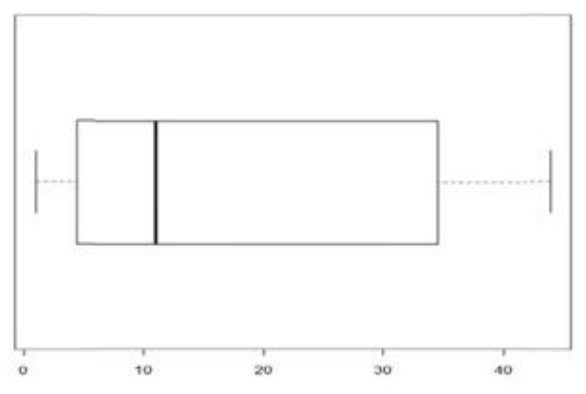
The shape of the distribution where this box-plot was drawn from is:
a. Uniform
b. Left skewed
c. Bell shaped
d. Right skewed
a. Uniform
b. Left skewed
c. Bell shaped
d. Right skewed
13
New cards
c. The percentage of data between 5 and 11 is clearly less than the percentage of data between 11 and 34.
Which one of the following statements is incorrect regarding the boxplot?
a. The interquartile range is about 29.
b. There are no outliers.
c. The percentage of data between 5 and 11 is clearly less than the percentage of data between 11 and 34.
a. The interquartile range is about 29.
b. There are no outliers.
c. The percentage of data between 5 and 11 is clearly less than the percentage of data between 11 and 34.
14
New cards
b. 63.5 to 75.5 inches
The height of American men (ages 20-30) is normally distributed with an average of 69.5 inches and a standard deviation of 3 inches. Between what two heights are the middle 95% of American men?
a. 69.5 to 75.5 inches
b. 63.5 to 75.5 inches
c. 66.5 to 72.5 inches
d. 68 to 71 inches
a. 69.5 to 75.5 inches
b. 63.5 to 75.5 inches
c. 66.5 to 72.5 inches
d. 68 to 71 inches
15
New cards
b. The mean stays the same, but the standard deviation decreases.
Three children are in a room, ages 3, 4, and 5. A fourth child enters aged 4. What can we say about the mean and standard deviation of the ages?
a. The mean stays the same, but the standard deviation increases.
b. The mean stays the same, but the standard deviation decreases.
c. The mean and standard deviation stay the same.
d. Both the mean and standard deviation increase.
a. The mean stays the same, but the standard deviation increases.
b. The mean stays the same, but the standard deviation decreases.
c. The mean and standard deviation stay the same.
d. Both the mean and standard deviation increase.
16
New cards
d. Both the mean and standard deviation increase.
Three children are in a room, ages 3, 4, and 5. A fourth child enters aged 6. What can we say about the mean and standard deviation of the ages?
a. The mean stays the same, but the standard deviation increases.
b. The mean stays the same, but the standard deviation decreases.
c. The mean and standard deviations stay the same.
d. Both the mean and standard deviation increase.
a. The mean stays the same, but the standard deviation increases.
b. The mean stays the same, but the standard deviation decreases.
c. The mean and standard deviations stay the same.
d. Both the mean and standard deviation increase.
17
New cards
c. The standard deviation stays the same.
The standard deviation of a set of data is computed to be 8.2. If 10 is added to each data value, what can we say about the standard deviation of the new data set?
a. The standard deviation decreases.
b. The standard deviation increases.
c. The standard deviation stays the same.
d. Without recomputing the standard deviation, it is impossible to say.
a. The standard deviation decreases.
b. The standard deviation increases.
c. The standard deviation stays the same.
d. Without recomputing the standard deviation, it is impossible to say.
18
New cards
e. 30
The time it takes for college freshman to complete the Mason Basic Reasoning Test is normally distributed with a mean of 24 minutes and a standard deviation of 5 minutes. What is the range for the middle 99.7% of the time for the Reasoning Test completion of college freshman?
a. 5
b. 10
c. 15
d. 20
e. 30
a. 5
b. 10
c. 15
d. 20
e. 30
19
New cards
b. The 290 voters who returned the questionnaire.
A state representative wants to know how voters in his district feel about enacting a statewide smoking ban in all enclosed public places, including bars and restaurants, as well as several other current statewide issues. He mails a questionnaire addressing these issues to an SRS of 800 voters in his district. Of the 800 questionnaires mailed, 290 were returned. What is the sample in this study?
a. The 800 voters who received the questionnaire.
b. The 290 voters who returned the questionnaire.
c. All voters in his district.
a. The 800 voters who received the questionnaire.
b. The 290 voters who returned the questionnaire.
c. All voters in his district.
20
New cards
e. 0.3085
A manufacturing process produces bags of cookies that have Normally distributed weights with a mean of μ = 15.0 oz. and a standard deviation of σ = 0.4 oz. What is the probability that a randomly selected bag weighs more than 15.2 oz?
a. 0.9772
b. 0.6915
c. 0.5793
d. 0.5000
e. 0.3085
f. 0.0228
a. 0.9772
b. 0.6915
c. 0.5793
d. 0.5000
e. 0.3085
f. 0.0228
21
New cards

d. .72
The probability distribution for the number of cars owned by family units is listed as follows: IMAGE
What is the probability that a randomly selected family unit owns at least two cars? i.e., What is P(x ≥ 2)?
a. .000484
b. .0968
c. .44
d. .72
e. .93
What is the probability that a randomly selected family unit owns at least two cars? i.e., What is P(x ≥ 2)?
a. .000484
b. .0968
c. .44
d. .72
e. .93
22
New cards
c. 2
Referring to the probability distribution in the previous question, what is the best estimate of the median number of cars owned by families?
a. 0
b. 1
c. 2
d. 3
a. 0
b. 1
c. 2
d. 3
23
New cards
b. The fraction of times the event will occur if the random phenomenon is repeated many times.
The probability of an event can be defined as
a. 1 / k where k is the number of possible outcomes of which the event is one possible outcome.
b. The fraction of times the event will occur if the random phenomenon is repeated many times.
c. The number of successes.
d. the odds of the event occurring; i.e., k to 1.
a. 1 / k where k is the number of possible outcomes of which the event is one possible outcome.
b. The fraction of times the event will occur if the random phenomenon is repeated many times.
c. The number of successes.
d. the odds of the event occurring; i.e., k to 1.
24
New cards
a. Matched pairs experiment
Twenty-five right-handed men were tested to compare their right hand strength with their left hand strength using a bathroom scale. For each male, a coin was tossed. If it landed heads, the man first squeezed the scales with his right hand and then with his left hand. If the coin landed tails, the man squeezed the scales with his left hand first and then with his right. The weight registered on the scale is recorded for both hands. What type of study is this?
a. Matched pairs experiment
b. Completely random experiment
c. Observational study
d. Simple random sample
a. Matched pairs experiment
b. Completely random experiment
c. Observational study
d. Simple random sample
25
New cards
c. According to historical records when meteorological conditions were the same as today, it snowed twenty percent of the time.
The announcer on the radio tells listeners that the probability of snow tonight is 20%. We should interpret this to mean that
a. 20% of the listeners will have snow in their area tonight.
b. You will not have any snow tonight because the chance of snow is less than 50%.
c. According to historical records when meteorological conditions were the same as today, it snowed twenty percent of the time.
d. It will snow if you are unlucky (or lucky if you like snow) and not snow if you are lucky.
26
New cards
d. The results are not convincing because the effect of herbal tea is confounded with the effect of visiting.
A group of college students believed that herbal tea has remarkable restorative powers. To test their theory, they randomly selected residents at a local nursing home. Each week they visited these residents and served them herbal tea. After several months, many of these residents were more cheerful and healthy. Which of the following can be correctly concluded from this study?
a. Herbal tea will improve the emotional state of residents in nursing homes.
b. While there is some evidence that drinking herbal tea improves one’s emotional state, the results are not convincing since a scientist did not conduct the study.
c. The results are not convincing because only residents of one nursing home were studied and only for a few months.
d. The results are not convincing because the effect of herbal tea is confounded with the effect of visiting.
27
New cards
d. 2.2
Scores on a standard IQ test are approximately normally distributed with a mean of 100 and a standard deviation 15. If Joe’s score is 133, how many standard deviations is Joe’s score above the mean?
a. 33
b. 15
c. 6.6
d. 2.2
c. 1.5
a. 33
b. 15
c. 6.6
d. 2.2
c. 1.5
28
New cards
d. 0.6%
Referring to the previous question, what percentage of IQs are more than 2.5 standard deviations above the mean?
a. 10%
b. 5%
c. 2.5%
d. 0.6%
e. Impossible to determine.
a. 10%
b. 5%
c. 2.5%
d. 0.6%
e. Impossible to determine.
29
New cards
a. Subtract the mean from a given value and then divide by the standard deviation.
To standardize means to
a. Subtract the mean from a given value and then divide by the standard deviation.
b. Calibrate the data until they have a normal shape.
c. Smooth out irregularities and remove outliers from the data set.
d. Center the data set about zero.
a. Subtract the mean from a given value and then divide by the standard deviation.
b. Calibrate the data until they have a normal shape.
c. Smooth out irregularities and remove outliers from the data set.
d. Center the data set about zero.
30
New cards
a. 31.74%
Corks for bottles in a certain manufacturing process are produced in such a way that the diameter of the corks has a Normal distribution with mean 3 cm. and standard deviation 0.1 cm. The specifications call for corks with diameters between 2.9 and 3.1 cm. What percentage of the produced corks do not meet specifications?
a. 31.74%
b. 53.98%
c. 68.26%
d. 84.13%
e. Cannot be answered with information given.
a. 31.74%
b. 53.98%
c. 68.26%
d. 84.13%
e. Cannot be answered with information given.
31
New cards
c. 2.872 cm
For corks described in the previous question, below what diameter are the smallest 10% of the corks?
a. .5398 cm
b. 2.540 cm
c. 2.872 cm
d. 2.999 cm
e. 3.001 cm
f. 3.067 cm
a. .5398 cm
b. 2.540 cm
c. 2.872 cm
d. 2.999 cm
e. 3.001 cm
f. 3.067 cm
32
New cards
a. 1.35
A cork produced by the process described in question 36 has a diameter of 3.135 cm. How many standard deviations is that diameter above the mean?
a. 1.35
b. .9115
c. 12
d. 5
a. 1.35
b. .9115
c. 12
d. 5
33
New cards
d. Z-score
Which one of the following does NOT have the same units of measure as the data?
a. Mean
b. Standard deviation
c. Interquartile range
d. Z-score
a. Mean
b. Standard deviation
c. Interquartile range
d. Z-score
34
New cards
a. To eliminate bias associated with lurking variables.
Why do we randomize in experiments?
a. To eliminate bias associated with lurking variables.
b. To enhance the placebo effect.
c. To enable the measurement of treatment differences.
d. To remove extraneous variation from the experiment error.
e. To more precisely measure chance variation.
a. To eliminate bias associated with lurking variables.
b. To enhance the placebo effect.
c. To enable the measurement of treatment differences.
d. To remove extraneous variation from the experiment error.
e. To more precisely measure chance variation.
35
New cards
c. Observational study
Twelve locations were selected in a county where a steel plant is accused of air pollution. At each location, the sulfate level and distance from the steel plant were measured. The data were analyzed to see whether the sulfate level decreases as distance from the plant increases. What type of study is this?
a. Matched pairs experiment
b. Randomized controlled experiment
c. Observational study
d. A double blind experiment
e. Multistage study
a. Matched pairs experiment
b. Randomized controlled experiment
c. Observational study
d. A double blind experiment
e. Multistage study
36
New cards
a. Non-response bias
Interviewers were contacting the people who had been selected in a stratified sample. Many of the people they contacted refused to answer their questions. What type of bias is this?
a. Non-response bias
b. Undercoverage bias
c. Interviewer bias
d. Question wording bias
a. Non-response bias
b. Undercoverage bias
c. Interviewer bias
d. Question wording bias
37
New cards
c. The effect of one variable on the response variable cannot be separated from the effect of the other variable on the response variable.
Two variables are confounded when
a. They interact in their effects on the response variable.
b. The effect of one variable impacts the other variable.
c. The effect of one variable on the response variable cannot be separated from the effect of the other variable on the response variable.
d. Both variables are classified as lurking variables
38
New cards
d. all of the above.
Blocking should be used whenever
a. You want to remove variation associated with the blocking variable from the experimental variation.
b. Individuals are grouped before the experiment begins according to some characteristic that is expected to affect the response variable.
c. Individuals are similar within the blocks but very different from block to block.
d. all of the above.
39
New cards
e. To more precisely measure chance variation.
Why do we use replication in experiments?
a. To eliminate bias associated with lurking variables.
b. To enhance the placebo effect.
c. To enable the measurement of treatment differences.
d. To remove extraneous variation from the experiment error.
e. To more precisely measure chance variation.
a. To eliminate bias associated with lurking variables.
b. To enhance the placebo effect.
c. To enable the measurement of treatment differences.
d. To remove extraneous variation from the experiment error.
e. To more precisely measure chance variation.
40
New cards
c. Each member of the population has a chance of being selected and that chance can be computed.
Probability samples are samples selected in such a way that
a. Each member of the population has an equal chance of being selected.
b. All samples of size n have the same chance of being selected.
c. Each member of the population has a chance of being selected and that chance can be computed.
d. The sample is guaranteed to duplicate the entire population.
a. Each member of the population has an equal chance of being selected.
b. All samples of size n have the same chance of being selected.
c. Each member of the population has a chance of being selected and that chance can be computed.
d. The sample is guaranteed to duplicate the entire population.
41
New cards
a. Establish causation.
When we perform a proper experiment, we can
a. Establish causation.
b. Obtain biased results for the sample statistics.
c. Produce experimental results that are confounded with the explanatory variable.
d. More readily extend the results to the population than with surveys
e. Implement blocking – something that is NOT possible with surveys.
a. Establish causation.
b. Obtain biased results for the sample statistics.
c. Produce experimental results that are confounded with the explanatory variable.
d. More readily extend the results to the population than with surveys
e. Implement blocking – something that is NOT possible with surveys.
42
New cards
b. Confounding the explanatory variable and response variable.
Which one of the following is NOT a principle of proper experimentation?
a. Randomly allocating experimental units to treatments.
b. Confounding the explanatory variable and response variable.
c. Replication to measure overall experimental error and increase precision.
d. Use of control group to determine whether treatment really works.
a. Randomly allocating experimental units to treatments.
b. Confounding the explanatory variable and response variable.
c. Replication to measure overall experimental error and increase precision.
d. Use of control group to determine whether treatment really works.
43
New cards
c. Stratified sampling.
Jane, a student at BYU, decides to study opinions of BYU students concerning grading in religion classes. She obtains a roll from every religion class and randomly selects five students on each roll. This is an example of
a. Simple random sampling.
b. Multistage sampling.
c. Stratified sampling.
d. Convenience sample.
a. Simple random sampling.
b. Multistage sampling.
c. Stratified sampling.
d. Convenience sample.
44
New cards
a. Undercoverage bias
Refer to the previous question. Even though Jane randomly selects students, her survey is biased because not all students take religion classes every semester. What type of bias is this?
a. Undercoverage bias
b. Non-response bias
c. Question wording bias
d. Interviewer bias
a. Undercoverage bias
b. Non-response bias
c. Question wording bias
d. Interviewer bias
45
New cards
e. All of the above.
What characterizes a probability sample but not a sample of convenience?
a. Some type of random device is used to obtain a probability sample.
b. Their probabilities can be computed.
c. All possible probability samples can be listed.
d. Inferences can appropriately be made from probability samples.
e. All of the above.
a. Some type of random device is used to obtain a probability sample.
b. Their probabilities can be computed.
c. All possible probability samples can be listed.
d. Inferences can appropriately be made from probability samples.
e. All of the above.
46
New cards
c. Designing the study so that the lurking variables are confounded with the explanatory variable.
Lurking variables can be managed by each of the following except one. Which is NOT a method for managing lurking variables?
a. Using a control group with a placebo as a comparison for the treatment group.
b. Randomly allocating experimental units to the treatments.
c. Designing the study so that the lurking variables are confounded with the explanatory variable.
d. Forming blocks to remove the variability associated with lurking variables.
47
New cards
c. Number of revolutions of the exercise wheel.
The article “Action of drugs on movements of rats during swimming” (J. of Human Movement Studies (1984): 225-30) described the effects of the drug ephedrine. Twenty rats were placed in a swimming apparatus where swimming movement triggered rotation of an exercise wheel. The number of revolutions during a fixed time interval was recorded before and after administration of a dose of 5 mg of ephedrine per kilogram of body weight.
The response variable is
a. Body weight in kilograms.
b. Dosage in milligrams of ephedrine.
c. Number of revolutions of the exercise wheel.
d. Effect of ephedrine on the rate.
e. Species of rat.
f. Treatment of ephedrine versus no ephedrine
The response variable is
a. Body weight in kilograms.
b. Dosage in milligrams of ephedrine.
c. Number of revolutions of the exercise wheel.
d. Effect of ephedrine on the rate.
e. Species of rat.
f. Treatment of ephedrine versus no ephedrine
48
New cards
f. Treatment of ephedrine versus no ephedrine.
The article “Action of drugs on movements of rats during swimming” (J. of Human Movement Studies (1984): 225-30) described the effects of the drug ephedrine. Twenty rats were placed in a swimming apparatus where swimming movement triggered rotation of an exercise wheel. The number of revolutions during a fixed time interval was recorded before and after administration of a dose of 5 mg of ephedrine per kilogram of body weight.
The explanatory variable is:
a. Body weight in kilograms.
b. Dosage in milligrams of ephedrine.
c. Number of revolutions of the exercise wheel.
d. Effect of ephedrine on the rate.
e. Species of rat.
f. Treatment of ephedrine versus no ephedrine.
The explanatory variable is:
a. Body weight in kilograms.
b. Dosage in milligrams of ephedrine.
c. Number of revolutions of the exercise wheel.
d. Effect of ephedrine on the rate.
e. Species of rat.
f. Treatment of ephedrine versus no ephedrine.
49
New cards
c. A rat.
The article “Action of drugs on movements of rats during swimming” (J. of Human Movement Studies (1984): 225-30) described the effects of the drug ephedrine. Twenty rats were placed in a swimming apparatus where swimming movement triggered rotation of an exercise wheel. The number of revolutions during a fixed time interval was recorded before and after administration of a dose of 5 mg of ephedrine per kilogram of body weight.
The individual in this study is
a. Number of revolutions
b. Type of drug.
c. A rat.
d. A swimming apparatus.
e. A rotation of the exercise wheel.
The individual in this study is
a. Number of revolutions
b. Type of drug.
c. A rat.
d. A swimming apparatus.
e. A rotation of the exercise wheel.
50
New cards
c. A matched pairs experiment.
The article “Action of drugs on movements of rats during swimming” (J. of Human Movement Studies (1984): 225-30) described the effects of the drug ephedrine. Twenty rats were placed in a swimming apparatus where swimming movement triggered rotation of an exercise wheel. The number of revolutions during a fixed time interval was recorded before and after administration of a dose of 5 mg of ephedrine per kilogram of body weight.
This study is an example of:
a. An observational study.
b. A randomized controlled experiment.
c. A matched pairs experiment.
d. Neither an observational study nor an experiment.
This study is an example of:
a. An observational study.
b. A randomized controlled experiment.
c. A matched pairs experiment.
d. Neither an observational study nor an experiment.
51
New cards
No
The article “Action of drugs on movements of rats during swimming” (J. of Human Movement Studies (1984): 225-30) described the effects of the drug ephedrine. Twenty rats were placed in a swimming apparatus where swimming movement triggered rotation of an exercise wheel. The number of revolutions during a fixed time interval was recorded before and after administration of a dose of 5 mg of ephedrine per kilogram of body weight.
Does this study incorporate randomization?
a. Yes
b. No
Does this study incorporate randomization?
a. Yes
b. No
52
New cards
b. A stratified random sample
Archaeologists plan to examine a sample of two-meter-square plots near an ancient Greek city for artifacts visible in the ground. They randomly choose three plots from each of the following areas: floodplain, coast, foothills, and high hills. What kind of sample is this?
a. A simple random sample
b. A stratified random sample
c. A voluntary response sample
d. A convenience sample
a. A simple random sample
b. A stratified random sample
c. A voluntary response sample
d. A convenience sample
53
New cards
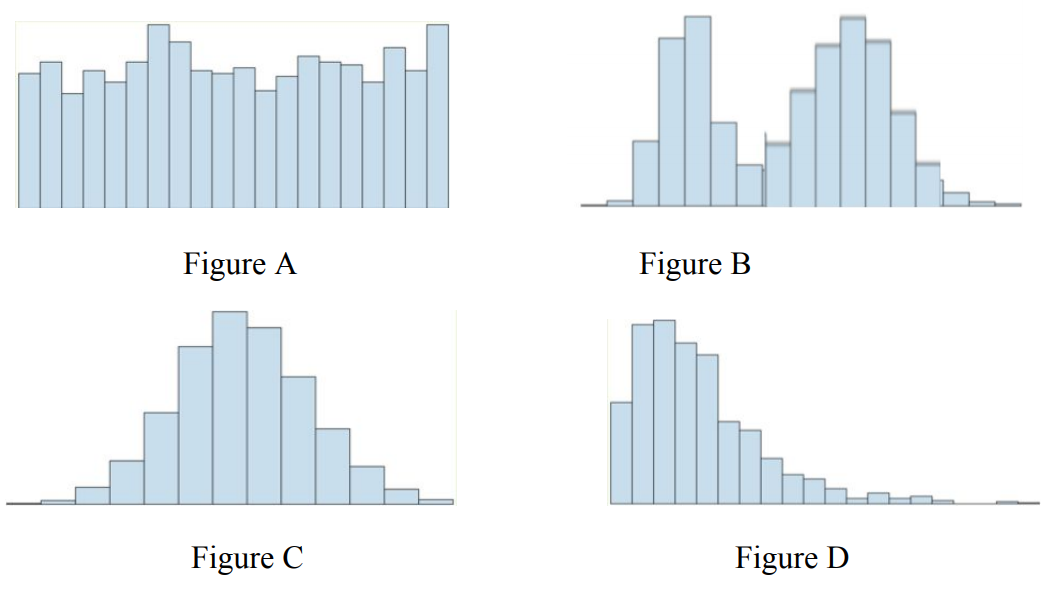
a. The histogram for figure A
Which histogram represents the data with the largest standard deviation? Note that each histogram is on the same scale.
a. The histogram for figure A
b. The histogram for figure B
c. The histogram for figure C
d. The histogram for figure D
a. The histogram for figure A
b. The histogram for figure B
c. The histogram for figure C
d. The histogram for figure D
54
New cards
True
Standard deviation is a measure of variability.
True or False?
True or False?
55
New cards
False
Observational studies cannot have control groups.
True or False?
True or False?
56
New cards
True
Samples of convenience are non-probability samples.
True or False?
True or False?
57
New cards
True
Samples can be biased due to poor interviewing and/or poorly worded questions.
True or False?
True or False?
58
New cards
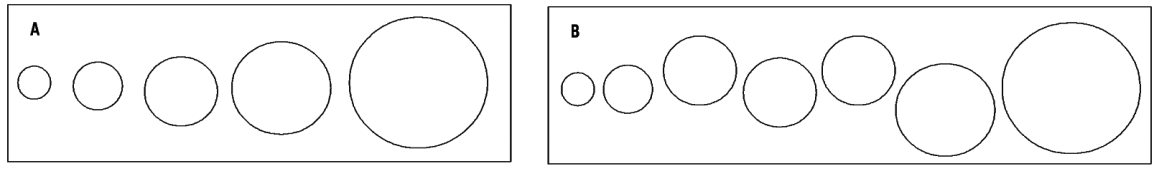
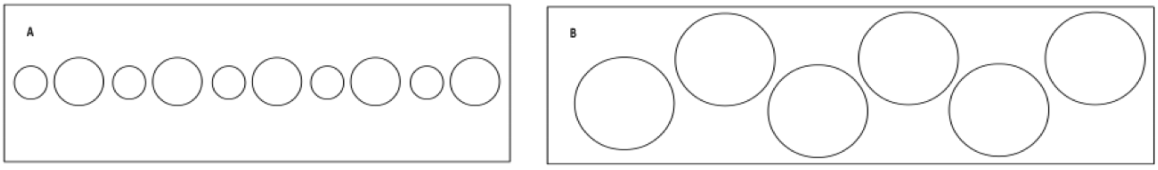
c. Greater than
Determine how the standard deviation of the diameters for the circles in figure A compare with those in figure B:
a. Less than
b. Equal
c. Greater than
d. Cannot be determined from given information
a. Less than
b. Equal
c. Greater than
d. Cannot be determined from given information
59
New cards
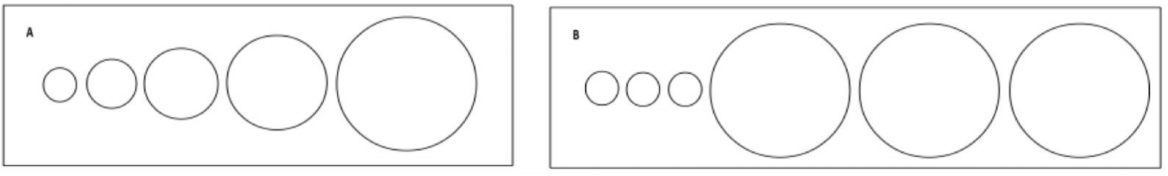
c. Greater than
Determine how the standard deviation of the diameters for the circles in figure A compare with those in figure B:
a. Less than
b. Equal
c. Greater than
d. Cannot be determined from given information
a. Less than
b. Equal
c. Greater than
d. Cannot be determined from given information
60
New cards
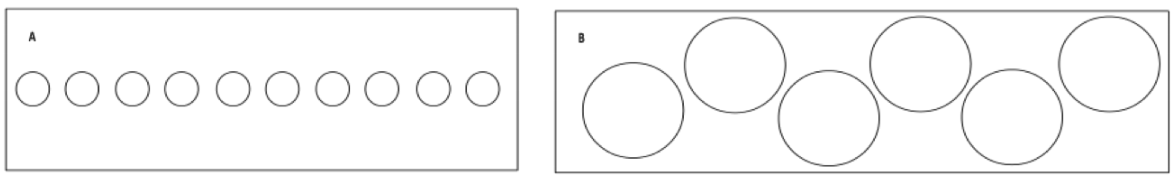
a. Less than
Determine how the standard deviation of the diameters for the circles in figure A compare with those in figure B:
a. Less than
b. Equal
c. Greater than
d. Cannot be determined from given information
a. Less than
b. Equal
c. Greater than
d. Cannot be determined from given information
61
New cards
b. Equal
Determine how the standard deviation of the diameters for the circles in figure A compare with those in figure B:
a. Less than
b. Equal
c. Greater than
d. Cannot be determined from given information
a. Less than
b. Equal
c. Greater than
d. Cannot be determined from given information
62
New cards
b. Amount paid for course materials
A BYU faculty member wants to investigate the mean amount that BYU students pay for their course materials in fall 2020. What is the variable of interest?
a. A BYU student
b. Amount paid for course materials
c. Mean amount paid for course materials
d. A course at BYU
e. Major of the BYU student
a. A BYU student
b. Amount paid for course materials
c. Mean amount paid for course materials
d. A course at BYU
e. Major of the BYU student
63
New cards
b. Median
Here are the ages of 8 randomly selected people who applied for work at a fast-food restaurant.
18 23 19 45 19 24 17 27
Which measure of center best summarizes the ages of applicants at this fast food restaurant?
a. Mean
b. Median
c. IQR
d. Range
18 23 19 45 19 24 17 27
Which measure of center best summarizes the ages of applicants at this fast food restaurant?
a. Mean
b. Median
c. IQR
d. Range
64
New cards
b. The minimum is not an outlier, but the maximum is.
Here is the five number summary of a dataset:
5, 10, 13, 14, 21
Are the minimum and maximum outliers?
a. The minimum is an outlier, but the maximum is not.
b. The minimum is not an outlier, but the maximum is.
c. Both the minimum and maximum are outliers.
d. Neither the minimum nor maximum are outliers.
5, 10, 13, 14, 21
Are the minimum and maximum outliers?
a. The minimum is an outlier, but the maximum is not.
b. The minimum is not an outlier, but the maximum is.
c. Both the minimum and maximum are outliers.
d. Neither the minimum nor maximum are outliers.
65
New cards
b. μ = 66, s = 2.5
The heights of women are known to have a mean of 66 inches and a standard deviation of 3 inches. A random sample of 210 women resulted in a mean of 67.5 inches and standard deviation 2.5 inches. What are the values of μ and s?
a. μ = 66, s = 3
b. μ = 66, s = 2.5
c. μ = 67.5, s = 3
d. μ = 67.5, s = 2.5
a. μ = 66, s = 3
b. μ = 66, s = 2.5
c. μ = 67.5, s = 3
d. μ = 67.5, s = 2.5
66
New cards
b. Emma weighed relatively more.
Birth weights of full-term babies are normally distributed with a mean of 3485 g and standard deviation of 425 g. Baby Emma was full-term with a birth weight of 4350 g. Pre-term birth weights have a mean of 2270 g and standard deviation of 610 g. Baby Darin was pre-term with a birth weight of 3200 g. Did Emma or Darin weigh relatively more?
a. Darin weighed relatively more.
b. Emma weighed relatively more.
a. Darin weighed relatively more.
b. Emma weighed relatively more.
67
New cards
c. 0.1747
Systolic blood pressure of adults follow a Normal distribution with mean 120 and standard deviation 20. What is the probability that a randomly selected adult will have a systolic blood pressure between 105 and 115?
a. 0.8253
b. 0.1658
c. 0.1747
d. 0.1971
a. 0.8253
b. 0.1658
c. 0.1747
d. 0.1971
68
New cards
d. The proportion in a sample survey that favor a certain opinion.
Which one of the following is NOT a parameter?
a. The mean of the measurements on all the individuals in a population.
b. The proportion of a population that have a certain characteristic.
c. The standard deviation of an entire population.
d. The proportion in a sample survey that favor a certain opinion.
a. The mean of the measurements on all the individuals in a population.
b. The proportion of a population that have a certain characteristic.
c. The standard deviation of an entire population.
d. The proportion in a sample survey that favor a certain opinion.
69
New cards
a. x̅
Fill in the blank: Central Limit Theorem allows us to compute probabilities on ___________ using the standard Normal table provided the sample size of the random sample is sufficiently large.
a. x̅
b. μ
c. s
d. sample measurements
a. x̅
b. μ
c. s
d. sample measurements
70
New cards
b. The standard deviation of the sampling distribution for the statistic.
Which one of the following measures the variability of a statistic?
a. The standard deviation of the data.
b. The standard deviation of the sampling distribution for the statistic.
c. The total sum of squared deviations of the observations about the mean.
d. The number of standard deviations that a statistic value differs from the parameter value.
a. The standard deviation of the data.
b. The standard deviation of the sampling distribution for the statistic.
c. The total sum of squared deviations of the observations about the mean.
d. The number of standard deviations that a statistic value differs from the parameter value.
71
New cards
b. the values of a statistic from all possible samples.
The sampling distribution of a statistic consists of
a. the results of a sample.
b. the values of a statistic from all possible samples.
c. the range of the values in a sample.
d. a set of sample data that has the same shape as the original population.
a. the results of a sample.
b. the values of a statistic from all possible samples.
c. the range of the values in a sample.
d. a set of sample data that has the same shape as the original population.
72
New cards
b. the variability of the sample mean values about the parameter, μ.
The standard deviation of the sampling distribution of measures
a. the variability of observations about the mean.
b. the variability of the sample mean values about the parameter, μ.
c. the height of the sampling distribution.
d. the error or difference between the value of a statistic and its parameter.
a. the variability of observations about the mean.
b. the variability of the sample mean values about the parameter, μ.
c. the height of the sampling distribution.
d. the error or difference between the value of a statistic and its parameter.
73
New cards
c. is exactly equal to 22.
For the theoretical sampling distribution of x̅ created by taking all possible samples of size 16 from a very left skewed population with μ = 22 and σ = 4, the mean of this sampling distribution
a. is approximately equal to 22.
b. is slightly less than 22.
c. is exactly equal to 22.
d. is slightly greater than 22.
e. would approach 22 if the sample size were to continually increase.
a. is approximately equal to 22.
b. is slightly less than 22.
c. is exactly equal to 22.
d. is slightly greater than 22.
e. would approach 22 if the sample size were to continually increase.
74
New cards
c. 1.0
Referring to the sampling distribution of x̅ described in the previous question, what is the standard deviation of the sampling distribution of x̅?
a. 5.5
b. 4.0
c. 1.0
d. 0.25
e. 0.0625
f. Cannot be determined
a. 5.5
b. 4.0
c. 1.0
d. 0.25
e. 0.0625
f. Cannot be determined
75
New cards
c. Slightly left skewed
For the sampling distribution of described in the previous question, what is its shape?
a. Slightly right skewed
b. Approximately Normal
c. Slightly left skewed
d. Cannot be determined because the shape of the population is unknown
a. Slightly right skewed
b. Approximately Normal
c. Slightly left skewed
d. Cannot be determined because the shape of the population is unknown
76
New cards
e. 0.0038
A manufacturing process produces potato chip bags that have Normally distributed weights, with a mean weight of 15 oz. and a standard deviation of .3 oz. What is the probability that 16 randomly selected bags have a mean weight that exceeds 15.2 oz?
a. 0.9772
b. 0.9962
c. 0.5793
d. 0.5000
e. 0.0038
f. 0.0228
a. 0.9772
b. 0.9962
c. 0.5793
d. 0.5000
e. 0.0038
f. 0.0228
77
New cards
b. No, because the distribution of weights is Normally distributed.
A manufacturing process produces potato chip bags that have Normally distributed weights, with a mean weight of 15 oz. and a standard deviation of .3 oz. What is the probability that 16 randomly selected bags have a mean weight that exceeds 15.2 oz?
Do you need to apply the Central Limit Theorem to compute the probability on the mean weight of 16 randomly selected bags described in the above question?
a. No, because the individual was not randomly selected.
b. No, because the distribution of weights is Normally distributed.
c. Yes, because we used the standard Normal table.
d. Yes, because the sample was random and n was large.
78
New cards
c. 14.8, 15.2
A manufacturing process produces potato chip bags that have Normally distributed weights, with a mean weight of 15 oz. and a standard deviation of .3 oz. What is the probability that 16 randomly selected bags have a mean weight that exceeds 15.2 oz?
Referring to the manufacturing process in the previous two questions, what are the lower and upper limits for the control chart for x̅ from samples of size 16?
a. 13.8, 16.2
b. 14.9, 15.1
c. 14.8, 15.2
d. 11.4, 18.6
Referring to the manufacturing process in the previous two questions, what are the lower and upper limits for the control chart for x̅ from samples of size 16?
a. 13.8, 16.2
b. 14.9, 15.1
c. 14.8, 15.2
d. 11.4, 18.6
79
New cards
e. The shape of the sampling distribution of x̄ will be approximately Normal.
The Central Limit Theorem tells us that under certain conditions
a. The shape of the histogram of the sample data will have the same shape as the population from which the sample was taken.
b. The mean and standard deviation of the sample will be approximately equal to the mean and standard deviation of the population from which we sample.
c. The shape of the population from which we sample will be approximately Normal.
d. he shape of the data in the sample will be approximately Normal.
e. The shape of the sampling distribution of x̄ will be approximately Normal.
80
New cards
d. All of the above.
On a control chart, under what circumstance is the process out of control?
a. A run of 9 consecutive sample means above the centerline or below the centerline.
b. A sample mean below the lower limit.
c. A sample mean above the upper limit.
d. All of the above.
e. None of the above.
a. A run of 9 consecutive sample means above the centerline or below the centerline.
b. A sample mean below the lower limit.
c. A sample mean above the upper limit.
d. All of the above.
e. None of the above.
81
New cards
a. μ
Which one of the following is not a statistic?
a. μ
b. x-bar
c. n
d. s
e. median of data in a sample
a. μ
b. x-bar
c. n
d. s
e. median of data in a sample
82
New cards
a. The amount of observed variation exceeds the amount that could be attributable to natural variation.
Control charts are designed to sound an alarm when
a. The amount of observed variation exceeds the amount that could be attributable to natural variation.
b. Variation is observed in the x̅'s
c. The observed sample means differ from the control standard by an amount attributable to natural variation.
d. The sample mean, x̅, differs from the control standard by even a small amount.
83
New cards
b. The sampling distribution of x̄ is approximately Normal when the sample size is large.
The Central Limit Theorem says that
a. The sample mean x̄ gets closer and closer to μ as sample size increases.
b. The sampling distribution of x̄ is approximately Normal when the sample size is large.
c. The population from which we sample can be transformed to a Normal distribution using standard scores (z-scores).
d. The shape of the histogram of observations in a sample gets more and more Normal as sample size increases.
84
New cards
a. less than
The standard deviation of the sampling distribution of x̄ is _____________ the standard deviation of the population from which samples of size n 1 are taken to create the sampling distribution.
a. less than
b. equal to
c. greater than
d. not comparable with
a. less than
b. equal to
c. greater than
d. not comparable with
85
New cards
e. 79.0, 2.8
The mean score of the fourth exam in a statistics class with 1800 students at a large university was 79 with a standard deviation of 14. Suppose twenty-five students are to be randomly selected and their sample mean computed. What will be the mean and standard deviation of the sampling distribution of x̄?
a. 3.16, 0.56
b. 15.8, 0.56
c. 15.8, 2.8
d. 79.0, 14
e. 79.0, 2.8
a. 3.16, 0.56
b. 15.8, 0.56
c. 15.8, 2.8
d. 79.0, 14
e. 79.0, 2.8
86
New cards
a. Yes, because the sample will be large and random so the Central Limit Theorem applies.
Lifetimes of a particular flashlight battery have a non-Normal distribution with mean, μ, of 35.6 hours and standard deviation σ = 5.4 hours. A quality inspector is planning to take a random sample of 43 of these batteries and compute the sample mean. Can he compute the probability that the sample mean will be below 35.7 hours using the standard Normal table? Why or why not?
a. Yes, because the sample will be large and random so the Central Limit Theorem applies.
b. Yes, because the original population was normally distributed and sample will be random.
c. No, because the sample size is too small to apply the Central Limit Theorem.
d. No, because the original distribution was not normally distributed.
87
New cards
b. 0.5478
Referring to the above question and assuming that computing the probability is okay, what is the probability that the sample mean is below 35.7?
a. 8786
b. 0.5478
c. 0.4522
d. 0.1214
e. 0.0185
a. 8786
b. 0.5478
c. 0.4522
d. 0.1214
e. 0.0185
88
New cards
b. Approximately Normal
Fill in the blank: For the sampling distribution of x̄ created by taking random samples from a left skewed population, the shape is _______________ for large n.
a. Slightly skewed right
b. Approximately Normal
c. Slightly skewed left
a. Slightly skewed right
b. Approximately Normal
c. Slightly skewed left
89
New cards
a. Decreases
Fill in the blank: For the sampling distribution of x̄ created by taking random samples from a left skewed population, the standard deviation of the sampling distribution of x̄ ____________ as n increases.
a. Decreases
b. Stays the same
c. Increases
d. Cannot be determined
a. Decreases
b. Stays the same
c. Increases
d. Cannot be determined
90
New cards
f. H0 : μ = 80 vs. Ha : μ < 80
The average time required to assemble a gas barbecue grill has been one hour and twenty minutes (80 minutes). An employee for the company has an idea that she thinks will shorten the time required for assembly. What hypotheses should be tested to determine whether her idea works?
a. H0 : x̄ = 80 vs. Ha : x̄ =/ 80
b. H0 : x̄ = 80 vs. Ha : x̄ < 80
c. H0 : x̄ = 80 vs. Ha : x̄ > 80
d. H0 : μ = 80 vs. Ha : μ =/ 80
e. H0 : μ = 80 vs. Ha : μ > 80
f. H0 : μ = 80 vs. Ha : μ < 80
a. H0 : x̄ = 80 vs. Ha : x̄ =/ 80
b. H0 : x̄ = 80 vs. Ha : x̄ < 80
c. H0 : x̄ = 80 vs. Ha : x̄ > 80
d. H0 : μ = 80 vs. Ha : μ =/ 80
e. H0 : μ = 80 vs. Ha : μ > 80
f. H0 : μ = 80 vs. Ha : μ < 80
91
New cards
c. 865
How large of a sample should you take in order to have a margin of error of 2 with a 95% confidence level when the standard deviation is 30?
a. 30
b. 864
c. 865
d. 3457
a. 30
b. 864
c. 865
d. 3457
92
New cards
b. We are using s to estimate σ.
We use a t-distribution with n–1 degrees of freedom rather than the standard normal distribution whenever
a. The Central Limit Theorem does not apply.
b. We are using s to estimate σ.
c. The population is not Normally distributed.
d. We can apply the Law of Large numbers and do not need normality.
a. The Central Limit Theorem does not apply.
b. We are using s to estimate σ.
c. The population is not Normally distributed.
d. We can apply the Law of Large numbers and do not need normality.
93
New cards
b. The estimate of the standard deviation of the sampling distribution of x̄.
Standard error of x̄ refers to
a. The amount an observed statistic for x̄ differs from its parameter, μ.
b. The estimate of the standard deviation of the sampling distribution of x̄.
c. The number of standard deviations that the observed statistic, x̄, differs from its parameter, μ.
d. The maximum amount that a statistic, x̄, differs from its parameter, μ.
94
New cards
c. 0.025
Suppose you are testing H0 : μ = 30 vs. Ha : μ >30 with a sample of size n = 19 and the test statistic is t = 1.92. What is the p-value?
a. 0.0192
b. 0.0274
c. 0.025
a. 0.0192
b. 0.0274
c. 0.025
95
New cards
a. Randomization and no outliers in the data.
Whenever performing a one sample t procedure on means, we should check for
a. Randomization and no outliers in the data.
b. Random allocation of individuals to treatments.
c. Only randomization.
d. Randomization and small sample sizes.
a. Randomization and no outliers in the data.
b. Random allocation of individuals to treatments.
c. Only randomization.
d. Randomization and small sample sizes.
96
New cards
a. (99.10, 107.18)
Find a 95% confidence interval for μ when n = 9, x̄ = 103.14 and s = 5.25.
a. (99.10, 107.18)
b. (99.71, 106.57)
c. (101.39, 104.89)
d. (101.79, 104.49)
a. (99.10, 107.18)
b. (99.71, 106.57)
c. (101.39, 104.89)
d. (101.79, 104.49)
97
New cards
d. 0.005 < P < 0.01
Suppose we were to test the hypotheses H0 : μ = 80 versus Ha : μ < 80 and computed the standardized value of the test statistic to be t = –2.67 from the sample results of a sample of size n = 22. Using the t table, what is the p-value?
a. 0.025 < P < 0.05
b. 0.02 < P < 0.025
c. 0.01 < P < 0.02
d. 0.005 < P < 0.01
e. Cannot find using the t table since the t test statistic value is negative.
a. 0.025 < P < 0.05
b. 0.02 < P < 0.025
c. 0.01 < P < 0.02
d. 0.005 < P < 0.01
e. Cannot find using the t table since the t test statistic value is negative.
98
New cards
b. A type II error.
If we fail to reject the null hypothesis, we could be making
a. A type I error.
b. A type II error.
c. Either a type I and a type II error.
d. No error. An error is only made when we accidentally reject the null hypothesis.
a. A type I error.
b. A type II error.
c. Either a type I and a type II error.
d. No error. An error is only made when we accidentally reject the null hypothesis.
99
New cards
a. The difference between the observed statistic and the claimed parameter value given in H0 is too large to be due to chance.
Sample results are said to be statistically significant whenever
a. The difference between the observed statistic and the claimed parameter value given in H0 is too large to be due to chance.
b. The difference between the true situation and the observed situation could plausibly have resulted because H0 is false.
c. The researcher subjectively classifies the observed deviation from what was expected under H0 as large enough to matter.
d. The difference between the observed statistic and the claimed parameter value is large enough to be worth reporting.
100
New cards
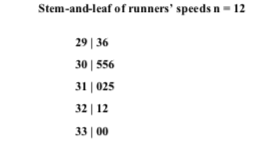
a. Yes, because the runners were randomly sampled and there are no serious outliers in the stemplot.
Twelve runners were randomly sampled and asked to run a 10-kilometer race. Their times are recorded in the following stemplot. On the basis of the following stemplot, is use of a one-sample t confidence interval procedure to estimate the mean time appropriate?
a. Yes, because the runners were randomly sampled and there are no serious outliers in the stemplot.
b. Yes, because the population of runners’ times is normally distributed.
c. No, because 12 runners is too few relative to the total number of runners in the world.
d. No, because the sample size is too small for inference.