P1 CH3 how are costs measured
1/24
Earn XP
Description and Tags
Name | Mastery | Learn | Test | Matching | Spaced |
|---|
No study sessions yet.
25 Terms
een variabele kost
verandert idrect als gevolg van een verandering in de kostendrijver
een vaste kost
verandert op korte termijn niet als gevolg van een verandering in de kostendrijver
gemengde kosten (mixed costs)
a costs that contains elements of both fixed and variable cost-behavior
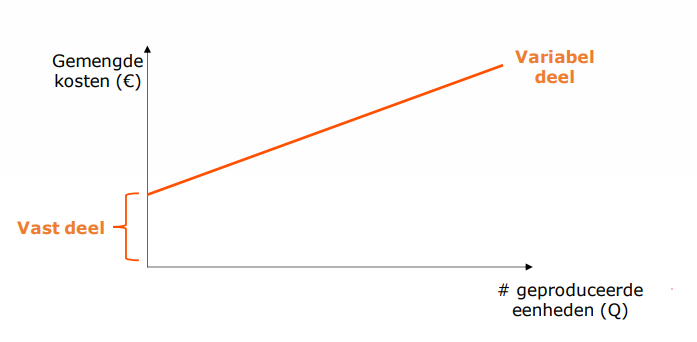
gemengde kosten : vaste kost gedeelte
de kost om de capaciteit beschikbaar te stellen teneinde te kunnen opereren tegen elk outputniveau binnen het relevant gebied (= capacity costs)
(= capacity costs)
de kost om de capaciteit beschikbaar te stellen teneinde te kunnen opereren tegen elk outputniveau binnen het relevant gebied
gemengde kost: variabele kost gedeelte
de additionele kost bij het gebruik van de capaciteit teneinde een bepaalde output te bereiken
commited foxed costs
costs arising from the possession of facilities, equipment and a basic organization
discretionary fixed costs
costs determined by management as part ofthe periodic planning process in order to meet the organization’s goals. They have no obvious relationschip with levels of capacity or output activity
cost measurement
estimating or predicting costs as a function of appropriate cost drivers
→ beschrijving van de relatie tussen kost en kostendrijver
activity analysis
the process of identifying appropriate cost drivers and their effects on he costs of making a product or a service
welke methodes zijn er om de kostenfuncties op te stellen
analytische benadering
engineering analysis
account analysis
obv historische gegevens
high-low analysis
visual-fit analysis
least squares regression analysis
engineering analysis
entails a systematic review of materials, supplies, labor, support services, and facilities needed for products and services
it measures cost behavior according to what costs should be, not by what costs have been
engineering analysis : hoe ?
existing products
personnel interviews
observation of activities
new products
experiments with prototypes
experience or competitors
management consultants
engineering analysis : voordelen
verhindert dat inefficienties uit het vefrleden worden opgenomen
indien uitgevoerd door iemand met ervaring die de kosten werkelijk begrijpt, kan deze methode nuttige informatie opleveren
engineering analysis : nadelen
tijdsintensief
duur
subjectief
account analysis :
classifying each account as a variable cost or a fixed cost with respect to a selected cost driver
men kijkt naar de boekhouding om informatie te bekomen over de kosten van een onderneming
account analysis : voordelen
gegevens relatief eenvoduig ter beschikking
minder duur ivm engineering analysis
account analysis : nadelen
subjectief
niet zo nauwkeurig (obv 1 reeks observaties)
welke type data gebruiken : high-low, visual fit and least-squares methods
historical data over serveral periods
why are high-low, visual fit and least-squares method better than the analytische benadering
obkectiever
engineering analysis (>< hard evidence)
account analysis (>< more than one period)
high-low methods
a simple method for measuring a linear cost-function from past cost data
it focuses on the highest-activity and lowest-activity points and fitting a line through these points
high low method : voordelen
snel
eenvoudig
high low method : nadelen
gebruik van maar twee punten
subjectief (vooral mbt outliers)
visual fit method
it visually fits a straight line through a plot of all of the available data
least-squares regression method
measures a cost function objectiverly by using statistics to fit a cost function to all the data
R² measures how much of the fluctuation of a cost is explained by changes in the cost driver