2.1 Measures of economic performance
1/47
There's no tags or description
Looks like no tags are added yet.
Name | Mastery | Learn | Test | Matching | Spaced | Call with Kai |
|---|
No analytics yet
Send a link to your students to track their progress
48 Terms
What does real GDP measure?
Measures national output. The amount that is actually being produced in the economy in a year.
+measure of growth
+measure of living standards
Real vs nominal
REAL VALUES | NOMINAL VALUES |
|---|---|
Measured by adding up just the quantity of all goods + services in the economy. nominal GDP - inflation rate | Measured by adding up the prices of all goods + services in the economy. -not accurate as prices change due to inflation. |
Real income vs nominal income
Real income: How much your income is actually worth in terms of the amount of goods that you can purchase.
(nominal income with the effects of inflation removed)
Nominal income: The total amount of income you actually earn in a given period of time.
Economic growth
Methods to measure GDP?
An increase in real GDP
GDP measured by:
output method: final value of all goods + services produced in an economy per year.
income method: all the factor incomes(rewards from factors of production) earned in an economy per year.
expenditure method: C + I + G + (X-M)
output = income = expenditure
% change in real GDP formula
% change in nominal GDP - inflation rate
GNI (gross national income) / GNP (gross national product)
The total income generated by a country’s factors of production regardless of where those factors of production are located.
GDP + net income from abroad(remittances: money sent back home or sent abroad)
+takes into account remittances sent home
+takes into account FDI
-same cons as GDP (minus remittances)
2 difficulties when comparing nominal GDP between countries
different currencies + exchange rates are volatile
different price levels (inflation rates)
Value vs volume
Value measures the worth of goods and services.
Volume measures the quantity/ number of goods and services produced.
GDP limitations
Ignores…
Population changes
Real GDP doesn’t reflect changes in population so its better to use GDP per capita.
Income distribution
Real GDP doesn’t show how much money is distributed + so it ignores income inequality.
Types of goods + services being produced
Real GDP ignores the type of goods produced and living standards will be lower if there is significant production of goods with negative externalities. e.g. environmental costs
Underground economies
Real GDP does not measure the underground or shadow economy and so it ignores illegal transactions.
Subsistence economies
Real GDP doesn’t include the subsistence economy where people produce goods to consume for themselves
Ignores factor incomes from abroad
Doesn’t take into account remittances from abroad, giving inaccurate results.
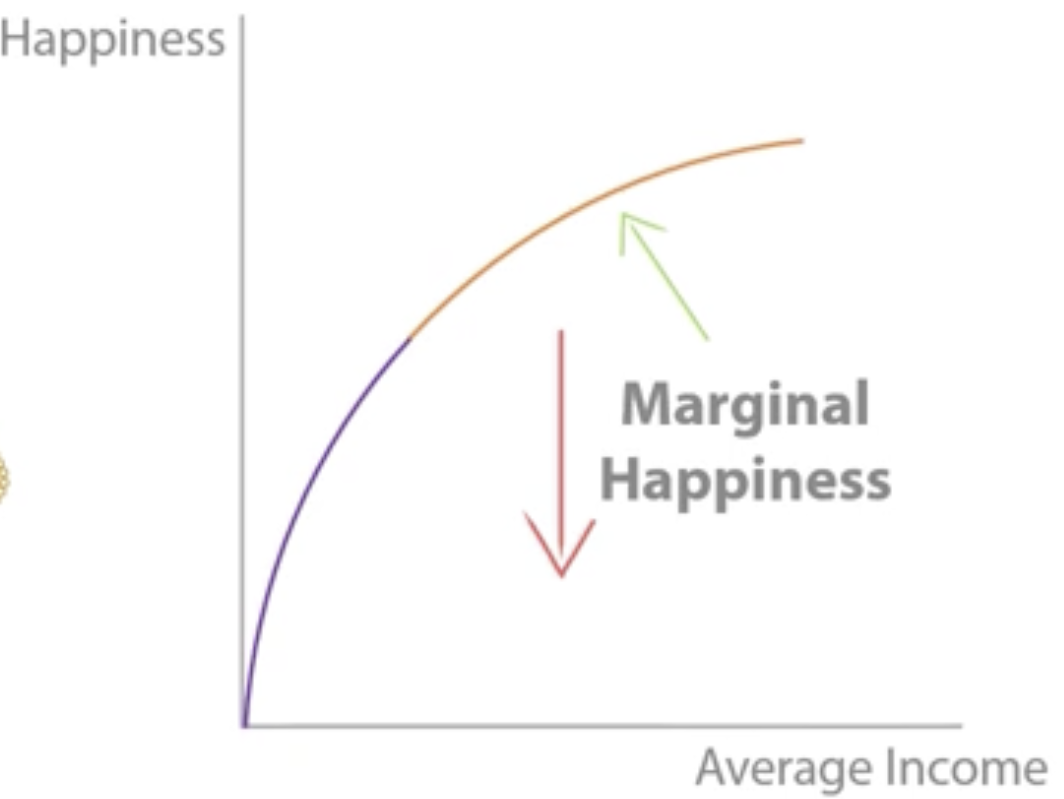
Relationship between real income + happiness: Easterlin paradox
As income increases, happiness increases up to a point as people are able to afford important items like food and a home.
However, the marginal happiness from each extra £ of income then begins to fall as people spend money on things they don’t need and which bring less happiness.
How can happiness be measured?
The Office for National Statistics national well-being survey.
Measures data such as:
Life satisfaction
Years of healthy life expectancy
Median household income
Feeling of safety + security
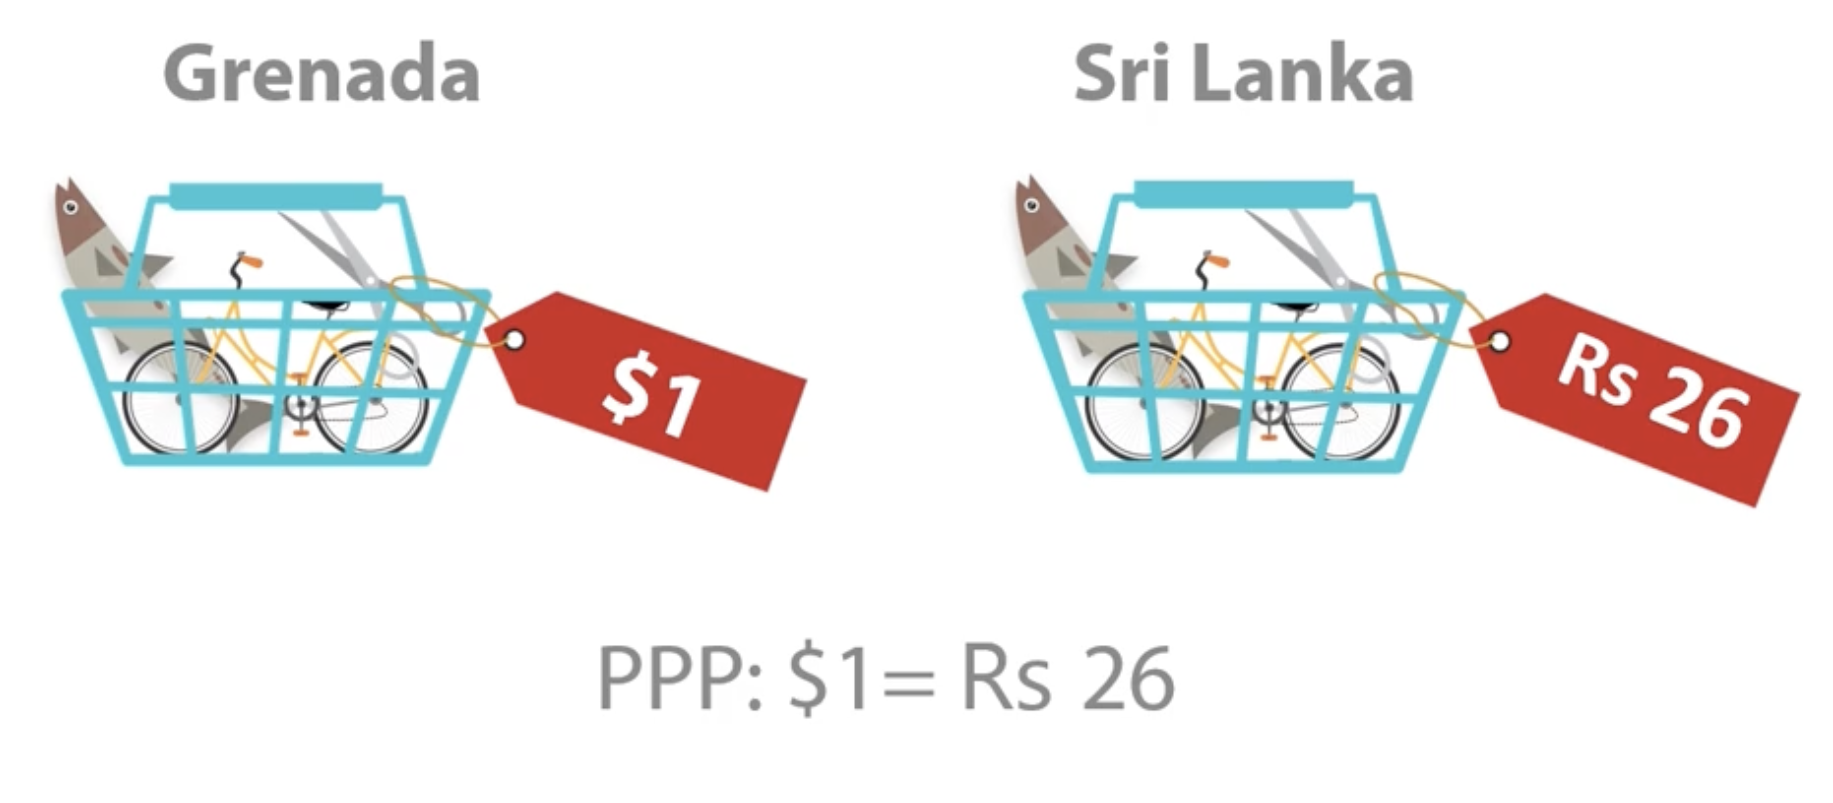
Purchasing power parities
A PPP between two countries tells us how much of one currency is needed to purchase a basket of goods compared to another currency
-helps compare cost of living between countries
Inflation
How does it affect the value of money
A sustained increase in the general price level. Target is at 2% ±1%.
As goods get more expensive, the same amount of money can buy you less and so value of money has decreased.
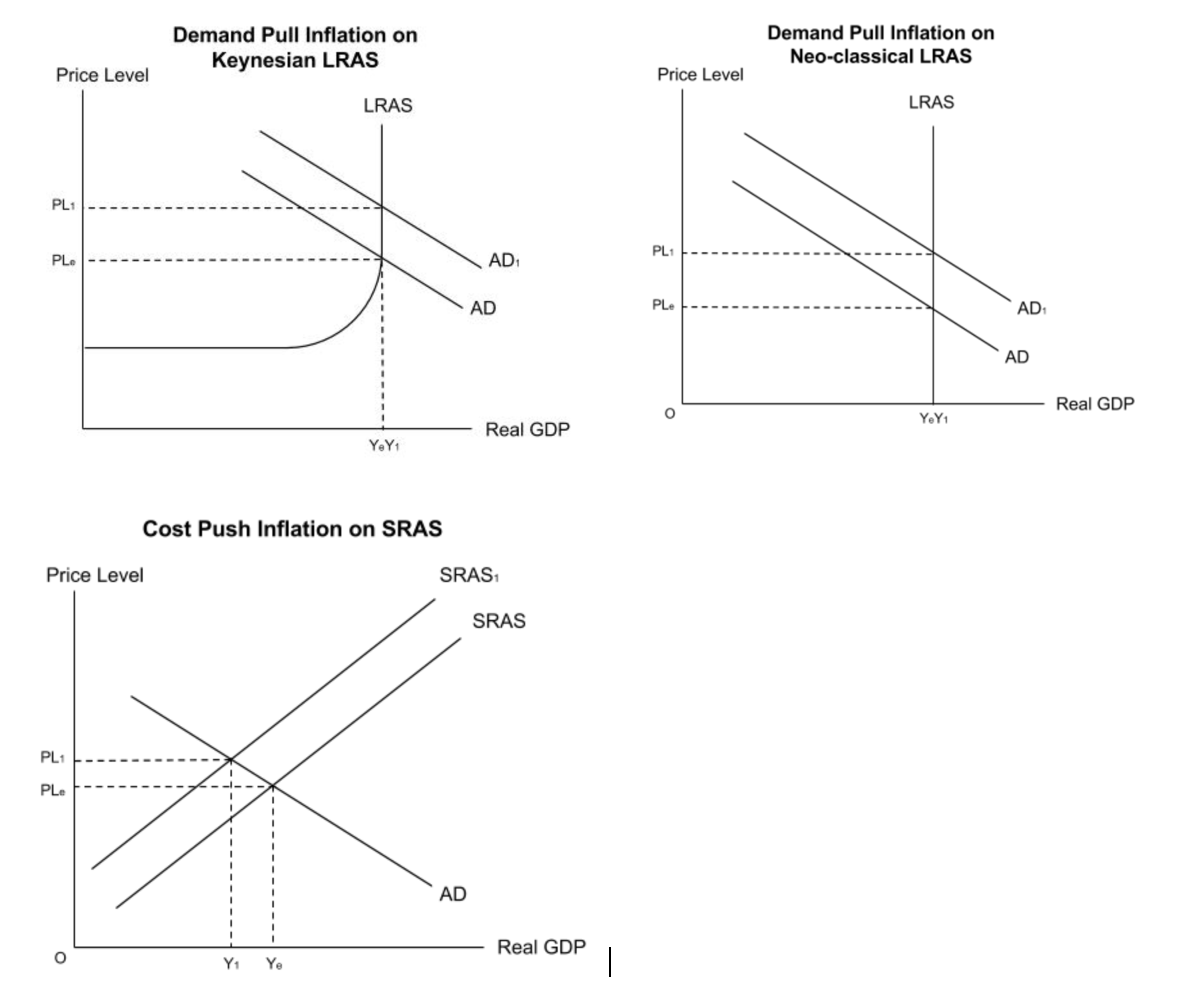
Causes of inflation
Demand pull
AD increases(talk about reasons why), leading to an increase in price level and therefore inflation.
Cost push
Cost increases, SRAS decreases(talk about reasons why), pushing up price level, causing inflation.
Inflation rate
% change in price level
(change in price level / original price level) x 100
Positive inflation rate = inflation
Negative inflation rate = deflation
Deflation
A sustained decrease in the general price level in an economy in a year
Deflationary spiral
Begins with deflation where there is a sustained fall in price level. Consumers notice falling prices and decide to delay their purchases + wait for prices to fall further. This causes reduction in AD as consumption is a component of AD. This lowers price level again, and the cycle repeats.
Causes of deflation.
A reduction(left shift) in AD or an increase(right shift) in SRAS or LRAS.
Disinflation
When the inflation rate is positive but at a decreasing rate.
Costs+benefits of inflation
COSTS
Lower purchasing power: if incomes+wages don’t rise in line with inflation, people aren’t as wealthy, afford less, living standards ↓, poverty.
Value of savings ↓: unemployed/ elderly with pensions rely on savings. If value of savings ↓, living standards ↓-worsens inequality.
Lower export competitiveness: if relative inflation is high, exports become more expensive, less export demand + revenue, current account deficit.
BENEFITS
Value of debt ↓: If value of money decreases due to inflation, the money you owe is less, so real value of debt decreases.
Improvement of gov. finances: More tax revenue e.g. fuel duty, VAT increasing due to prices of goods increasing, less gov. spending on wages in public sector as value of real wage decreases.
Consumption increases: consumers don’t delay purchases(deflationary spiral) as they don’t wait for inflation to rise even further.
Evaluation for effects of inflation
Rate of inflation: higher inflation means the costs are worse than if rate was low.
Cause of inflation: demand pull inflation leads to higher growth + lower unemployment, easier to solve. cost push leads to the opposite.
Calculating UK’s price level (CPI): Basket of goods
Set base year to index of 100- should be a stable year.
STAGE 1: Interview 7000 households to find 650 most common goods + services and to find the % of their spending goes on each of these goods + services.
STAGE 2: Collect prices of these 650 goods to find avg price of each good
STAGE 3: a weighted avg of all prices is calculated in order to find the total cost of the basket in the given year. weighted avg = % of total spending X price.
Consumer price index(CPI)
Cost of basket converted into index numbers
Index = (cost of basket in current year / cost of basket in base number) x 100
This is the inflation rate
4 Problems with CPI
Unusual spending habits- the uncommon goods one consumer spends on (not in CPI basket) may be different to what the avg consumer spends on, so their inflation rate may be different.
Changes in quality- an increase in price may be due to an improvement in quality. This is not the same as inflation.
Time lag- CPI only updates once per year, so it might not include new goods + services
Doesn’t include mortgages- Only takes into account goods + services.
Retail prices index(RPI)
Includes mortgage repayments, unlike CPI
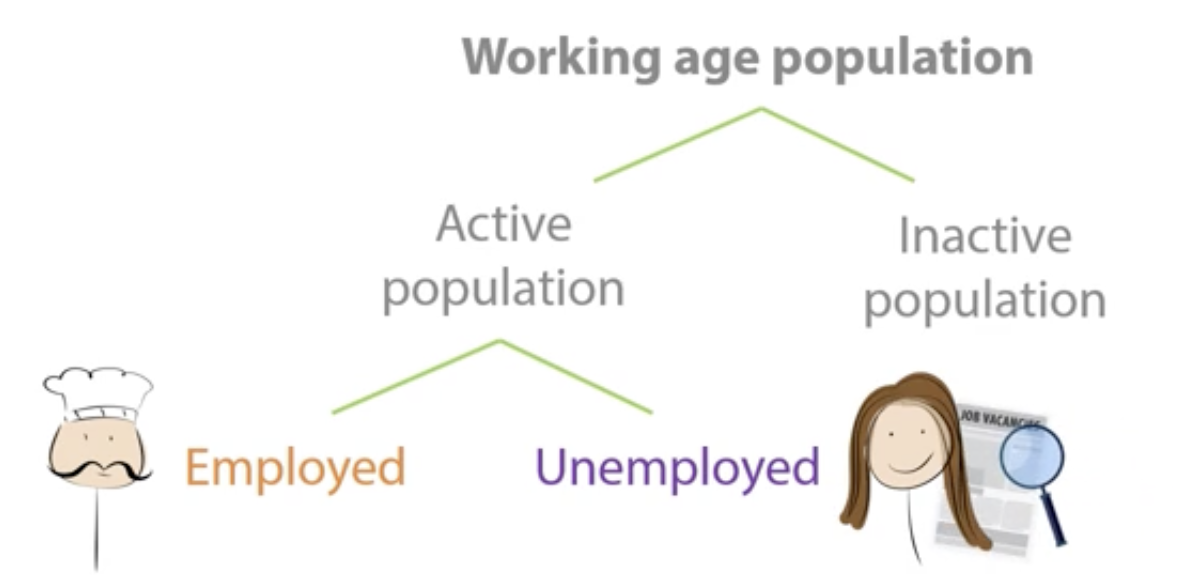
Unemployment
Working age population: 16-64 years
-economically active population/ workforce: people of working age who are able to work + actively seeking work/ actively working.
-economically inactive population: people of working age who aren’t able to work/ aren’t actively seeking work e.g. students, sick+disabled
Unemployment: when someone is able to work and is actively seeking work but is not currently working.
Changes in rates of unemployment
Unemployment level: number of people unemployed.
Unemployment rate: % of people unemployed out of the active population.
(unemployment level / active population) x 100
unemployement rate decreases if: unemployment level ↓, economically active population ↑.
-unemployment level can increase due to immigration without affecting employment level.
Changes in employment rate
Employment rate: % of people employed
(employment level / total working age population) x 100
employment rate may fall if: number of employed people ↓, working age population ↑.
Activity/ participation rate
% of the working age population actively seeking work or actively working.
(active population / working age population) x 100
Measuring unemployment
ILO Labour Force Survey: Surveys 60 000 households every quarter to see if anyone has been out of work for 4 weeks + is ready to start work within 2 weeks.
-small sample size: not accurate estimate of unemployment across the UK (not representative)
The Claimant count: measures how many people are claiming unemployment benefits.
-not everyone who is unemployed will claim benefits(stigma around claiming benefits, strict criteria for claiming benefits, e.g. having a partner who is a high earner): underestimates unemployment
Underemployment
When workers are employed but working fewer hours than they want to or underusing their skills.
Types of unemployment
Real wage/ Classical unemployment
Structural unemployment
Cyclical unemployment
Frictional unemployment
Seasonal unemployment
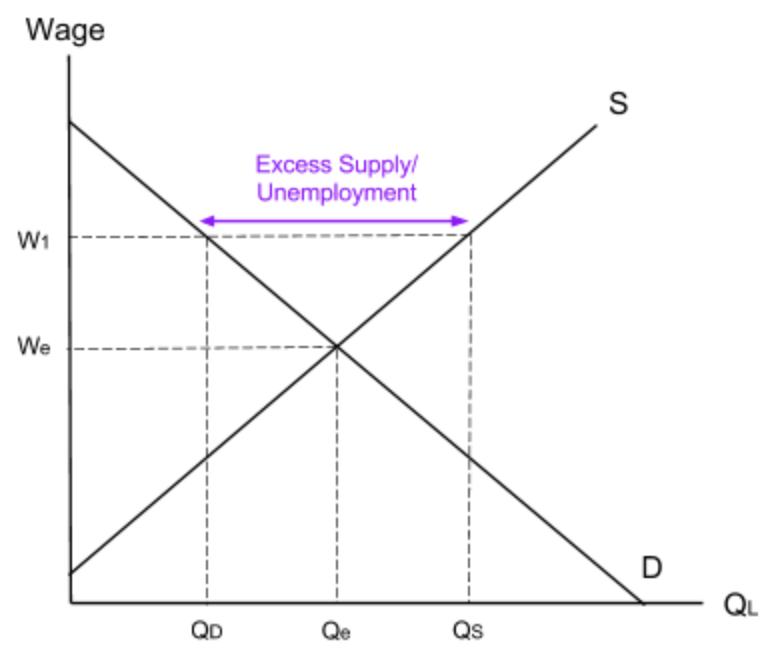
Real wage/ Classical unemployment
When wage is above the equilibrium wage.
-high supply of labour but low demand for it, creating excess supply of labour(unemployment).
CAUSES:
gov. sets minimum wage(lowest wage employers an hire for) above the equilibrium(more labour supply than labour demand).
trade unions: workers go on strike for higher wages above equilibrium.
Solutions: cut minimum wage to reduce unemployment( evaluation: in a recession, cutting wages leads to lower spending→lower AD+economic growth, income inequality ↑)
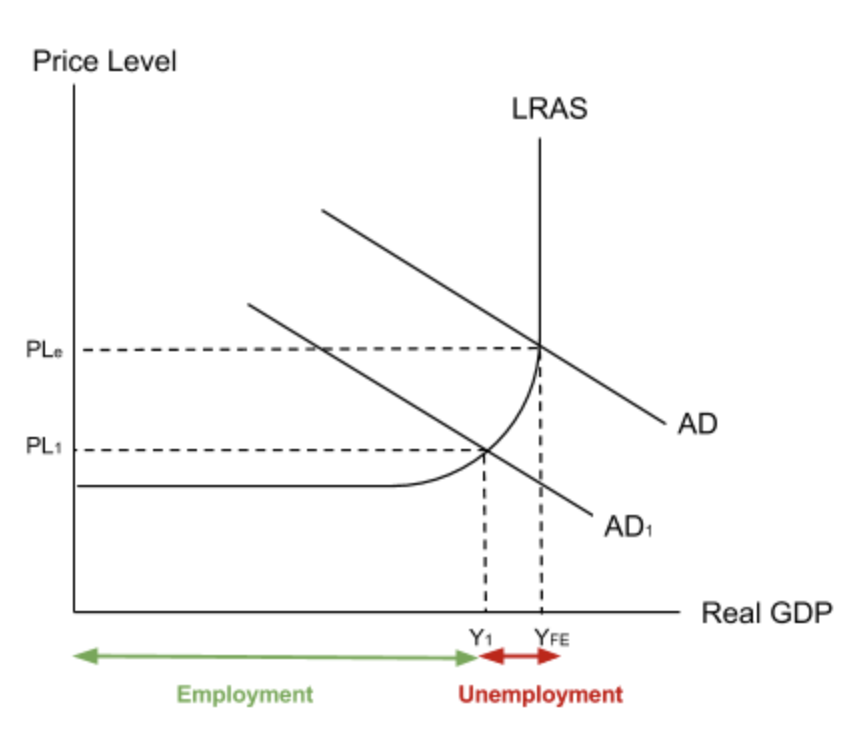
Cyclical/ demand deficient
↓ in demand for goods + services → ↓ firms production → less workers required → ↓ derived demand for labour → unemployment.
Solutions: fiscal + monetary expansionary: cut taxes + interest rates, increase gov. spending + money supply,
Structural unemployment
Occurs when there is a mismatch between the skills people possess and the skills required for available jobs.
e.g. UK economy shifted from manual labour to services like IT in 1980’s.
REASONS:
Occupational immobility: when workers can’t find work because they lack the skills needed to move into new professions.
Geographical immobility: when workers struggle to move between different areas.
Solutions:
-occupational: Interventionist: education, training
-geographical: Interventionist: improve transport.
Frictional unemployment
When people are temporarily unemployed while searching for a new job.
Solutions: Market-based: Reduce unemployment benefits, to encourage people to take a job quicker.
Seasonal unemployment
When people are unemployed during certain seasons because their job is seasonal. e.g. ice cream truck
Solutions: Regulation: gov. pays workers throughout the year, even if work is temporary.
Costs + benefits of unemployment, evaluation
COSTS
Deterioration of gov. finances: more gov. spending on unemployment benefits, less income tax revenue, less VAT tax revenue as spending decreases
Loss of output: country performs within productive potential→don’t get max production of goods + services→harder access to goods+services→lower standard of living
Social costs: more poverty, homelessness, crime rates rising, mental health issues due to lower incomes -burden on gov. finances
BENEFITS:
Better current account position: lower incomes→people can’t afford imports
Lower inflation: workers don’t have wage bargaining power→wages don’t rise→lower cost of production→prices don’t rise
EVALUATION
rate of unemployment: if rate is high, costs outweigh the benefits
type of unemployment: structural unemployment has the worst costs(occupational immobility of labour is hard to fix as it takes time to gain skill), frictional is short-term and doesn’t last long.
Significance of migration for employment
Supply of labour at all wage rates increase with more migration
Migrants bring high quality skills to the workforce, increasing productivity + increasing skillset of labour market. This increases international competitiveness.
Balance of payments
Record of payments(or transactions) between one country and the rest of the world.
-record of all money flowing in and out of the country.
-made of: current account, financial account, capital account
Components of current account(measures inflows and outflows received
Trade in goods: imported + exported goods e.g. consumer goods, raw materials
Trade in services: imported + exported services e.g. tourism, financial services
-imports are a leakage in economy→current account ↓.
-exports are an injection into economy→current account ↑.
Investment income: Any rent or profit earned on investment made abroad. e.g. profits, interest
-paying investment income to a foreign investor ↓ the current account (money exits UK)
Current transfers: Money is transferred abroad without getting any goods/ services back in exchange. e.g. foreign aid- aid sent abroad, remittances- money transferred home from relatives working abroad.
Current account deficit
A negative current account where more money leaves the country than entering it.
e.g. UK current account deficit of -£111B in 2016
Current account surplus
A positive current account where more money is entering than leaving it.
e.g. Germany: +€268B in 2016
Capital + financial accounts
Tracks investment
-current account deficit is always balanced by capital + financial account surplus.
Current account equilibrium as a macroeconomic objective
When a country has a CA surplus, they may invest into a foreign country with a CA deficit, causing a FA surplus in the foreign country and FA deficit in the domestic country. This balances BOP.
Factors causing current account deficit
exchange rates: if the currency appreciates, imports get cheaper and exports more expensive. This increases import expenditure and export revenue decreases, ↓ current account.
relative inflation: higher inflation rate→exports more expensive→ demand for exports decrease → export revenue decreases → current account decreases.
higher costs of production→export prices increase → decrease foreign consumers demand for exports → decrease export revenue → decrease current account.
quality: lower quality exports → sells fewer exports → export revenue decreases → current account decreases.
domestic growth: growth causes income increase→import more normal goods→import expenditure→current account decreases.
Consequences of current account deficit
Decrease in AD: net exports decrease→AD decreases→economic growth decreases→lower demand for labour→more unemployment
+if CA deficit is a small % of GDP, small decrease in AD, small decrease in GDP
Decrease in exchange rate: If imports>exports, selling its currency to buy foreign goods, supply of currency increases, depreciating it. Causes higher import prices, increasing cost of production for firms + therefore increasing cost push inflation
+expensive imports can correct CA deficit
Decrease in export revenue: less revenue to the gov→ can’t spend on benefits, public services→ lower quality services + lower standard of living for those relying on benefits + lower quality public services like healthcare→ lower LRAS + higher CP inflation
Solutions to decrease CA deficit
Contractionary fiscal + monetary policy: Increase tax, decrease gov. spending, increase interest rates→AD decreases→lower income→MPM decreases→CA improves.
-conflict of objectives: By decreasing AD, growth ↓, inflation may decrease below target rate.
-consumer+business confidence: if this is high, AD may not fall.
Supply side policies to boost international competitiveness: Deregulation, gov. spending on infrastructure- boost exports+export revenue, reduce CA deficit. Switch from buying imports to domestic producers, decreasing imports, reducing CA.
-time lag+cost: LR policies which take a long time to work-not suitable for a short term problem, opportunity cost
-no guarantee of success