Exam 1 Solutions
1/80
There's no tags or description
Looks like no tags are added yet.
Name | Mastery | Learn | Test | Matching | Spaced |
|---|
No study sessions yet.
81 Terms
Question 1
Computing Return on Assets and Applying the Accounting Equation
Nordstrom Inc. reports net income of $564 million for its fiscal year ended February 2019. At the beginning of that fiscal year, Nordstrom had $8,115 million in total assets. By fiscal year ended February 2019, total assets had decreased to $7,886 million.
What is Nordstrom's ROA?
Round answer to one decimal place (ex: 0.2345= 23.5%).
Given:
Net Income = $564 million
Beginning Total Assets = $8,115 million
Ending Total Assets = $7,886 million
ROA Formula:
ROA=Net Income/Average Assets
Average Assets:
Average Assets =(8,115+7,886)/2 = 8,005.5
Calculation:
ROA= 564/8,000.5 = .0705 or 7.1%
Question 2
Balance Sheet Equation and Financing Sources
In a recent year, the total assets of Microsoft Corporation equal $258,848 million, and its equity is $82,718 million.
a. What is the amount of its liabilities?
b. Does Microsoft receive more financing from its owners or nonowners?
c. What percentage offinancing is provided by Microsoft's owners Round answer to one decimal place (ex: 0.2345 = 23.5%).
Given:
Total Assets = $258,848 million
Equity = $82,718 million
Balance Sheet Equation:
Assets=Liabilities+Equity
a. Liabilities:
Liabilities= Assets−Equity =258,848−82,718 =176,130million
b. Explanation:
Owner financing is 32% of its total financing ($82,718 million / $258,848 million). Nonowners finance 68% of Microsoft’s total assets.
c. Owner Financing Percentage:
Equity/Total Assets= 82,718/258,848 = 0.3195 or 32%
Question 3
Identifying Key Numbers from Financial Statements
Access the September 30, 2018, 10-K for Starbucks Corporation at the SEC's database for financial reports
Given:
Total assets $ 24.156.4
Totalliabilities $ 22,980.6
Total equity $ 1,175.8
What percent of Starbucks' assets is financed by owners?
Round answer to one decimal place (ex: 0.2345 = 23.5%).
Owner Financing Percentage:
1,175.8/24,156.4 = 0.0487 or 4.9%
Question 4
Computing Return on Equity and Return on Assets
The following table contains financial statement information for Walmart Inc.
Year | Total Assets | Net Income | Sales | Equity |
2018 | $219,295 | $6,670 | $510,329 | $72,496 |
2017 | $204,522 | $9,862 | $495,761 | $77,869 |
2016 | $198,825 | $13,643 | $481,317 | $77,798 |
a. Compute return on equity (ROE) for the two recent years.
b. Compute return on assets (ROA) for the two recent years.
c. Compute profit margin (PM) for the two recent years.
d. Compute asset turnover (AT) for the two recent years.
• Round ROE, ROA and PM to one decimal place (example: 0.2345 = 23.5%).
• Round AT to two decimal places (example: 1.35).
e. Which of the following best explains the change in ROA during 2018?
Return on Equity (ROE):
ROE = Net Income/Average Equity
2018 ROE:
Average Equity = (72,496+77,869)/2 = 75,182.5
ROE = 6,670/75,182.5 = 0.0997 or 8.9%
2017 ROE:
Average Equity = (77,869+77,798)/2 = 77,833.5
ROE = 9,862/77,833.5 = 0.1267 or 12.7
Return on Assets (ROA):
ROA = Net Income/Average Assets
2018 ROA:
Average Assets = (219,295+204,522)/2 = 211,908.5
ROA = 6,670 / 211,908.5 = 0.0315 or 3.1%
2017 ROA:
Average Assets = (204,522+198,825)/2 = 201,673.5
ROA = 9,862/201,673.5 = 0.0489 or 4.9%
Profit Margin (PM):
PM = Net Income/Sales
2018 PM:
6,670/510,329 = 0.0131 or 1.3%
2017 PM:
9,862/495,761 = 0.0199 or 2.0%
Asset Turnover (AT):
AT = Sales/Average Assets
2018 AT:
Average Assets = (219,295+204,522)/2 = 211,908.5
AT = 510,329/211,908.5 = 2.41
2017 AT:
Average Assets = (204,522+198,825)/2 = 201,673.5
AT = 495,761/201,673.5 = 2.46
The company's profitability weakened considerably
Question 5
Formulating Financial Statements from Raw Data and Calculating Ratios
Following is selected financial information from JM Smucker Co. for the year ended April 30, 2018 ($ millions).
Current assets, end of year: $1,555.0
Long-term liabilities, end of year: $6,376.3
Cash, end of year: 192.6
Stockholders' equity, end of year: 7,891.1
Cash from investing activities: (277.6)
Cash from operating activities: 1,218.0
Cost of products sold: 4,521.0
Total assets, beginning of year: 15,639.7
Total liabilities, end of year: 7,410.1
Revenue: 7,357.1
Cash from financing activities: (914.6)
Total expenses, other than cost of product sold: 1,497.5
Stockholders' equity, beginning of year: 6,850.2
Dividends paid: 350.3
* Cash from financing activities includes the effects of foreign exchange rate fluctuations.
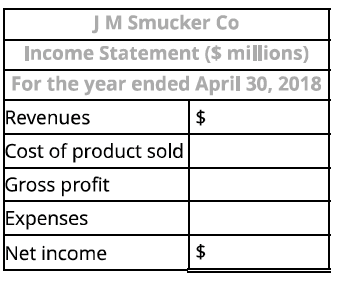
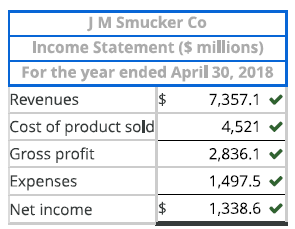
a. Prepare the income statement for the year ended April 30, 2018.
Note: Do not use negative signs with any of your answers.
a. Prepare the income statement for the year ended April 30, 2018.
Given Values:
Revenue: $7,357.1 million (provided).
Cost of Products Sold (COGS): $4,521.0 million (provided).
Total Expenses (other than COGS): $1,497.5 million (provided).
2. Formulated Values:
Gross Profit = Revenue - COGS = $7,357.1 - $4,521.0 = $2,836.1 million.
Net Income = Gross Profit - Expenses = $2,836.1 - $1,497.5 = $1,338.6 million.
Question 5
Formulating Financial Statements from Raw Data and Calculating Ratios
Following is selected financial information from JM Smucker Co. for the year ended April 30, 2018 ($ millions).
Current assets, end of year: $1,555.0
Long-term liabilities, end of year: $6,376.3
Cash, end of year: 192.6
Stockholders' equity, end of year: 7,891.1
Cash from investing activities: (277.6)
Cash from operating activities: 1,218.0
Cost of products sold: 4,521.0
Total assets, beginning of year: 15,639.7
Total liabilities, end of year: 7,410.1
Revenue: 7,357.1
Cash from financing activities: (914.6)
Total expenses, other than cost of product sold: 1,497.5
Stockholders' equity, beginning of year: 6,850.2
Dividends paid: 350.3
* Cash from financing activities includes the effects of foreign exchange rate fluctuations.
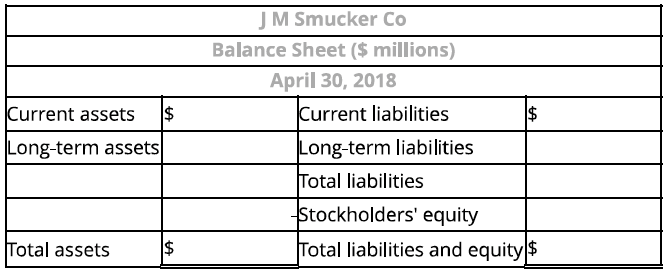
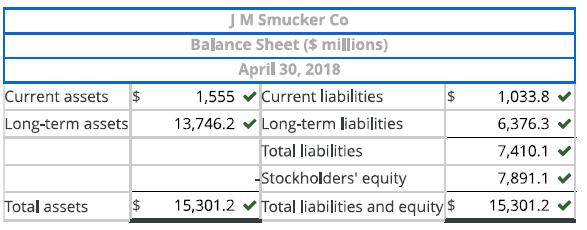
b. Prepare the balance sheet as of April 30, 2018.
Given Values:
Current assets (end of year): $1,555.0 million.
Total liabilities (end of year): $7,410.1 million.
Long-term liabilities (end of year): $6,376.3 million.
Stockholders' equity (end of year): $7,891.1 million.
Stockholders' equity (beginning of year): $6,850.2 million.
Formulated Values:
Total Assets (end of year) = Total Liabilities + Stockholders' Equity = $7,410.1 + $7,891.1 = $15,301.2 million.
Long-term assets = Total Assets - Current Assets = $15,301.2 - $1,555.0 = $13,746.2 million.
Current liabilities = Total Liabilities - Long-term Liabilities = $7,410.1 - $6,376.3 = $1,033.8 million.
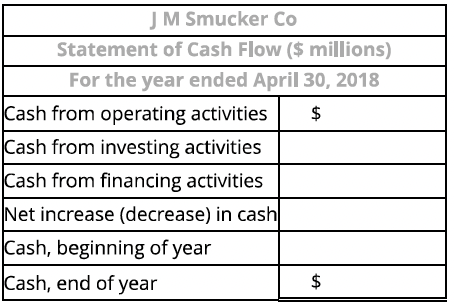
Question 5
Formulating Financial Statements from Raw Data and Calculating Ratios
Following is selected financial information from JM Smucker Co. for the year ended April 30, 2018 ($ millions).
Current assets, end of year: $1,555.0
Long-term liabilities, end of year: $6,376.3
Cash, end of year: 192.6
Stockholders' equity, end of year: 7,891.1
Cash from investing activities: (277.6)
Cash from operating activities: 1,218.0
Cost of products sold: 4,521.0
Total assets, beginning of year: 15,639.7
Total liabilities, end of year: 7,410.1
Revenue: 7,357.1
Cash from financing activities: (914.6)
Total expenses, other than cost of product sold: 1,497.5
Stockholders' equity, beginning of year: 6,850.2
Dividends paid: 350.3
* Cash from financing activities includes the effects of foreign exchange rate fluctuations.
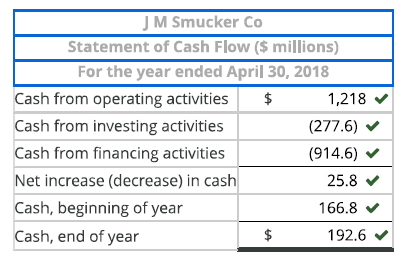
c. Prepare the statement of cash flows for the year ended April 30, 2018.
Note: Use a negative sign with your answer to indicate cash was used by activities and/or a decrease in cash.
Given Values:
Cash from operating activities: $1,218.0 million (provided).
Cash from investing activities: $(277.6) million (provided).
Cash from financing activities: $(914.6) million (provided).
Cash (end of year): $192.6 million (provided).
Formulated Values:
Net Increase (Decrease) in Cash = Operating Activities + Investing Activities + Financing Activities = $1,218.0 - $277.6 - $914.6 = $25.8 million.
Cash (beginning of year) = Cash (end of year) - Net Increase in Cash = $192.6 - $25.8 = $166.8 million.
Question 5
Formulating Financial Statements from Raw Data and Calculating Ratios
Following is selected financial information from JM Smucker Co. for the year ended April 30, 2018 ($ millions).
Visual Summary
a. Prepare the income statement for the year ended April 30, 2018.
b. Prepare the balance sheet as of April 30, 2018.
c. Prepare the statement of cash flows for the year ended April 30, 2018.
Summary Table of Key Values:
Item | Given Value ($ millions) | Formulated Value ($ millions) |
Revenue | $7,357.1 | |
Cost of Products Sold | $4,521.0 | |
Gross Profit | $2,836.1 | |
Expenses | $1,497.5 | |
Net Income | $1,338.6 | |
Total Assets (end of year) | $15,301.2 | |
Long-term Assets | $13,746.2 | |
Current Assets | $1,555.0 | |
Total Liabilities (end of year) | $7,410.1 | |
Current Liabilities | $1,033.8 | |
Long-term Liabilities | $6,376.3 | |
Stockholders' Equity (end of year) | $7,891.1 | |
Cash from Operating Activities | $1,218.0 | |
Cash from Investing Activities | $(277.6) | |
Cash from Financing Activities | $(914.6) | |
Net Increase in Cash | $25.8 | |
Cash (beginning of year) | $166.8 | |
Cash (end of year) | $192.6 |
Question 5
Formulating Financial Statements from Raw Data and Calculating Ratios
Following is selected financial information from JM Smucker Co. for the year ended April 30, 2018 ($ millions).
Summary Table of Key Values:
Item | Given Value ($ millions) | Formulated Value ($ millions) |
Revenue | $7,357.1 | |
Cost of Products Sold | $4,521.0 | |
Gross Profit | $2,836.1 | |
Expenses | $1,497.5 | |
Net Income | $1,338.6 | |
Total Assets (end of year) | $15,301.2 | |
Long-term Assets | $13,746.2 | |
Current Assets | $1,555.0 | |
Total Liabilities (end of year) | $7,410.1 | |
Current Liabilities | $1,033.8 | |
Long-term Liabilities | $6,376.3 | |
Stockholders' Equity (end of year) | $7,891.1 | |
Cash from Operating Activities | $1,218.0 | |
Cash from Investing Activities | $(277.6) | |
Cash from Financing Activities | $(914.6) | |
Net Increase in Cash | $25.8 | |
Cash (beginning of year) | $166.8 | |
Cash (end of year) | $192.6 |
* Cash from financing activities includes the effects of foreign exchange rate fluctuations.
Current assets, end of year: $1,555.0
Long-term liabilities, end of year: $6,376.3
Cash, end of year: 192.6
Stockholders' equity, end of year: 7,891.1
Cash from investing activities: (277.6)
Cash from operating activities: 1,218.0
Cost of products sold: 4,521.0
Total assets, beginning of year: 15,639.7
Total liabilities, end of year: 7,410.1
Revenue: 7,357.1
Cash from financing activities: (914.6)
Total expenses, other than cost of product sold: 1,497.5
Stockholders' equity, beginning of year: 6,850.2
Dividends paid: 350.3
d. Compute ROA.
Notes: Round ROA, PM, and ROE to one decimal place (ex: 10.5%).
Round AT (asset turnover) to two decimal P-laces (0.33).
Given Values:
Net Income: $1,338.6 million (calculated in the income statement).
Total Assets at the beginning of the year: $15,639.7 million (provided).
Total Assets at the end of the year: $15,301.2 million (calculated in the balance sheet).
Formulated Value:
ROA = Net Income/Average Total Assets
Average Total Assets = (Total Assets (beginning of year)+TotaI Assets (end of year))/2
ROA = 1,338.6/(15,639.7+15,301.2)/2 = .0087 or 8.7%
Question 5
Formulating Financial Statements from Raw Data and Calculating Ratios
Following is selected financial information from JM Smucker Co. for the year ended April 30, 2018 ($ millions).
Summary Table of Key Values:
Item | Given Value ($ millions) | Formulated Value ($ millions) |
Revenue | $7,357.1 | |
Cost of Products Sold | $4,521.0 | |
Gross Profit | $2,836.1 | |
Expenses | $1,497.5 | |
Net Income | $1,338.6 | |
Total Assets (end of year) | $15,301.2 | |
Long-term Assets | $13,746.2 | |
Current Assets | $1,555.0 | |
Total Liabilities (end of year) | $7,410.1 | |
Current Liabilities | $1,033.8 | |
Long-term Liabilities | $6,376.3 | |
Stockholders' Equity (end of year) | $7,891.1 | |
Cash from Operating Activities | $1,218.0 | |
Cash from Investing Activities | $(277.6) | |
Cash from Financing Activities | $(914.6) | |
Net Increase in Cash | $25.8 | |
Cash (beginning of year) | $166.8 | |
Cash (end of year) | $192.6 |
* Cash from financing activities includes the effects of foreign exchange rate fluctuations.
Current assets, end of year: $1,555.0
Long-term liabilities, end of year: $6,376.3
Cash, end of year: 192.6
Stockholders' equity, end of year: 7,891.1
Cash from investing activities: (277.6)
Cash from operating activities: 1,218.0
Cost of products sold: 4,521.0
Total assets, beginning of year: 15,639.7
Total liabilities, end of year: 7,410.1
Revenue: 7,357.1
Cash from financing activities: (914.6)
Total expenses, other than cost of product sold: 1,497.5
Stockholders' equity, beginning of year: 6,850.2
Dividends paid: 350.3
e. Compute profit margin (PM).
Notes: Round ROA, PM, and ROE to one decimal place (ex: 10.5%).
Round AT (asset turnover) to two decimal P-laces (0.33).
Given Values:
Net Income: $1,338.6 million.
Revenue: $7,357.1 million (provided).
Formulated Value:
PM = Net Income/Revenue
PM = 1,338.6/7357.1 = .182 or 18.2%
Question 5
Formulating Financial Statements from Raw Data and Calculating Ratios
Following is selected financial information from JM Smucker Co. for the year ended April 30, 2018 ($ millions).
Summary Table of Key Values:
Item
Given Value ($ millions)
Formulated Value ($ millions)
Revenue
$7,357.1
Cost of Products Sold
$4,521.0
Gross Profit
$2,836.1
Expenses
$1,497.5
Net Income
$1,338.6
Total Assets (end of year)
$15,301.2
Long-term Assets
$13,746.2
Current Assets
$1,555.0
Total Liabilities (end of year)
$7,410.1
Current Liabilities
$1,033.8
Long-term Liabilities
$6,376.3
Stockholders' Equity (end of year)
$7,891.1
Cash from Operating Activities
$1,218.0
Cash from Investing Activities
$(277.6)
Cash from Financing Activities
$(914.6)
Net Increase in Cash
$25.8
Cash (beginning of year)
$166.8
Cash (end of year)
$192.6
* Cash from financing activities includes the effects of foreign exchange rate fluctuations.
Current assets, end of year: $1,555.0
Long-term liabilities, end of year: $6,376.3
Cash, end of year: 192.6
Stockholders' equity, end of year: 7,891.1
Cash from investing activities: (277.6)
Cash from operating activities: 1,218.0
Cost of products sold: 4,521.0
Total assets, beginning of year: 15,639.7
Total liabilities, end of year: 7,410.1
Revenue: 7,357.1
Cash from financing activities: (914.6)
Total expenses, other than cost of product sold: 1,497.5
Stockholders' equity, beginning of year: 6,850.2
Dividends paid: 350.3
f. Compute asset turnover (AT).
Notes: Round ROA, PM, and ROE to one decimal place (ex: 10.5%).
Round AT (asset turnover) to two decimal P-laces (0.33).
Given Values:
Revenue: $7,357.1 million.
Average Total Assets: $15,470.45 million (calculated from the ROA formula).
Formulated Value:
AT = Revenue/Average Total Assets
AT = 7,357.1/15,470.45 = 0.48
Question 5
Formulating Financial Statements from Raw Data and Calculating Ratios
Following is selected financial information from JM Smucker Co. for the year ended April 30, 2018 ($ millions).
Summary Table of Key Values:
Item
Given Value ($ millions)
Formulated Value ($ millions)
Revenue
$7,357.1
Cost of Products Sold
$4,521.0
Gross Profit
$2,836.1
Expenses
$1,497.5
Net Income
$1,338.6
Total Assets (end of year)
$15,301.2
Long-term Assets
$13,746.2
Current Assets
$1,555.0
Total Liabilities (end of year)
$7,410.1
Current Liabilities
$1,033.8
Long-term Liabilities
$6,376.3
Stockholders' Equity (end of year)
$7,891.1
Cash from Operating Activities
$1,218.0
Cash from Investing Activities
$(277.6)
Cash from Financing Activities
$(914.6)
Net Increase in Cash
$25.8
Cash (beginning of year)
$166.8
Cash (end of year)
$192.6
* Cash from financing activities includes the effects of foreign exchange rate fluctuations.
Current assets, end of year: $1,555.0
Long-term liabilities, end of year: $6,376.3
Cash, end of year: 192.6
Stockholders' equity, end of year: 7,891.1
Cash from investing activities: (277.6)
Cash from operating activities: 1,218.0
Cost of products sold: 4,521.0
Total assets, beginning of year: 15,639.7
Total liabilities, end of year: 7,410.1
Revenue: 7,357.1
Cash from financing activities: (914.6)
Total expenses, other than cost of product sold: 1,497.5
Stockholders' equity, beginning of year: 6,850.2
Dividends paid: 350.3
g. Compute ROE.
Notes: Round ROA, PM, and ROE to one decimal place (ex: 10.5%).
Round AT (asset turnover) to two decimal P-laces (0.33).
Given Values:
Net Income: $1,338.6 million.
Stockholders' equity at the beginning of the year: $6,850.2 million (provided).
Stockholders' equity at the end of the year: $7,891.1 million (calculated in the balance sheet).
Formulated Value:
ROE = Net Income / Average Stockholders Equity
Average Stockholder Equity = (6,805.2+7,891.1)/2 = 7,370.65
ROE = 1,338.6/(6,805.2+7,891.1)/2 = .182 or 18.2%
Question 5
Formulating Financial Statements from Raw Data and Calculating Ratios
Following is selected financial information from JM Smucker Co. for the year ended April 30, 2018 ($ millions).
Visual Summary
d. Compute ROA.
e. Compute profit margin (PM).
f. Compuke asset turnover (AT).
g. Compute ROE.
Summary Table of Calculations:
Item | Given Value ($ millions) | Formulated Value |
Net Income | $1,338.6 | |
Total Assets (beginning of year) | $15,639.7 | |
Total Assets (end of year) | $15,301.2 | |
Average Total Assets | $15,470.45 million | |
Revenue | $7,357.1 | |
Stockholders' Equity (beginning of year) | $6,850.2 | |
Stockholders' Equity (end of year) | $7,891.1 | |
Average Stockholders' Equity | $7,370.65 million | |
ROA | 8.7% | |
Profit Margin (PM) | 18.2% | |
Asset Turnover (AT) | 0.48 | |
ROE | 18.2% |
Final Summary of Ratios:
d. ROA: 8.7%
e. Profit Margin (PM): 18.2%
f. Asset Turnover (AT): 0.48
g. ROE: 18.2%
Question 6
Transaction a: The company issued common stock in exchange for cash and property and equipment.
Balance Sheet:
Cash: Increases (1) (company receives cash).
Noncash Assets: Increases (1) (company receives property and equipment).
Contributed Capital: Increases (1) (common stock issued).
Statement of Cash Flows:
Financing Cash Flow: Increases (1) (cash raised through stock issuance).
Income Statement: No impact (equity transactions don’t affect revenue or expenses).
Statement of Stockholders’ Equity:
Contributed Capital: Increases (1) (due to stock issuance).
Question 6
Transaction b: The company paid cash for rent of office furnishings and facilities.
Balance Sheet:
Cash: Decreases (2) (cash paid for rent).
Retained Earnings: Decreases (2) (net income decreases retained earnings).
Statement of Cash Flows:
Operating Cash Flow: Decreases (2) (rent is an operating expense).
Income Statement:
Expenses: Increases (1) (rent is an expense).
Net Income: Decreases (2) (due to higher expenses).
Statement of Stockholders’ Equity:
Retained Earnings: Decreases (2) (net income decrease lowers retained earnings).
Question 6
Transaction c: The company performed services for clients and immediately received cash earned.
Balance Sheet:
Cash: Increases (1) (cash received).
Retained Earnings: Increases (1) (net income increases retained earnings).
Statement of Cash Flows:
Operating Cash Flow: Increases (1) (cash received from services).
Income Statement:
Revenues: Increases (1) (services earned revenue).
Net Income: Increases (1) (higher revenues).
Statement of Stockholders’ Equity:
Retained Earnings: Increases (1) (net income increases retained earnings).
Question 6
Transaction d: The company performed services for clients and sent a bill with payment due in 60 days.
Balance Sheet:
Noncash Assets: Increases (1) (accounts receivable increases).
Retained Earnings: Increases (1) (net income increases retained earnings).
Statement of Cash Flows:
No impact
Income Statement:
Revenues: Increases (1) (services earned revenue).
Net Income: Increases (1) (higher revenues).
Statement of Stockholders’ Equity:
Retained Earnings: Increases (1) (net income increases retained earnings).
Question 6
Transaction e: The company compensated an office employee with cash as salary.
Balance Sheet:
Cash: Decreases (2) (cash paid for salaries).
Retained Earnings: Decreases (2) (net income decreases retained earnings).
Statement of Cash Flows:
Operating Cash Flow: Decreases (2) (cash used for employee salary).
Income Statement:
Expenses: Increases (1) (salaries are expenses).
Net Income: Decreases (2) (due to higher expenses).
Statement of Stockholders’ Equity:
Retained Earnings: Decreases (2) (net income decrease lowers retained earnings).
Question 6
Transaction f: The company received cash as partial payment on the amount owed from clients in transaction d.
Balance Sheet:
Cash: Increases (1) (cash received from clients).
Noncash Assets: Decreases (2) (accounts receivable decreases).
Retained Earnings: No change (since this is a collection of receivables already recognized as revenue).
Statement of Cash Flows:
Operating Cash Flow: Increases (1) (cash received from clients).
Income Statement:
No impact.
Statement of Stockholders’ Equity:
No impact.
Question 6
Transaction g: The company paid cash in dividends.
Balance Sheet:
Cash: Decreases (2) (cash paid as dividends).
Retained Earnings: Decreases (2) (dividends reduce retained earnings).
Statement of Cash Flows:
Financing Cash Flow: Decreases (2) (dividends are a financing activity).
Income Statement:
No impact.
Statement of Stockholders’ Equity:
Retained Earnings: Decreases (2) (dividends reduce retained earnings).
Question 6
Final Updated Table:
Final Updated Table:
Account | a | b | c | d | e | f | g |
Balance Sheet | |||||||
Cash | 1 | 2 | 1 | 2 | 1 | 2 | |
Noncash Assets | 1 | 1 | 2 | ||||
Total Liabilities | |||||||
Contributed Capital | 1 | ||||||
Retained Earnings | 2 | 1 | 1 | 2 | 2 | ||
Other Equity | |||||||
Statement of Cash Flows | |||||||
Operating Cash Flow | 2 | 1 | 2 | 1 | |||
Investing Cash Flow | |||||||
Financing Cash Flow | 1 | 2 | |||||
Income Statement | |||||||
Revenues | 1 | 1 | |||||
Expenses | 1 | 1 | |||||
Net Income | 2 | 1 | 1 | 2 | |||
Statement of Stockholders' Equity | |||||||
Contributed Capital | 1 | ||||||
Retained Earnings | 2 | 1 | 1 | 2 | 2 |
Question 7
Reconcile Retained Earnings
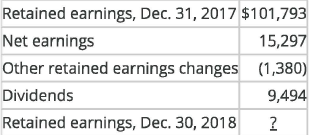
Following is financial information from Johnson &Johnson for the year ended December 30, 2018.
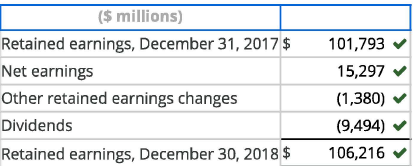
Prepare the retained earnings reconciliation for Johnson &Johnson for the year ended December 30, 2018 ($ millions).
Note: Use a negative sign with any number in the schedule to indicate a negative balance or subtraction.
Formula for Retained Earnings Reconciliation:
Retained Earnings (End of Year) =
Retained Earnings (Beginning of Year)
+Net Earnings
+Other Retained Earnings Changes
−Dividends
Given Values:
Retained Earnings (Dec 31, 2017): $101,793 million
Net Earnings: $15,297 million
Other Retained Earnings Changes: $(1,380)$ million (negative adjustment)
Dividends: $(9,494)$ million
Step-by-Step Calculation:
Retained Earnings (Beginning of Year): $101,793 million
Add Net Earnings: $15,297 million
Subtract Other Retained Earnings Changes: $(1,380)$ million
Subtract Dividends: $(9,494)$ million
Retained Earnings (End of Year) = 101,793+15,297−1,380−9,494
Retained Earnings (End of Year) = 106,216 million
Final Answer:
Retained Earnings (Dec 30, 2018): $106,216 million

Question 8
(a) Compute the following ratios for each company.
Round all answers to one decimal place (percentage answer example: 0.2345 = 23.5%).
Note: The liabilities to stockholders' equity ratio should not be converted into a percentage answer (round answers to one decimal place, for example: 0.452 = 0.5).
Target Corp.:
Gross Profit / Sales:
(Sales - Cost of Goods Sold) / Sales
(75,356 - 53,299) / 75,356 = 29.3%Net Income / Sales:
Net Income / Sales
2,937 / 75,356 = 3.9%Net Income / Stockholders' Equity:
Net Income / Stockholders' Equity
2,937 / 11,297 = 26.0%Liabilities / Stockholders' Equity:
Liabilities / Stockholders' Equity
29,993 / 11,297 = 2.7
Nike, Inc.:
Gross Profit / Sales:
(Sales - Cost of Goods Sold) / Sales
(36,397 - 20,441) / 36,397 = 43.8%Net Income / Sales:
Net Income / Sales
1,933 / 36,397 = 5.3%Net Income / Stockholders' Equity:
Net Income / Stockholders' Equity
1,933 / 9,812 = 19.7%Liabilities / Stockholders' Equity:
Liabilities / Stockholders' Equity
12,724 / 9,812 = 1.3
Harley-Davidson:
Gross Profit / Sales:
(Sales - Cost of Goods Sold) / Sales
(5,717 - 3,352) / 5,717 = 41.4%Net Income / Sales:
Net Income / Sales
531 / 5,717 = 9.3%Net Income / Stockholders' Equity:
Net Income / Stockholders' Equity
531 / 1,774 = 29.9%Liabilities / Stockholders' Equity:
Liabilities / Stockholders' Equity
8,892 / 1,774 = 5.0
Pfizer:
Gross Profit / Sales:
(Sales - Cost of Goods Sold) / Sales
(53,647 - 11,248) / 53,647 = 79.0%Net Income / Sales:
Net Income / Sales
11,188 / 53,647 = 20.9%Net Income / Stockholders' Equity:
Net Income / Stockholders' Equity
11,188 / 63,758 = 17.5%Liabilities / Stockholders' Equity:
Liabilities / Stockholders' Equity
95,664 / 63,758 = 1.5

Question 8
(b) Which of the following statements about business models best describes the differences in gross (and net) profit margin that we observe?
Answer: The higher gross profit companies are typically those that have some competitive advantage that allows them to charge a market price for their products that cannot be easily competed away.
Based on the ratios, the higher gross profit companies typically have some competitive advantage that allows them to charge a market price for their products that cannot be easily competed away.
Question 8
(c) Which company reports the highest ratio of net income to equity?
Looking at the Net Income / Stockholders' Equity ratio in the table, Harley-Davidson has the highest ratio at 29.9%.
Answer for (c): Harley-Davidson
Question 8
(d) Which company has financed itself with the highest percentage of liabilities to equity?
Looking at the Liabilities / Stockholders' Equity ratio in the table, Harley-Davidson has the highest ratio at 5.0.
Answer for (d): Harley-Davidson
Question 8
Which of the following statements best describes the reason why some companies are able to take on higher levels of debt than are others?
Companies that can sustain higher levels of debt are typically those with the most stable and positive cash flows.
Question 8
Which of the following statements best describes the differences in the ratio of net income to equity that we observe?
The highest return on equity companies are those that are able to sustain some competitive advantage that leads to higher profitability and are also able to minimize their use of equity.
Question 9
For each of the following separate situations, prepare the necessary accounting adjustments using the financial statement effects template.
Transaction (a): Unrecorded depreciation on equipment is $720.
Adjustment: Depreciation reduces the value of noncash assets and increases expenses, which decreases earned capital and net income.
Effect:
Noncash Assets: Decrease by $720.
Earned Capital: Decrease by $720.
Expenses: Increase by $720.
Net Income: Decrease by $720.
Question 9
For each of the following separate situations, prepare the necessary accounting adjustments using the financial statement effects template.
Transaction (b): The supplies account has a balance of $3,870. Supplies still available at the end of the period total $1,100.
Adjustment: The difference between the beginning balance and ending balance of supplies ($3,870 - $1,100 = $2,770) is recorded as supplies used, reducing noncash assets and increasing expenses, which decreases earned capital and net income.
Effect:
Noncash Assets: Decrease by $2,770.
Earned Capital: Decrease by $2,770.
Expenses: Increase by $2,770.
Net Income: Decrease by $2,770.
Question 9
For each of the following separate situations, prepare the necessary accounting adjustments using the financial statement effects template.
Transaction (c): An estimated utilities expense of $430 has been incurred but not yet paid.
Adjustment: This is an accrued expense, increasing liabilities and expenses, which decreases earned capital and net income.
Effect:
Liabilities: Increase by $430.
Earned Capital: Decrease by $430.
Expenses: Increase by $430.
Net Income: Decrease by $430.
Question 9
For each of the following separate situations, prepare the necessary accounting adjustments using the financial statement effects template.
Transaction (d): Rent for four periods was paid and recorded as a $3,200 increase to prepaid rent and a $3,200 decrease to cash. However, only $800 of this prepaid rent is expensed at the end of the period.
Adjustment: The portion of prepaid rent expensed ($800) reduces noncash assets and increases expenses, which decreases earned capital and net income.
Effect:
Noncash Assets: Decrease by $800.
Earned Capital: Decrease by $800.
Expenses: Increase by $800.
Net Income: Decrease by $800.
Question 9
For each of the following separate situations, prepare the necessary accounting adjustments using the financial statement effects template.
Transaction (e): Nine months ago, a one-year service policy was sold for $1,872, which was recorded as unearned revenue. Now, 9/12 of that revenue needs to be recognized.
Adjustment: The recognition of earned revenue decreases liabilities (unearned revenue) and increases revenue, which increases earned capital and net income.
Effect:
Liabilities: Decrease by $1,404.
Earned Capital: Increase by $1,404.
Revenue: Increase by $1,404.
Net Income: Increase by $1,404.
Question 9
For each of the following separate situations, prepare the necessary accounting adjustments using the financial statement effects template.
Transaction (f): Employee wages of $965 have been incurred but not yet paid.
Adjustment: This is an accrued expense, increasing liabilities and expenses, which decreases earned capital and net income.
Effect:
Liabilities: Increase by $965.
Earned Capital: Decrease by $965.
Expenses: Increase by $965.
Net Income: Decrease by $965.
Question 9
For each of the following separate situations, prepare the necessary accounting adjustments using the financial statement effects template.
Transaction (g): $300 of interest has been earned but not yet received or recorded.
Adjustment: This is accrued revenue, increasing noncash assets and revenue, which increases earned capital and net income.
Effect:
Noncash Assets: Increase by $300.
Earned Capital: Increase by $300.
Revenue: Increase by $300.
Net Income: Increase by $300.
Question 9
Summary of Effects:
Summary of Effects:
Transaction | Cash Asset | Noncash Assets | Liabilities | Contributed Capital | Earned Capital | Revenue | Expenses | Net Income |
(a) | 0 | (720) | 0 | 0 | (720) | 0 | 720 | (720) |
(b) | 0 | (2,770) | 0 | 0 | (2,770) | 0 | 2,770 | (2,770) |
(c) | 0 | 0 | 430 | 0 | (430) | 0 | 430 | (430) |
(d) | 0 | (800) | 0 | 0 | (800) | 0 | 800 | (800) |
(e) | 0 | 0 | (1,404) | 0 | 1,404 | 1,404 | 0 | 1,404 |
(f) | 0 | 0 | 965 | 0 | (965) | 0 | 965 | (965) |
(g) | 0 |
Question 10
Prepare journal entries for each accounting adjustment.
(a) Unrecorded depreciation on equipment is $720.
Journal Entry:
Debit: Depreciation Expense $720
Credit: Accumulated Depreciation $720
(To record depreciation for the period)
Question 10
Prepare journal entries for each accounting adjustment.
(b) The supplies account has a balance of $3,870. Supplies still available at the end of the period total $1,100.
Journal Entry:
Debit: Supplies Expense $2,770
Credit: Supplies $2,770
(To record supplies expense for the period)
(The difference between $3,870 and $1,100 is recorded as expense)
Question 10
Prepare journal entries for each accounting adjustment.
(c) An estimated utilities expense of $430 has been incurred, but no utility bill has yet been received or paid.
Journal Entry:
Debit: Utilities Expense $430
Credit: Utilities Payable $430
(To record accrued utilities expense)
Question 10
Prepare journal entries for each accounting adjustment.
(d) Rent for four periods was paid and recorded as a $3,200 increase to prepaid rent and a $3,200 decrease to cash.
Journal Entry:
Debit: Rent Expense $800
Credit: Prepaid Rent $800
(To record rent expense for the month)
(Since one month's worth of rent has been used, $800 is expensed: $3,200 / 4 periods)
Question 10
Prepare journal entries for each accounting adjustment.
(e) Nine months ago, a one-year service policy was sold, and unearned revenue of $1,872 was recorded.
Journal Entry:
Debit: Unearned Revenue $1,404
Credit: Revenue $1,404
(To record premium revenue earned)
(9 months of the service have passed, so 9/12 of the unearned revenue is now recognized as earned: $1,872 * 9/12 = $1,404)
Question 10
Prepare journal entries for each accounting adjustment.
(f) Employee wages of $965 have been incurred but not yet paid.
Journal Entry:
Debit: Wages Expense $965
Credit: Wages Payable $965
(To accrue wages at the end of the period)
Question 10
Prepare journal entries for each accounting adjustment.
(g) $300 of interest has been earned but not yet received or recorded.
Journal Entry:
Debit: Interest Receivable $300
Credit: Interest Revenue $300
(To accrue interest earned but not yet received)
Question 10
Completed Table:
Completed Table:
Account | Debit | Credit |
(a) Depreciation Expense | $720 | |
(a) Accumulated Depreciation | $720 | |
(b) Supplies Expense | $2,770 | |
(b) Supplies | $2,770 | |
(c) Utilities Expense | $430 | |
(c) Utilities Payable | $430 | |
(d) Rent Expense | $800 | |
(d) Prepaid Rent | $800 | |
(e) Unearned Revenue | $1,404 | |
(e) Revenue | $1,404 | |
(f) Wages Expense | $965 | |
(f) Wages Payable | $965 | |
(g) Interest Receivable | $300 | |
(g) Interest Revenue | $300 |
Question 11
Prepare a journal entry for each transaction.
June 1 – K. Daniels invested $12,000 into the business in exchange for common stock.
Effect: Cash increases by $12,000, and common stock (equity) increases by $12,000.
Journal Entry:
Debit: Cash $12,000
Credit: Common Stock $12,000
Question 11
Prepare a journal entry for each transaction.
June 2 – Paid $950 for rent.
Effect: Cash decreases by $950, and rent expense increases by $950.
Journal Entry:
Debit: Rent Expense $950
Credit: Cash $950
Question 11
Prepare a journal entry for each transaction.
June 3 – Purchased $6,400 of office equipment on credit.
Effect: Office equipment (an asset) increases by $6,400, and accounts payable (a liability) increases by $6,400.
Journal Entry:
Debit: Office Equipment $6,400
Credit: Accounts Payable $6,400
Question 11
Prepare a journal entry for each transaction.
June 6 – Purchased $3,800 of supplies; paid $1,800 cash and $2,000 on account.
Effect: Supplies (asset) increases by $3,800, cash decreases by $1,800, and accounts payable increases by $2,000.
Journal Entry:
Debit: Supplies $3,800
Credit: Cash $1,800
Credit: Accounts Payable $2,000
Question 11
Prepare a journal entry for each transaction.
June 11 – Billed clients $4,700 for services.
Effect: Accounts receivable increases by $4,700, and service fees earned (revenue) increases by $4,700.
Journal Entry:
Debit: Accounts Receivable $4,700
Credit: Service Fees Earned $4,700
Question 11
Prepare a journal entry for each transaction.
June 17 – Collected $3,250 from clients for services previously billed.
Effect: Cash increases by $3,250, and accounts receivable decreases by $3,250.
Journal Entry:
Debit: Cash $3,250
Credit: Accounts Receivable $3,250
Question 11
Prepare a journal entry for each transaction.
June 19 – Paid $5,000 toward office equipment purchased on June 3.
Effect: Cash decreases by $5,000, and accounts payable decreases by $5,000.
Journal Entry:
Debit: Accounts Payable $5,000
Credit: Cash $5,000
Question 11
Prepare a journal entry for each transaction.
June 25 – Paid $900 in dividends.
Effect: Cash decreases by $900, and dividends increase by $900 (decreasing retained earnings).
Journal Entry:
Debit: Dividends $900
Credit: Cash $900
Question 11
Prepare a journal entry for each transaction.
June 30 – Paid $350 for utilities.
Effect: Cash decreases by $350, and utilities expense increases by $350.
Journal Entry:
Debit: Utilities Expense $350
Credit: Cash $350
Question 11
Prepare a journal entry for each transaction.
June 30 – Paid $2,500 for wages.
Effect: Cash decreases by $2,500, and wages expense increases by $2,500.
Journal Entry:
Debit: Wages Expense $2,500
Credit: Cash $2,500
Question 11
Journal Entries Table:
Journal Entries Table:
Date | Description | Debit | Credit |
June 1 | Cash | $12,000 | |
Common Stock | $12,000 | ||
June 2 | Rent Expense | $950 | |
Cash | $950 | ||
June 3 | Office Equipment | $6,400 | |
Accounts Payable | $6,400 | ||
June 6 | Supplies | $3,800 | |
Cash | $1,800 | ||
Accounts Payable | $2,000 | ||
June 11 | Accounts Receivable | $4,700 | |
Service Fees Earned | $4,700 | ||
June 17 | Cash | $3,250 | |
Accounts Receivable | $3,250 | ||
June 19 | Accounts Payable | $5,000 | |
Cash | $5,000 | ||
June 25 | Dividends | $900 | |
Cash | $900 | ||
June 30 | Utilities Expense | $350 | |
Cash | $350 | ||
June 30 | Wages Expense | $2,500 | |
Cash | $2,500 |
Question 11
Cash T-account:
Cash T-account:
Debit | Credit |
$12,000 | |
$3,250 | $950 |
$1,800 | |
$5,000 | |
$900 | |
$350 | |
$2,500 |
Question 11
Supplies T-account:
Supplies T-account:
Debit | Credit |
$3,800 |
Question 11
Office Equipment T-account:
Office Equipment T-account:
Debit | Credit |
$6,400 |
Question 11
Accounts Receivable T-account:
Accounts Receivable T-account:
Debit | Credit |
$4,700 | $3,250 |
Question 11
Accounts Payable T-account:
Accounts Payable T-account:
Debit | Credit |
$5,000 | $6,400 |
$2,000 |
Question 11
Common Stock T-account:
Common Stock T-account:
Debit | Credit |
$12,000 |
Question 11
Dividends T-account:
Dividends T-account:
Debit | Credit |
$900 |
Question 11
Rent Expense T-account:
Rent Expense T-account:
Debit | Credit |
$950 |
Question 11
Utilities Expense T-account:
Utilities Expense T-account:
Debit | Credit |
$350 |
Question 11
Wages Expense T-account:
Wages Expense T-account:
Debit | Credit |
$2,500 |
Question 11
Service Fees Earned T-account:
Service Fees Earned T-account:
Debit | Credit |
$4,700 |
Question 12
Compute Liquidity and Solvency Ratios for Competing Firms
Halliburton and Schlumberger compete in the oil field services sector. Refer to the following 2018 financial data for the two companies to answer the requirements.
a. Compute the following measures for both companies.
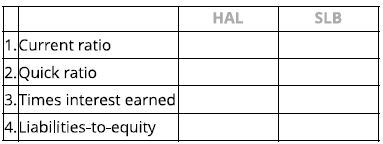
Current Ratio
Quick Ratio
Times Interest Earned
Liabilities-to-Equity
$ millions | HAL | SLB |
Cash and equivalents | 2,008 | 1,433 |
Short-term investments | - | 1,344 |
Accounts receivable | 5,234 | 7,881 |
Current assets | 11,151 | 15,731 |
Current liabilities | 4,802 | 13,486 |
Total liabilities | 16,438 | 33,921 |
Total equity | 9,544 | 36,586 |
Earnings before interest and tax | 2,467 | 3,050 |
Interest expense, gross | 554 | 537 |
b. Which company appears more liquid?
c. Which company appears more solvent?
1. Current Ratio Formula:
Current Ratio = Current Assets / Current Liabilities
HAL Calculation:
Current Ratio (HAL) = 11,151 / 4,802 = 2.32
SLB Calculation:
Current Ratio (SLB) = 15,731 / 13,486 = 1.17
2. Quick Ratio Formula:
Quick Ratio = (Cash and Equivalents + Short-term Investments + Accounts Receivable) / Current Liabilities
HAL Calculation:
Quick Ratio (HAL) = (2,008 + 5,234) / 4,802 = 7,242 / 4,802 = 1.51
SLB Calculation:
Quick Ratio (SLB) = (1,433 + 1,344 + 7,881) / 13,486 = 10,658 / 13,486 = 0.79
3. Times Interest Earned Formula:
Times Interest Earned = Earnings Before Interest and Taxes (EBIT) / Interest Expense
HAL Calculation:
Times Interest Earned (HAL) = 2,467 / 554 = 4.45
SLB Calculation:
Times Interest Earned (SLB) = 3,050 / 537 = 5.68
b. Which company appears more liquid?
Halliburton (HAL) appears more liquid because it has a higher current ratio (2.32) and quick ratio (1.51) compared to Schlumberger (SLB).
c. Which company appears more solvent?
Schlumberger (SLB) appears more solvent because it has a lower liabilities-to-equity ratio (0.93) compared to Halliburton (HAL).

Question 13
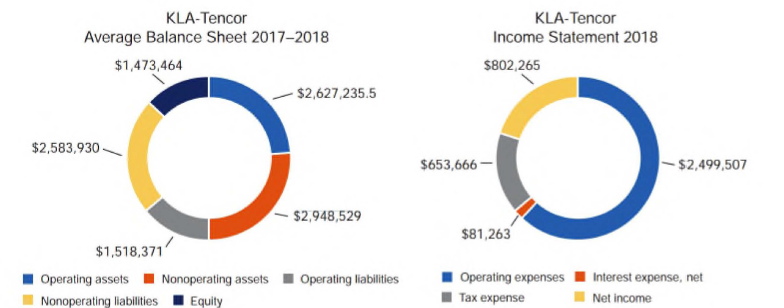
Compute and Compare ROE, ROA, and RNOA Graphical representations of the KLA-Tencor 2018 income statement and average balance sheet numbers (2017-2018) follow ($ thousands).
a. Compute return on equity (ROE)
b. Compute return on assets (ROA)
c. Compute return on net operating assets (RNOA)
Note: Round all answers to two decimal places (ex: 0.12345 = 12.35%)
Note: Assume a statutory tax rate of 22%.
a. Return on Equity (ROE) Formula: ROE = (Net Income / Average Equity) × 100
ROE Calculation: ROE = (802,265 / 1,473,464) × 100 = 54.45%
b. Return on Assets (ROA) Formula: ROA = (Net Income / Average Total Assets) × 100
ROA Calculation: ROA = (802,265 / 5,573,364) × 100 = 14.39%
c. Return on Net Operating Assets (RNOA) Formula: RNOA = (Net Operating Profit After Taxes (NOPAT) / Net Operating Assets (NOA)) × 100
NOPAT Calculation: NOPAT = 2,499,507 × (1 - 0.22) = 1,949,615.46
NOA Calculation: NOA = 2,583,930 + 1,473,464 - 1,518,371 = 2,539,023
RNOA Calculation: RNOA = (1,949,615.46 / 2,539,023) × 100 = 78.07%
Question 14
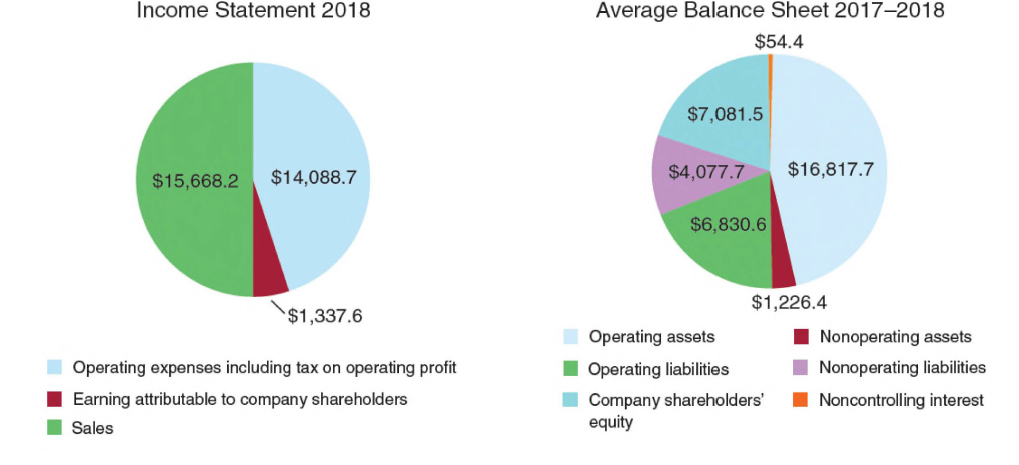
Graphical representations of the Ingersoll Rand 2018 income statement and average balance sheets (2017-2018) follow.
a. Compute the 2018 return on equity (ROE) and 2018 return on net operating assets (RNOA).
Note: Round percentages to two decimal places (for example, enter 6.66% for 6.6555%).
b. Disaggregate RNOA into net operating profit margin (NOPM) and net operating asset turnover (NOAT).
Note: For NOPM and RNOA, round percentages to two decimal places (for example, enter 6.66% for 6.6555%).
Note: For NOAT, round amount to three decimal places (for example, enter 6.776 for 6.77555).
c. Compute nonoperating return for 2018.
Note: Round percentages to two decimal places (for example, enter 6.66% for 6.6555%).
1. Return on Equity (ROE) Formula:
ROE = (Net Income / Average Shareholders' Equity) × 100
ROE Calculation: ROE = (1,337.6 / 7,081.5) × 100 = 18.89%
2. Return on Net Operating Assets (RNOA) Formula:
RNOA = (Net Operating Profit After Taxes (NOPAT) / Net Operating Assets (NOA)) × 100
RNOA Calculation: RNOA = (1,579.5 / 9,977.1) × 100 = 15.82%
3. Disaggregation of RNOA:
RNOA = NOPM × NOAT
a. Net Operating Profit Margin (NOPM) Formula:
NOPM = (NOPAT / Sales) × 100
NOPM Calculation: NOPM = (1,579.5 / 15,668.2) × 100 = 10.08%
b. Net Operating Asset Turnover (NOAT) Formula:
NOAT = Sales / Net Operating Assets
NOAT Calculation: NOAT = 15,668.2 / 9,977.1 = 1.569
4. Nonoperating Return Formula:
Nonoperating Return = ROE - RNOA
Nonoperating Return Calculation: Nonoperating Return = 18.89% - 15.82% = 3.07%
Summary:
ROE: 18.89%
RNOA: 15.82%
NOPM: 10.08%
NOAT: 1.569
Nonoperating Return: 3.07%
Question 15
Analysis and Interpretation of Profitability
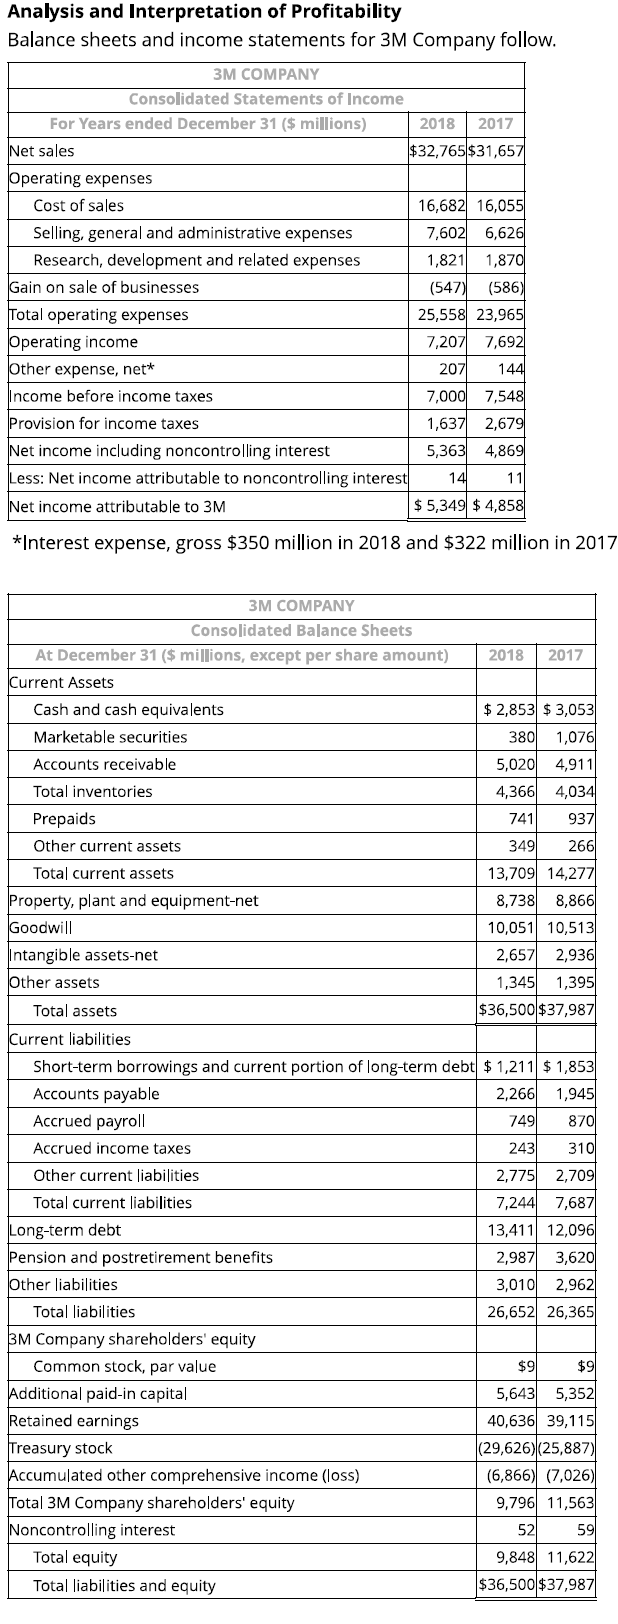
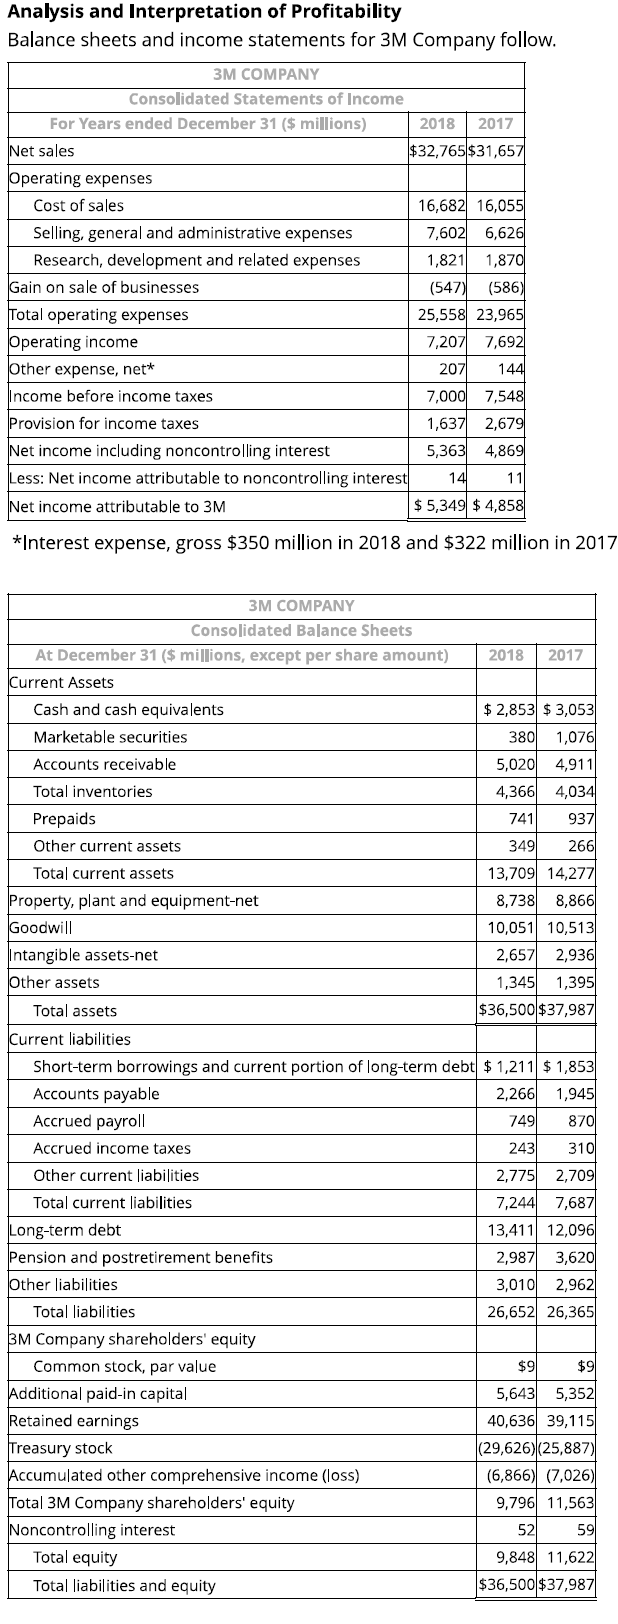
Balance sheets and income statements for 3M Company follow.
(a) Compute net operating profit after tax (NOPAT) for 2018. Assume that the combined federal and state statutory tax rate is 22%. (Round your answer to the nearest whole number.)
(a) Compute Net Operating Profit After Tax (NOPAT) for 2018:
1. 2018 NOPAT (Net Operating Profit After Tax)
Formula:
NOPAT = Operating Income × (1 - Tax Rate)
Given Data:
Operating Income (2018) = $7,207 million
Tax Rate = 22% (0.22)
Calculation:
NOPAT = 7,207 × (1 - 0.22)
NOPAT = 7,207 × 0.78
NOPAT = 5,525 million
Question 15
Analysis and Interpretation of Profitability
Balance sheets and income statements for 3M Company follow.
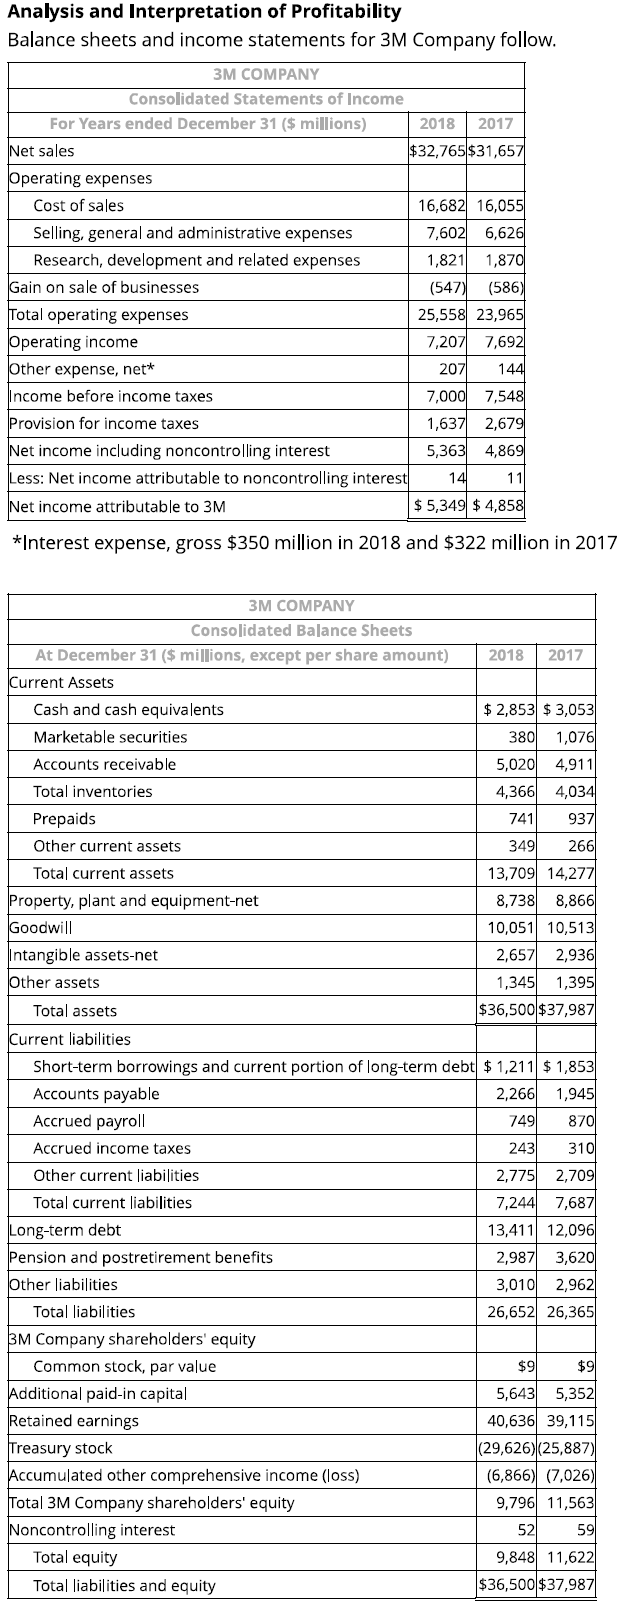
(b) Compute net operating assets (NOA) for 2018 and 2017.
(b) Compute Net Operating Assets (NOA) for 2018 and 2017:
NOA Formula: NOA = Operating Assets - Operating Liabilities
2018 NOA Calculation: NOA (2018) = 21,237 million
2017 NOA Calculation: NOA (2017) = 21,442 million
Question 15
Analysis and Interpretation of Profitability
Balance sheets and income statements for 3M Company follow.
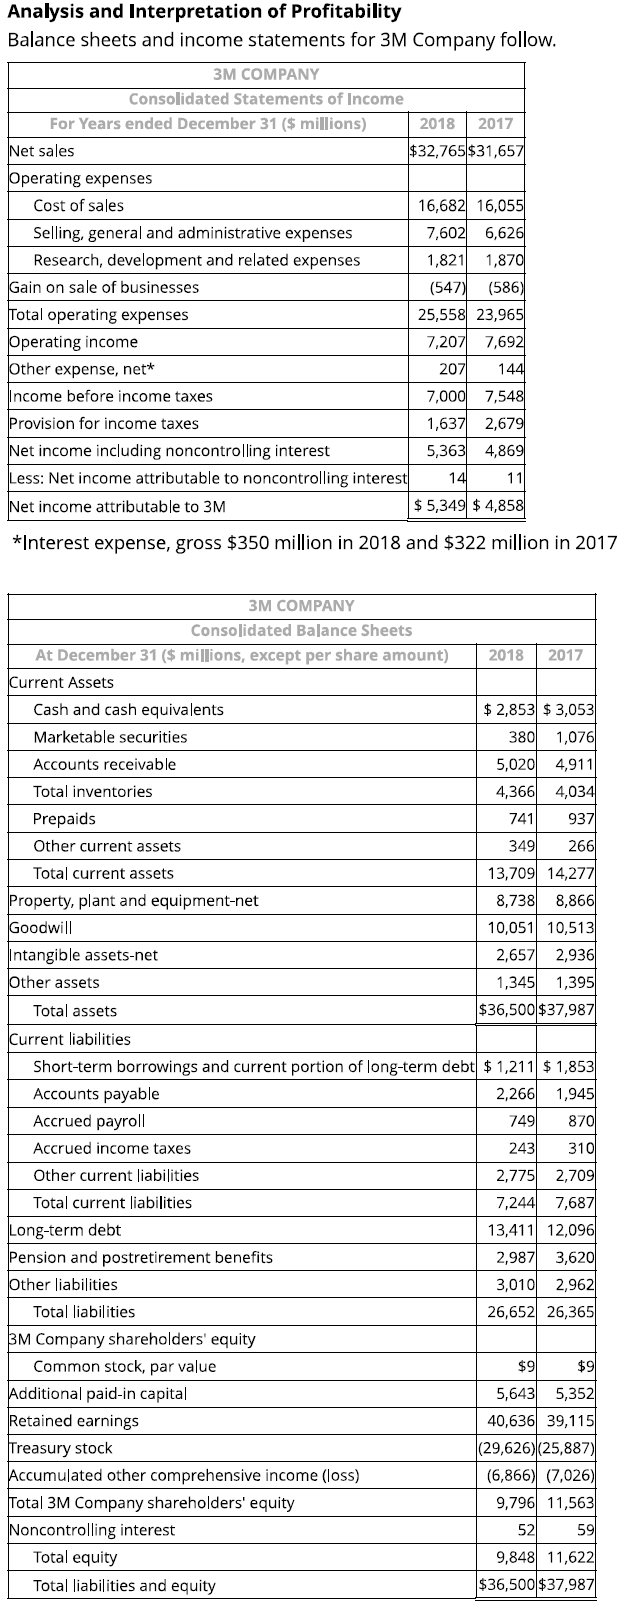
(c) Compute and disaggregate 3M's RNOA into net operating profit margin (NOPM) and net operating asset turnover (NOAT) for 2018. Demonstrate that RNOA = NOPM x NOAT. (Round your answers to two decimal places. Do not round until your final answer. Do not use NOPM x NOAT to calculate RNOA.)
(c) Compute and Disaggregate RNOA into NOPM and NOAT:
RNOA Formula: RNOA = (NOPAT / NOA) × 100
2018 RNOA Calculation: RNOA = (5,525 / 21,237) × 100 = 25.89%
NOPM Formula: NOPM = (NOPAT / Sales) × 100
2018 NOPM Calculation: NOPM = (5,525 / 32,765) × 100 = 16.86%
NOAT Formula: NOAT = Sales / NOA
2018 NOAT Calculation: NOAT = 32,765 / 21,237 = 1.54
Question 15
Analysis and Interpretation of Profitability
Balance sheets and income statements for 3M Company follow.
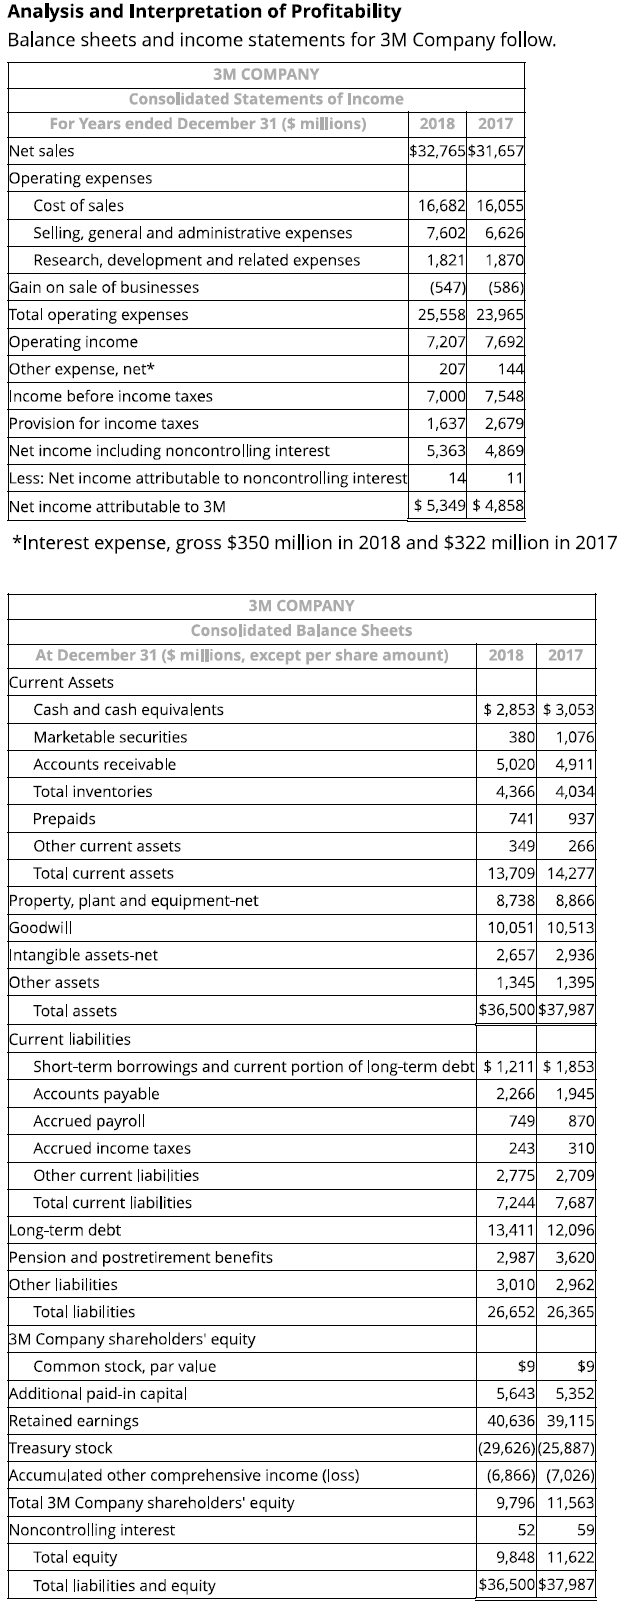
(d) Compute net nonoperating obligations (NNO) for 2018 and 2017. Confirm the relation: NOA= NNO + Total equity
(d) Compute Net Nonoperating Obligations (NNO) for 2018 and 2017:
NNO Formula: NNO = Total Liabilities - Operating Liabilities
2018 NNO Calculation: NNO = 11,389 million
2017 NNO Calculation: NNO = 9,820 million
Question 15
Analysis and Interpretation of Profitability
Balance sheets and income statements for 3M Company follow.
(e) Compute return on equity (ROE) for 2018. (Round your answers to two decimal places. Do not round until your final answer.)
(e) Compute Return on Equity (ROE) for 2018:
ROE Formula: ROE = (Net Income / Average Shareholders' Equity) × 100
2018 ROE Calculation: ROE = (5,349 / 10,683) × 100 = 50.09%
Question 15
Analysis and Interpretation of Profitability
Balance sheets and income statements for 3M Company follow.
(f) What is the nonoperating return component of ROE for 2018?(Round your answers to two decimal places.)
(f) Compute Nonoperating Return Component of ROE for 2018:
Nonoperating Return Formula: Nonoperating Return = ROE - RNOA
2018 Nonoperating Return Calculation: Nonoperating Return = 50.09% - 25.89% = 24.20%
Question 15
Analysis and Interpretation of Profitability
Balance sheets and income statements for 3M Company follow.
(g) Comment on the difference between ROE and RNOA. What inference can we draw from this comparison?
(g) Comment on the Difference Between ROE and RNOA:
The correct answer is: ROE > RNOA implies that 3M is able to borrow money to fund operating assets that yield a return greater than its cost of debt.
Question 16
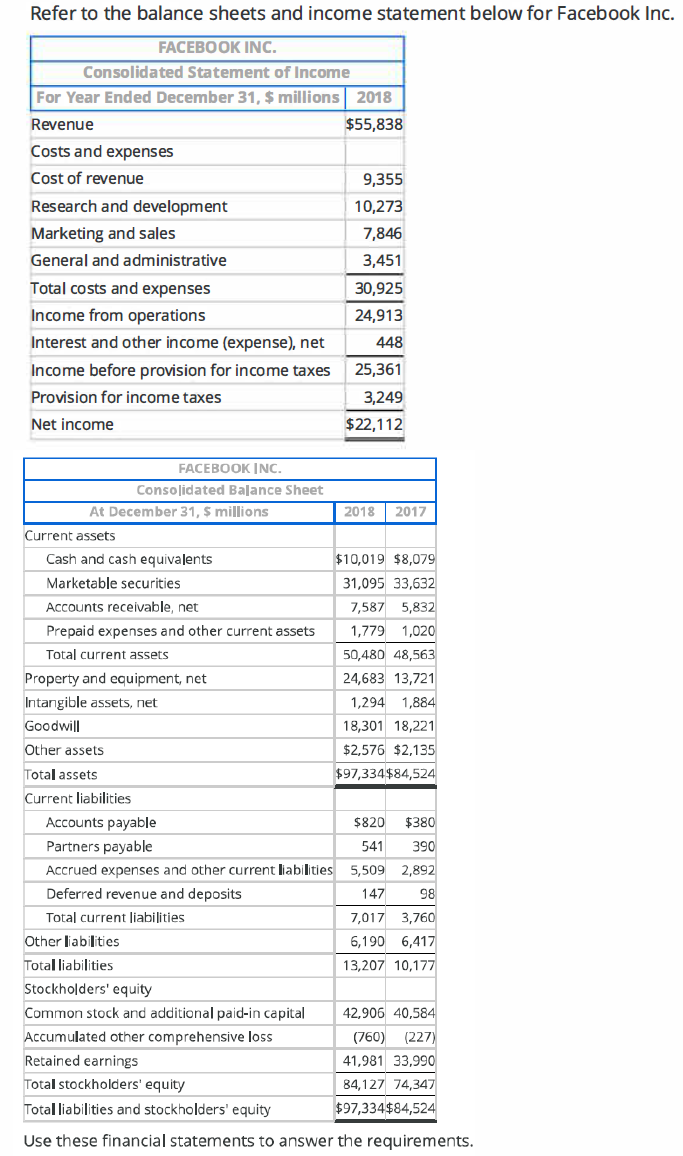
a. Compute net operating profit after tax (NOPAT) for 2018. Assume that the combined federal and state statutory tax rate is 22%.
a. Compute net operating profit after tax (NOPAT) for 2018
Formula:
NOPAT = Operating Income × (1 - Tax Rate)
Given:
Operating Income: $27,851 million (from income statement)
Tax Rate: 22% (0.22)
Calculation:
NOPAT = $27,851 × (1 - 0.22)
NOPAT = $27,851 × 0.78
NOPAT = $21,763 million
Question 16
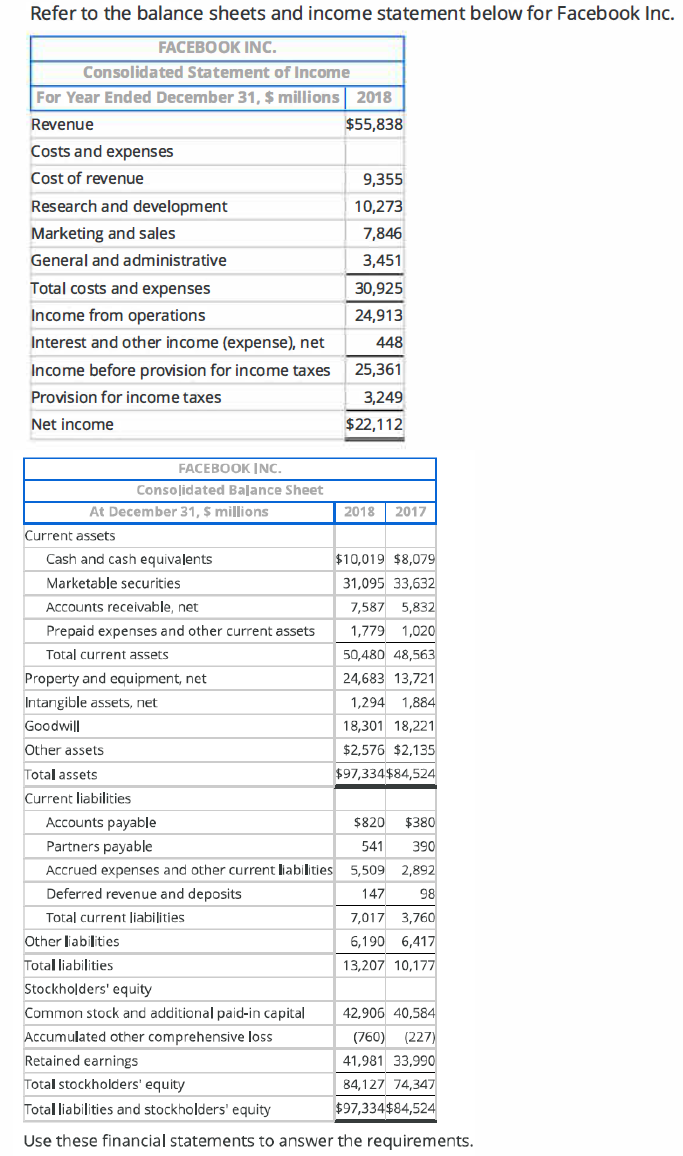
b. Compute net operating assets (NOA) for 2018 and 2017.
NOA 2018:
2018 Calculation:
Operating Assets:
Accounts receivable = 7,587
Prepaid expenses and other current assets = 1,779
Property and equipment, net = 24,683
Intangible assets, net = 1,294
Goodwill = 18,301
Other assets = 2,576
Total Operating Assets = 7,587 + 1,779 + 24,683 + 1,294 + 18,301 + 2,576 = 56,220 million
Operating Liabilities:
Accounts payable = 820
Accrued expenses and other current liabilities = 5,509
Deferred revenue and deposits = 147
Other liabilities = 6,190
Total Operating Liabilities = 820 + 5,509 + 147 + 6,190 = 12,666 million
NOA for 2018
56,220 − 12,666 = 43,554 million
2017 Calculation:
Operating Assets:
Accounts receivable = 5,832
Prepaid expenses and other current assets = 1,020
Property and equipment, net = 13,721
Intangible assets, net = 1,884
Goodwill = 18,221
Other assets = 2,135
Total Operating Assets = 5,832 + 1,020 + 13,721 + 1,884 + 18,221 + 2,135 = 42,813 million
Operating Liabilities:
Accounts payable = 380
Accrued expenses and other current liabilities = 2,892
Deferred revenue and deposits = 98
Other liabilities = 6,417
Total Operating Liabilities = 380 + 2,892 + 98 + 6,417 = 9,787 million
NOA for 2017
42,813 − 9,787 = 33,026 million
Question 16
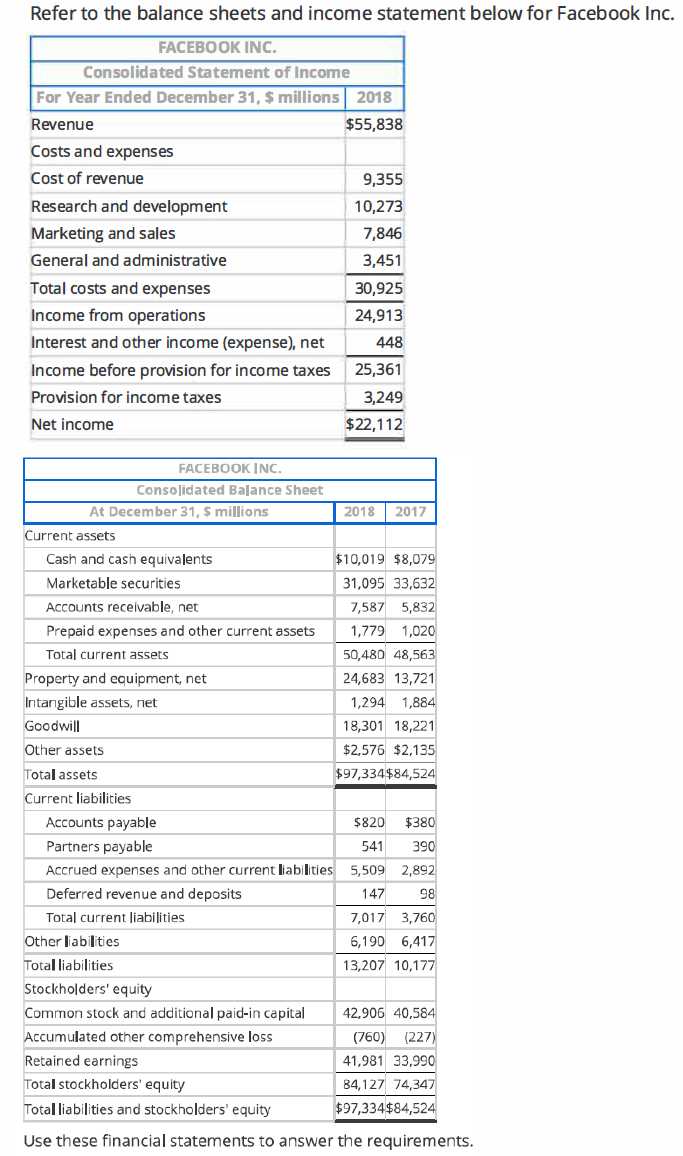
c. Compute RNOA and disaggregate it into net operating profit margin (NOPM) and net operating asset turnover (NOAT) for 2018.
Note: Do not round until your final answer.
Note: For NOPM and RNOA, round final percentages to two decimal places (for example, enter 6.66% for 6.6555%).
Note: For NOAT, round final amount to four decimal places (for example, enter 6.7756 for 6.775555).
c. Compute RNOA and disaggregate it into NOPM and NOAT for 2018
Formula 1:
RNOA = NOPM × NOAT
Formula 2:
NOPM = (NOPAT / Revenue) × 100
Formula 3:
NOAT = Revenue / NOA
RNOA Calculation
First, compute NOPM and NOAT.
Given Data:
NOPAT = $21,763 million
Revenue = $55,838 million
NOA = $43,013 million
NOPM Calculation:
NOPM = (NOPAT / Revenue) × 100
NOPM = ($21,763 / $55,838) × 100
NOPM = 38.98%
NOAT Calculation:
NOAT = Revenue / NOA
NOAT = $55,838 / $43,013
NOAT = 1.4762
RNOA Calculation:
RNOA = NOPM × NOAT
RNOA = 38.98% × 1.4762
RNOA = 57.54%
Question 16
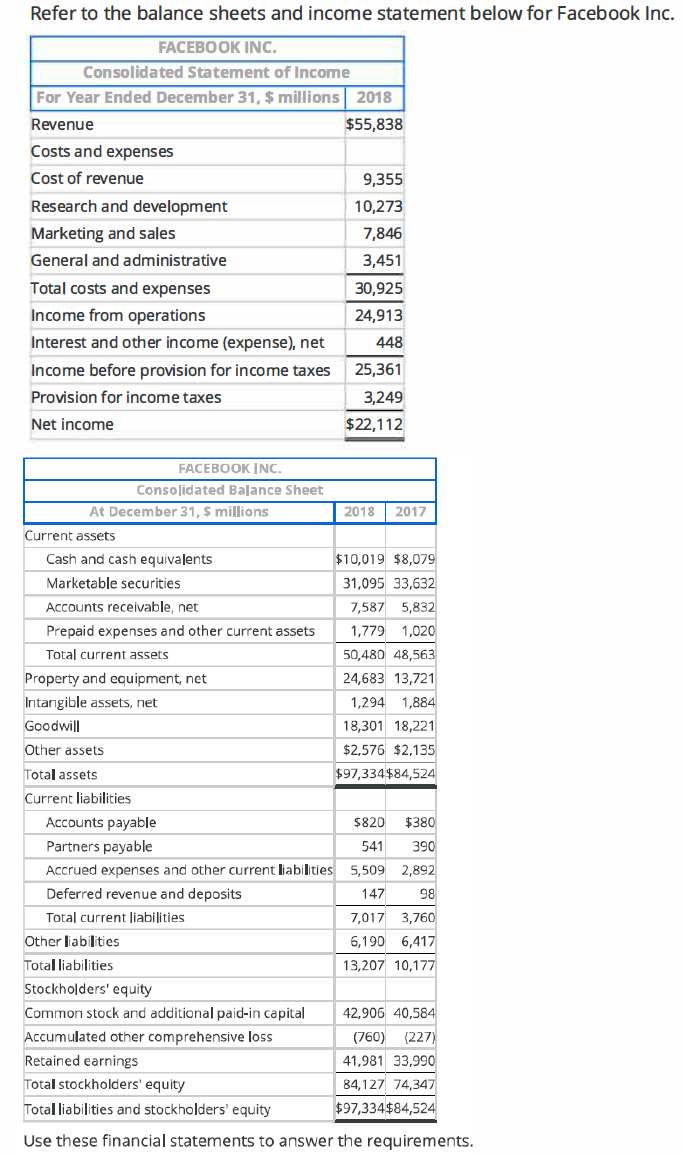
d. Compute return on equity (ROE) for 2018.
Note: Do not round until your final answer.
Note: Round final answer percentage to two decimal places (for example, enter 6.66% for 6.6555%).
d. Compute return on equity (ROE) for 2018
Formula:
ROE = (Net Income / Shareholders’ Equity) × 100
Given Data:
Net Income (2018) = $22,112 million
Shareholders' Equity (2018) = $84,127 million
Calculation:
ROE = ($22,112 / $84,127) × 100
Statements: Visual Representation with Specific Dates
[ Income Statement ] (Jan 1 - Aug 3, 2018)
         |
         V
   Net Income ($20,000)
         |
         V
[ Statement of Retained Earnings ] (Jan 1 - Aug 3, 2018)
   Beginning Retained Earnings (Jan 1, 2018): $70,000
         |
         V
Ending Retained Earnings (Aug 3, 2018): $85,000
         |
         V
[ Balance Sheet ] (Aug 3, 2018)
   - Retained Earnings: $85,000
   - Cash: $32,000 (from Cash Flow Statement)
         ^
         |
[ Cash Flow Statement ] (Jan 1 - Aug 3, 2018)
   - Starts with Net Income ($20,000)
   - Ends with Cash Balance ($32,000)
![<pre><code>[ Income Statement ] (Jan 1 - Aug 3, 2018)
|
V
Net Income ($20,000)
|
V
[ Statement of Retained Earnings ] (Jan 1 - Aug 3, 2018)
Beginning Retained Earnings (Jan 1, 2018): $70,000
|
V
Ending Retained Earnings (Aug 3, 2018): $85,000
|
V
[ Balance Sheet ] (Aug 3, 2018)
- Retained Earnings: $85,000
- Cash: $32,000 (from Cash Flow Statement)
^
|
[ Cash Flow Statement ] (Jan 1 - Aug 3, 2018)
- Starts with Net Income ($20,000)
- Ends with Cash Balance ($32,000)
</code></pre><p></p>](https://knowt-user-attachments.s3.amazonaws.com/9419640c-bcc2-4cc5-93f7-21ffb420dd38.png)