AP Human Geo unit 1
1/27
There's no tags or description
Looks like no tags are added yet.
Name | Mastery | Learn | Test | Matching | Spaced | Call with Kai |
|---|
No analytics yet
Send a link to your students to track their progress
28 Terms
Geography
Spatial science (study of relationships on earth’s surface)
Geo
earth
Graphia
writing
historians
look at how world changes over time
geographers
look at how woel changes over space
what are geography’s 3 critical questions?
where is it happening?
why there? (and not somewhere else)
Impact? (on that place , surrounding areas, the world etc)
How do maps cause distortion?
-Shape
-Distance
-relative size (area) appears larger or smaller than it is
-direction
Cartography
science of mapmaking
what two purposes do maps serve as?
a reference tool to identify an object’s absolute and relative location
a communication tool to convey the distribution of human activities or physical features
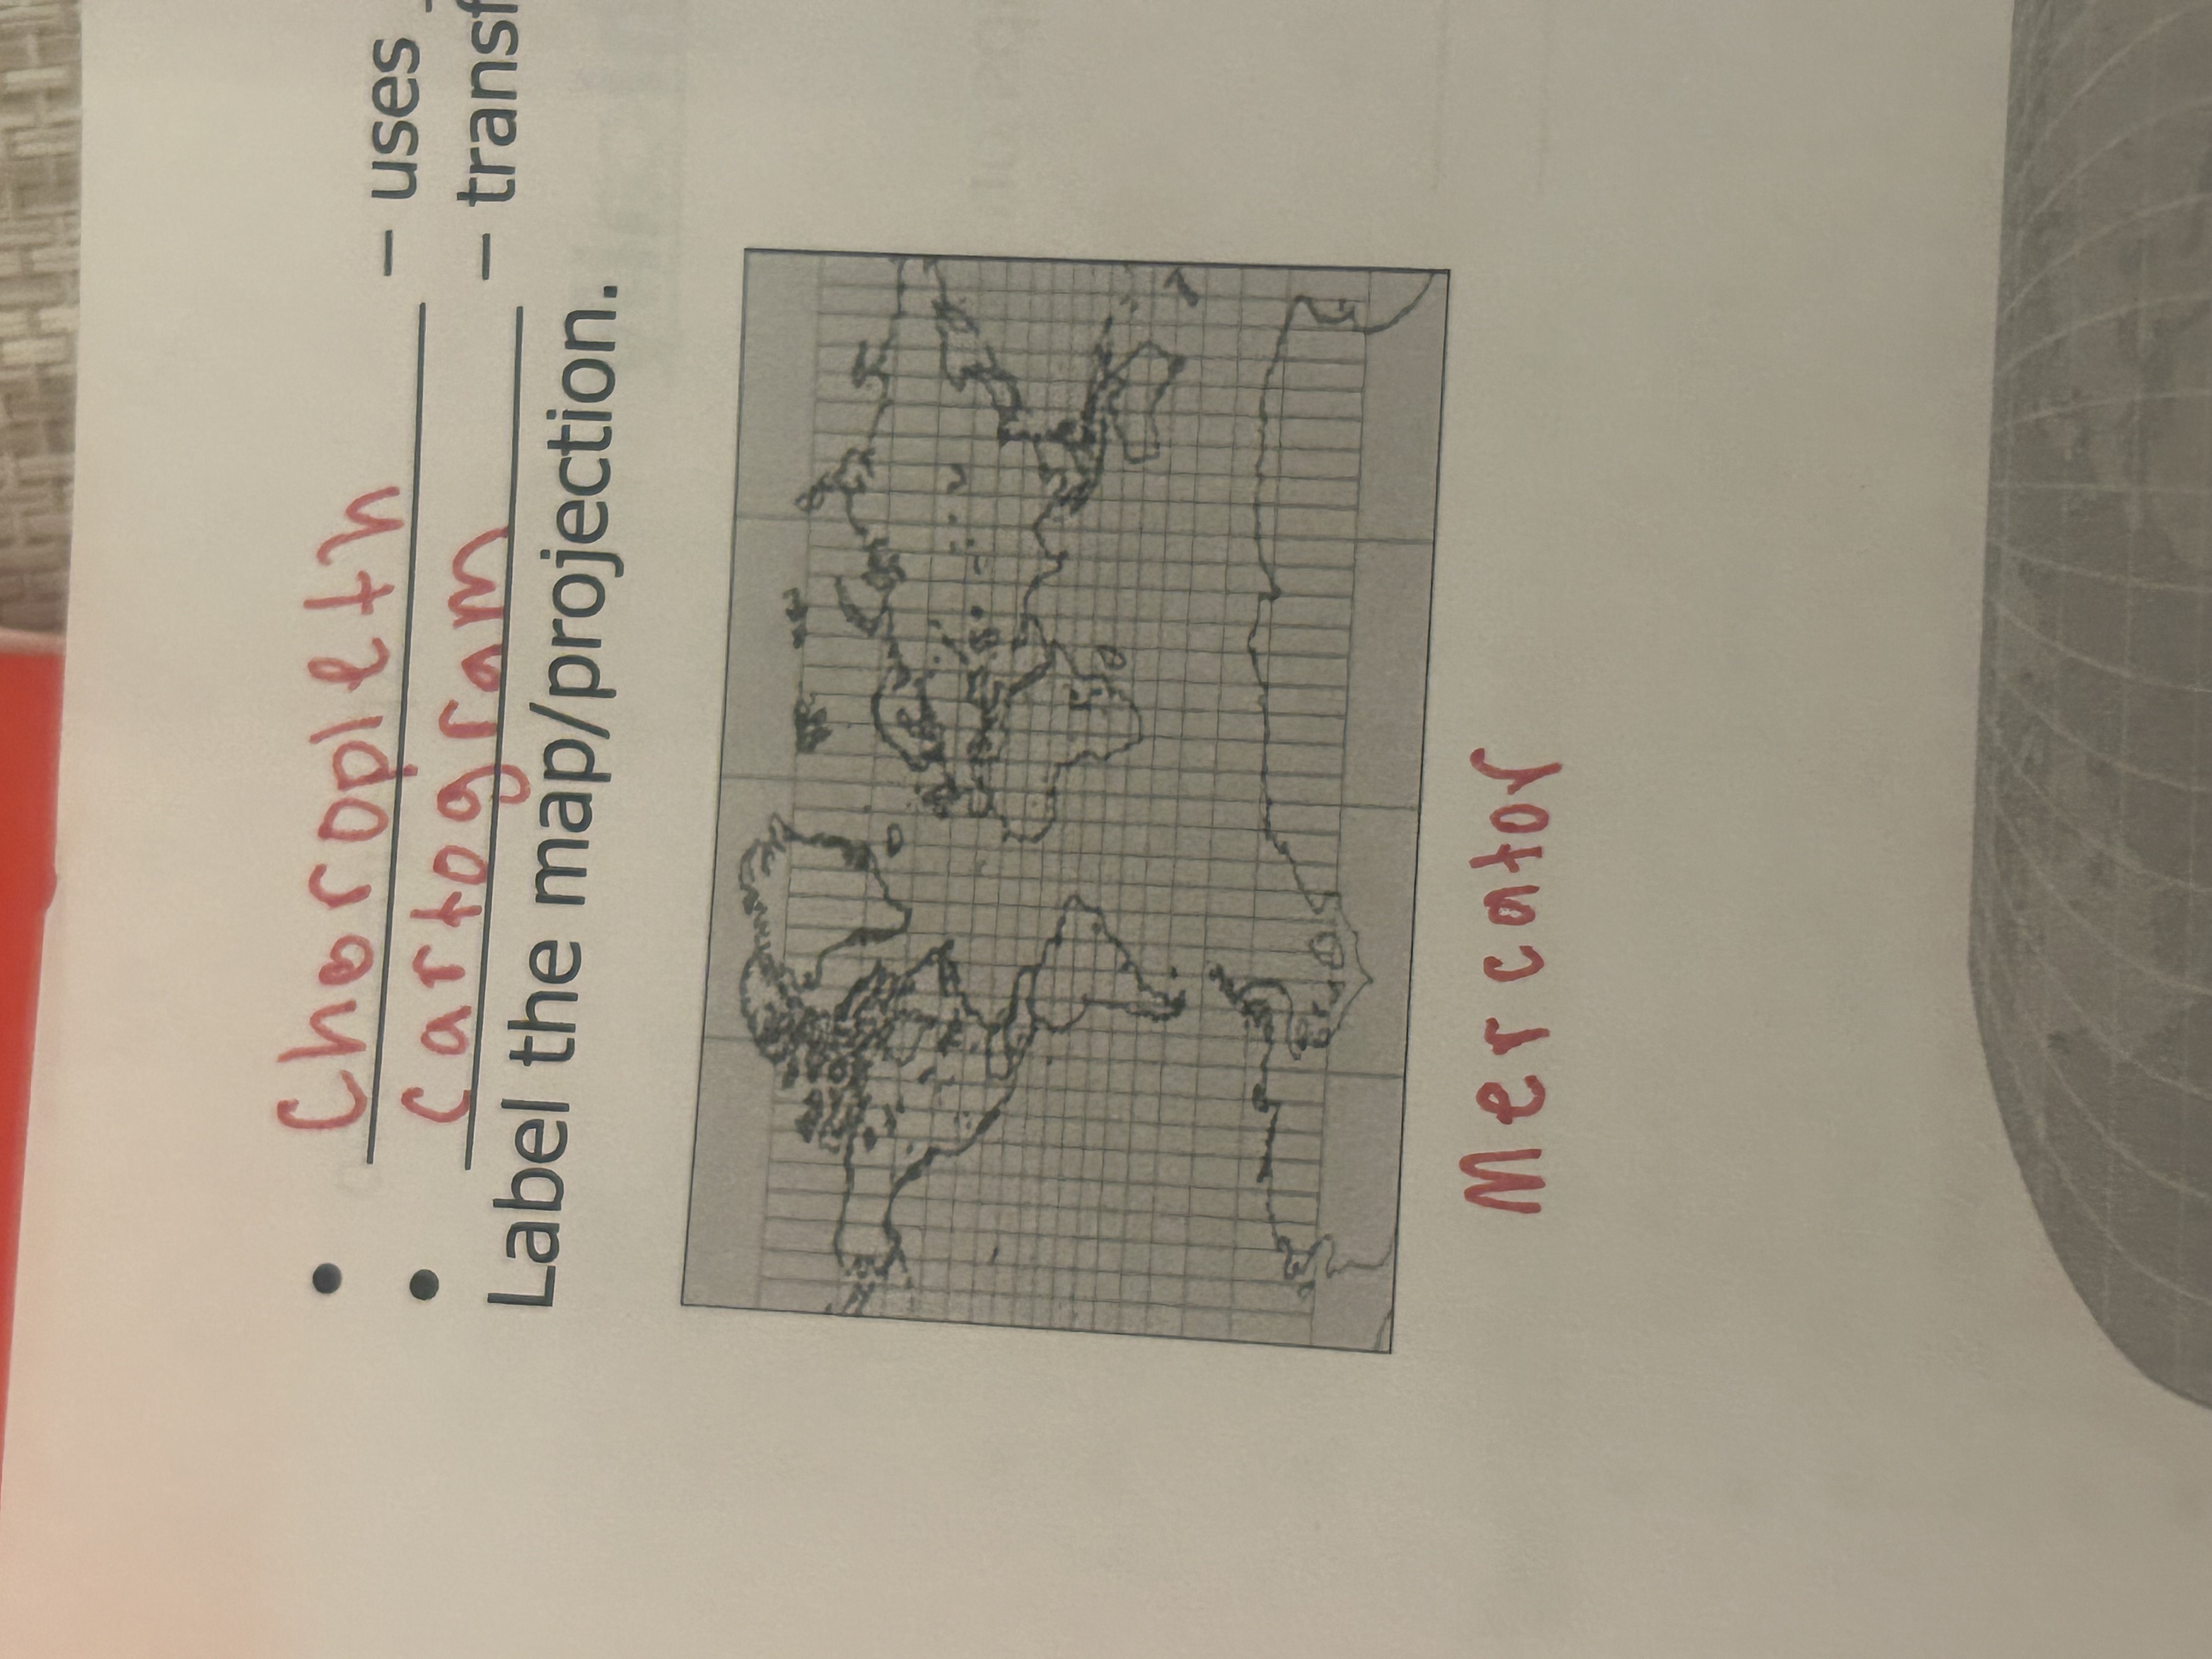
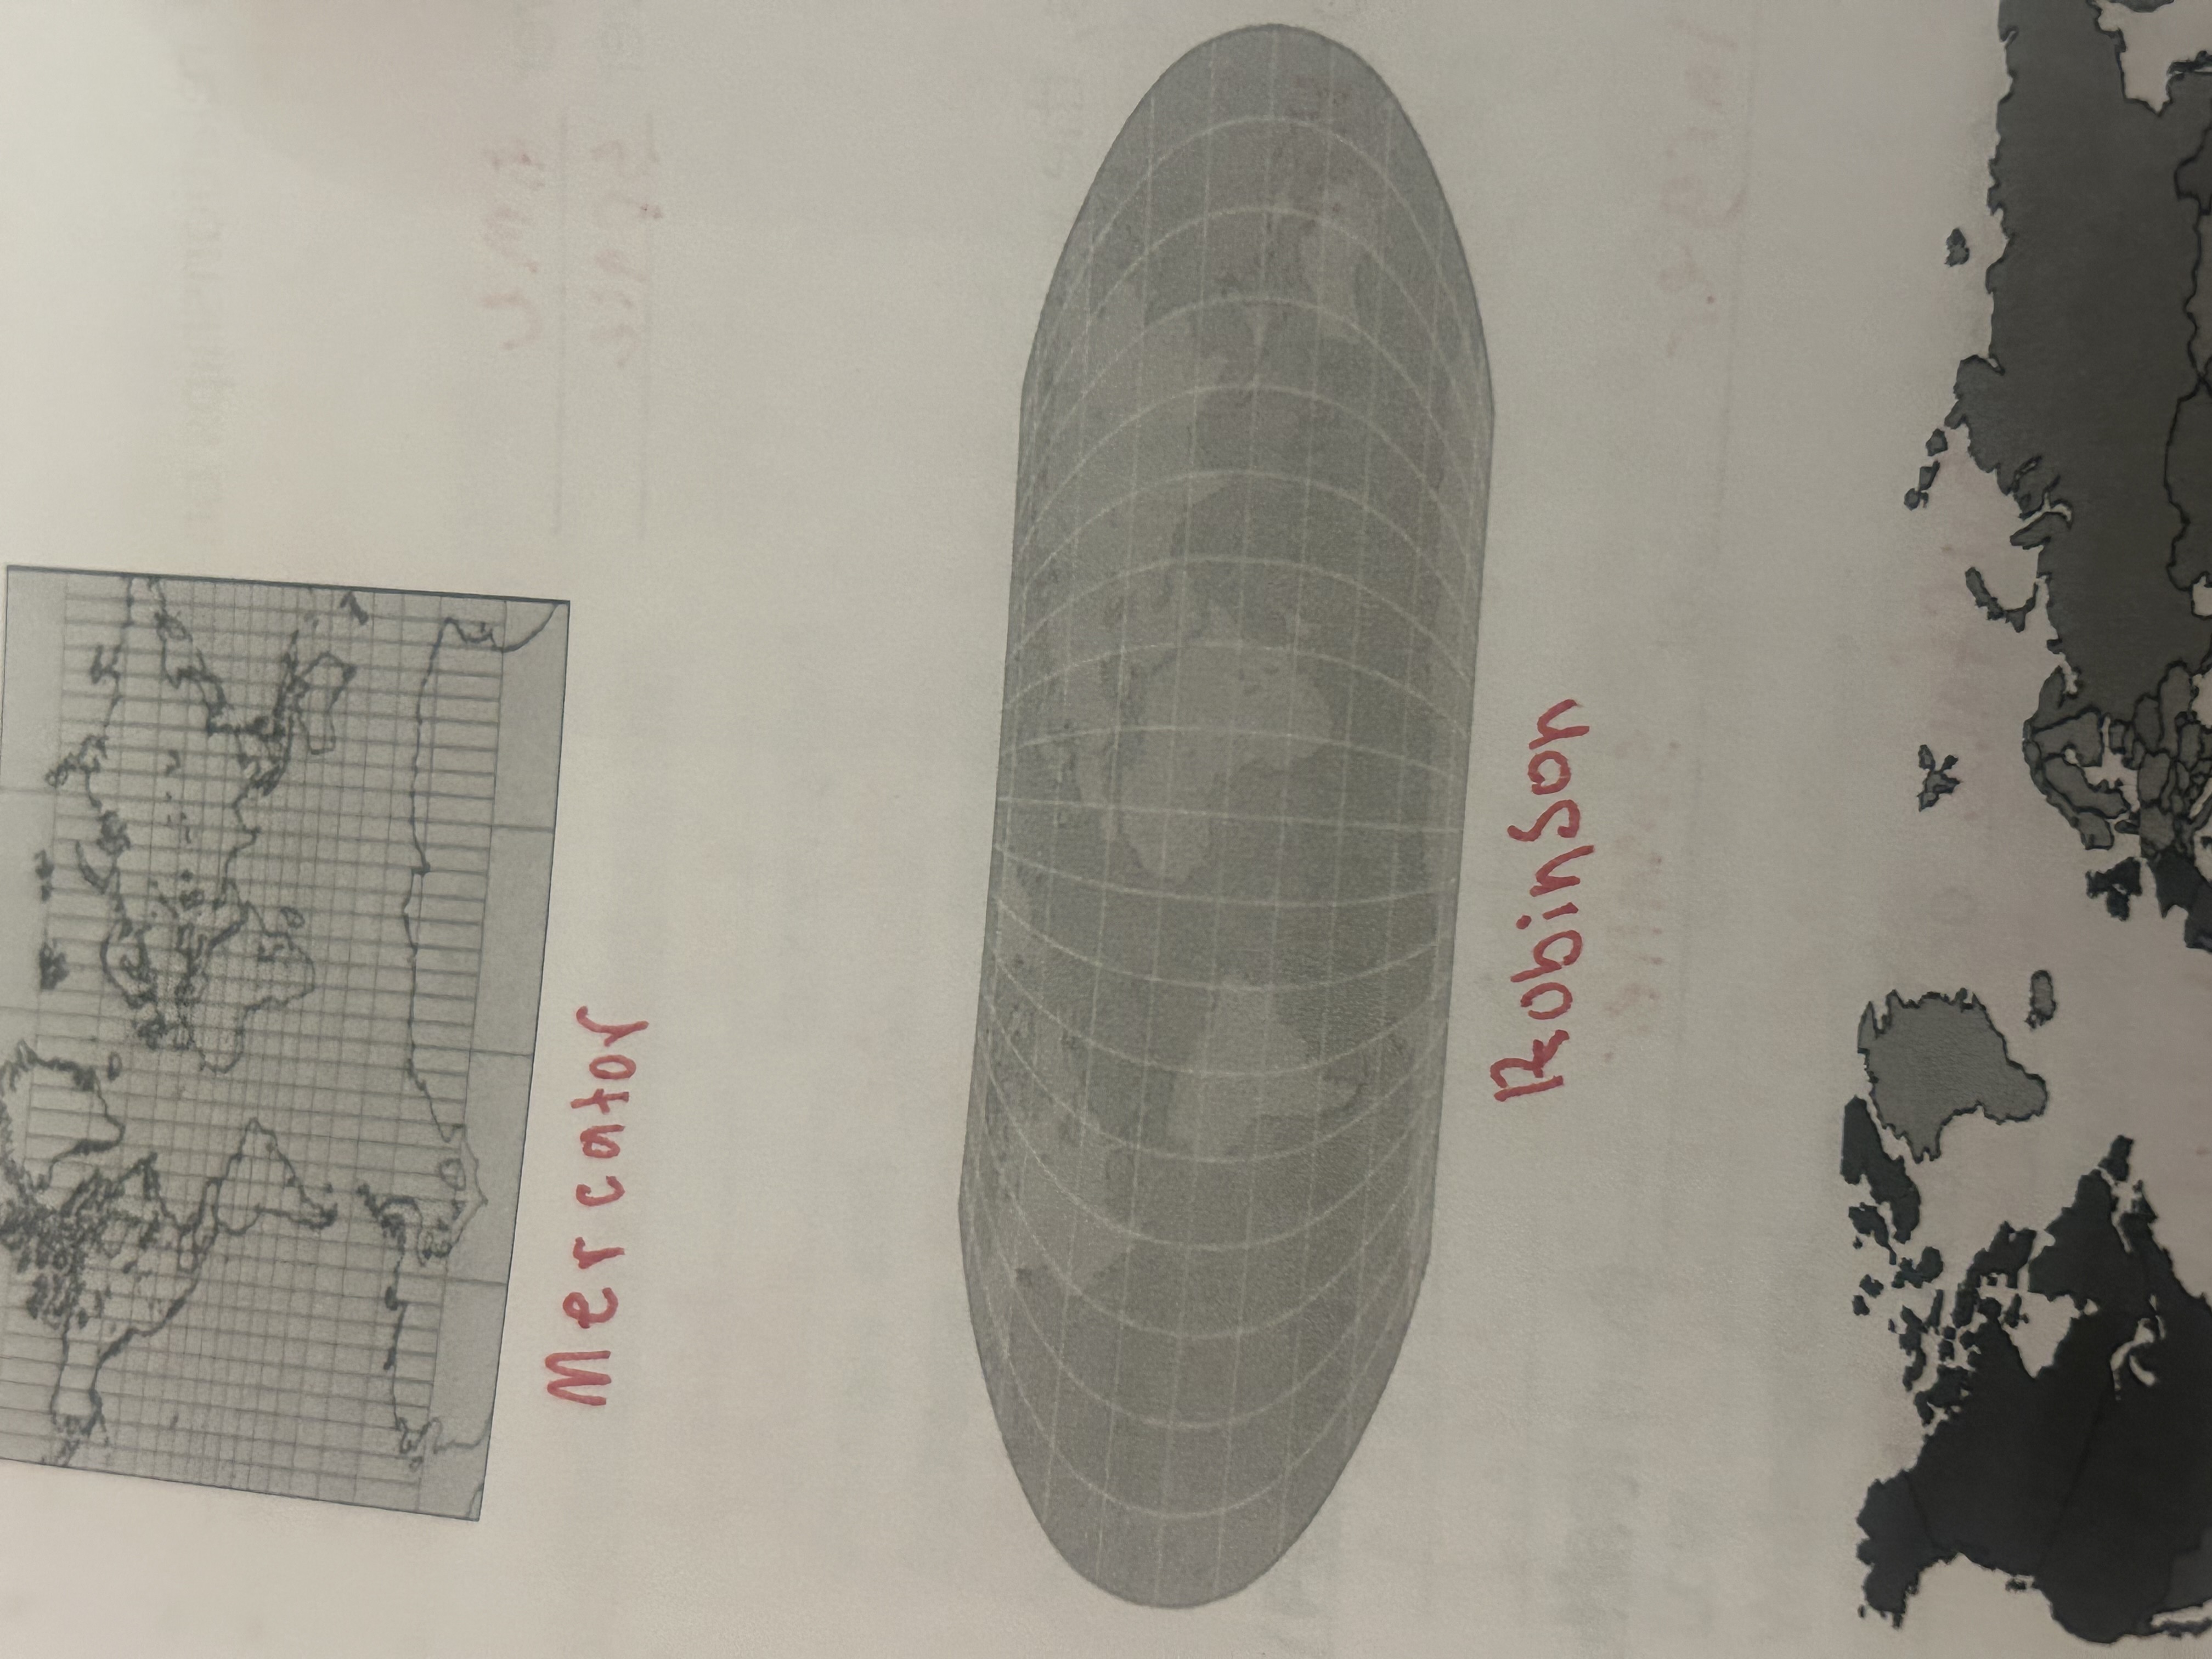
mercator
preserves direction but distorts area (higher altitudes distorted - Greenland appears huge)
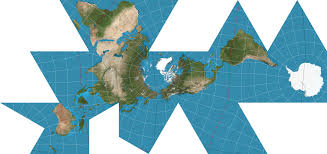
fuller
maintains accurate size and shape; completely rearranges directions
robinson
distorts all 4 but minimizes error in each (most balanced)
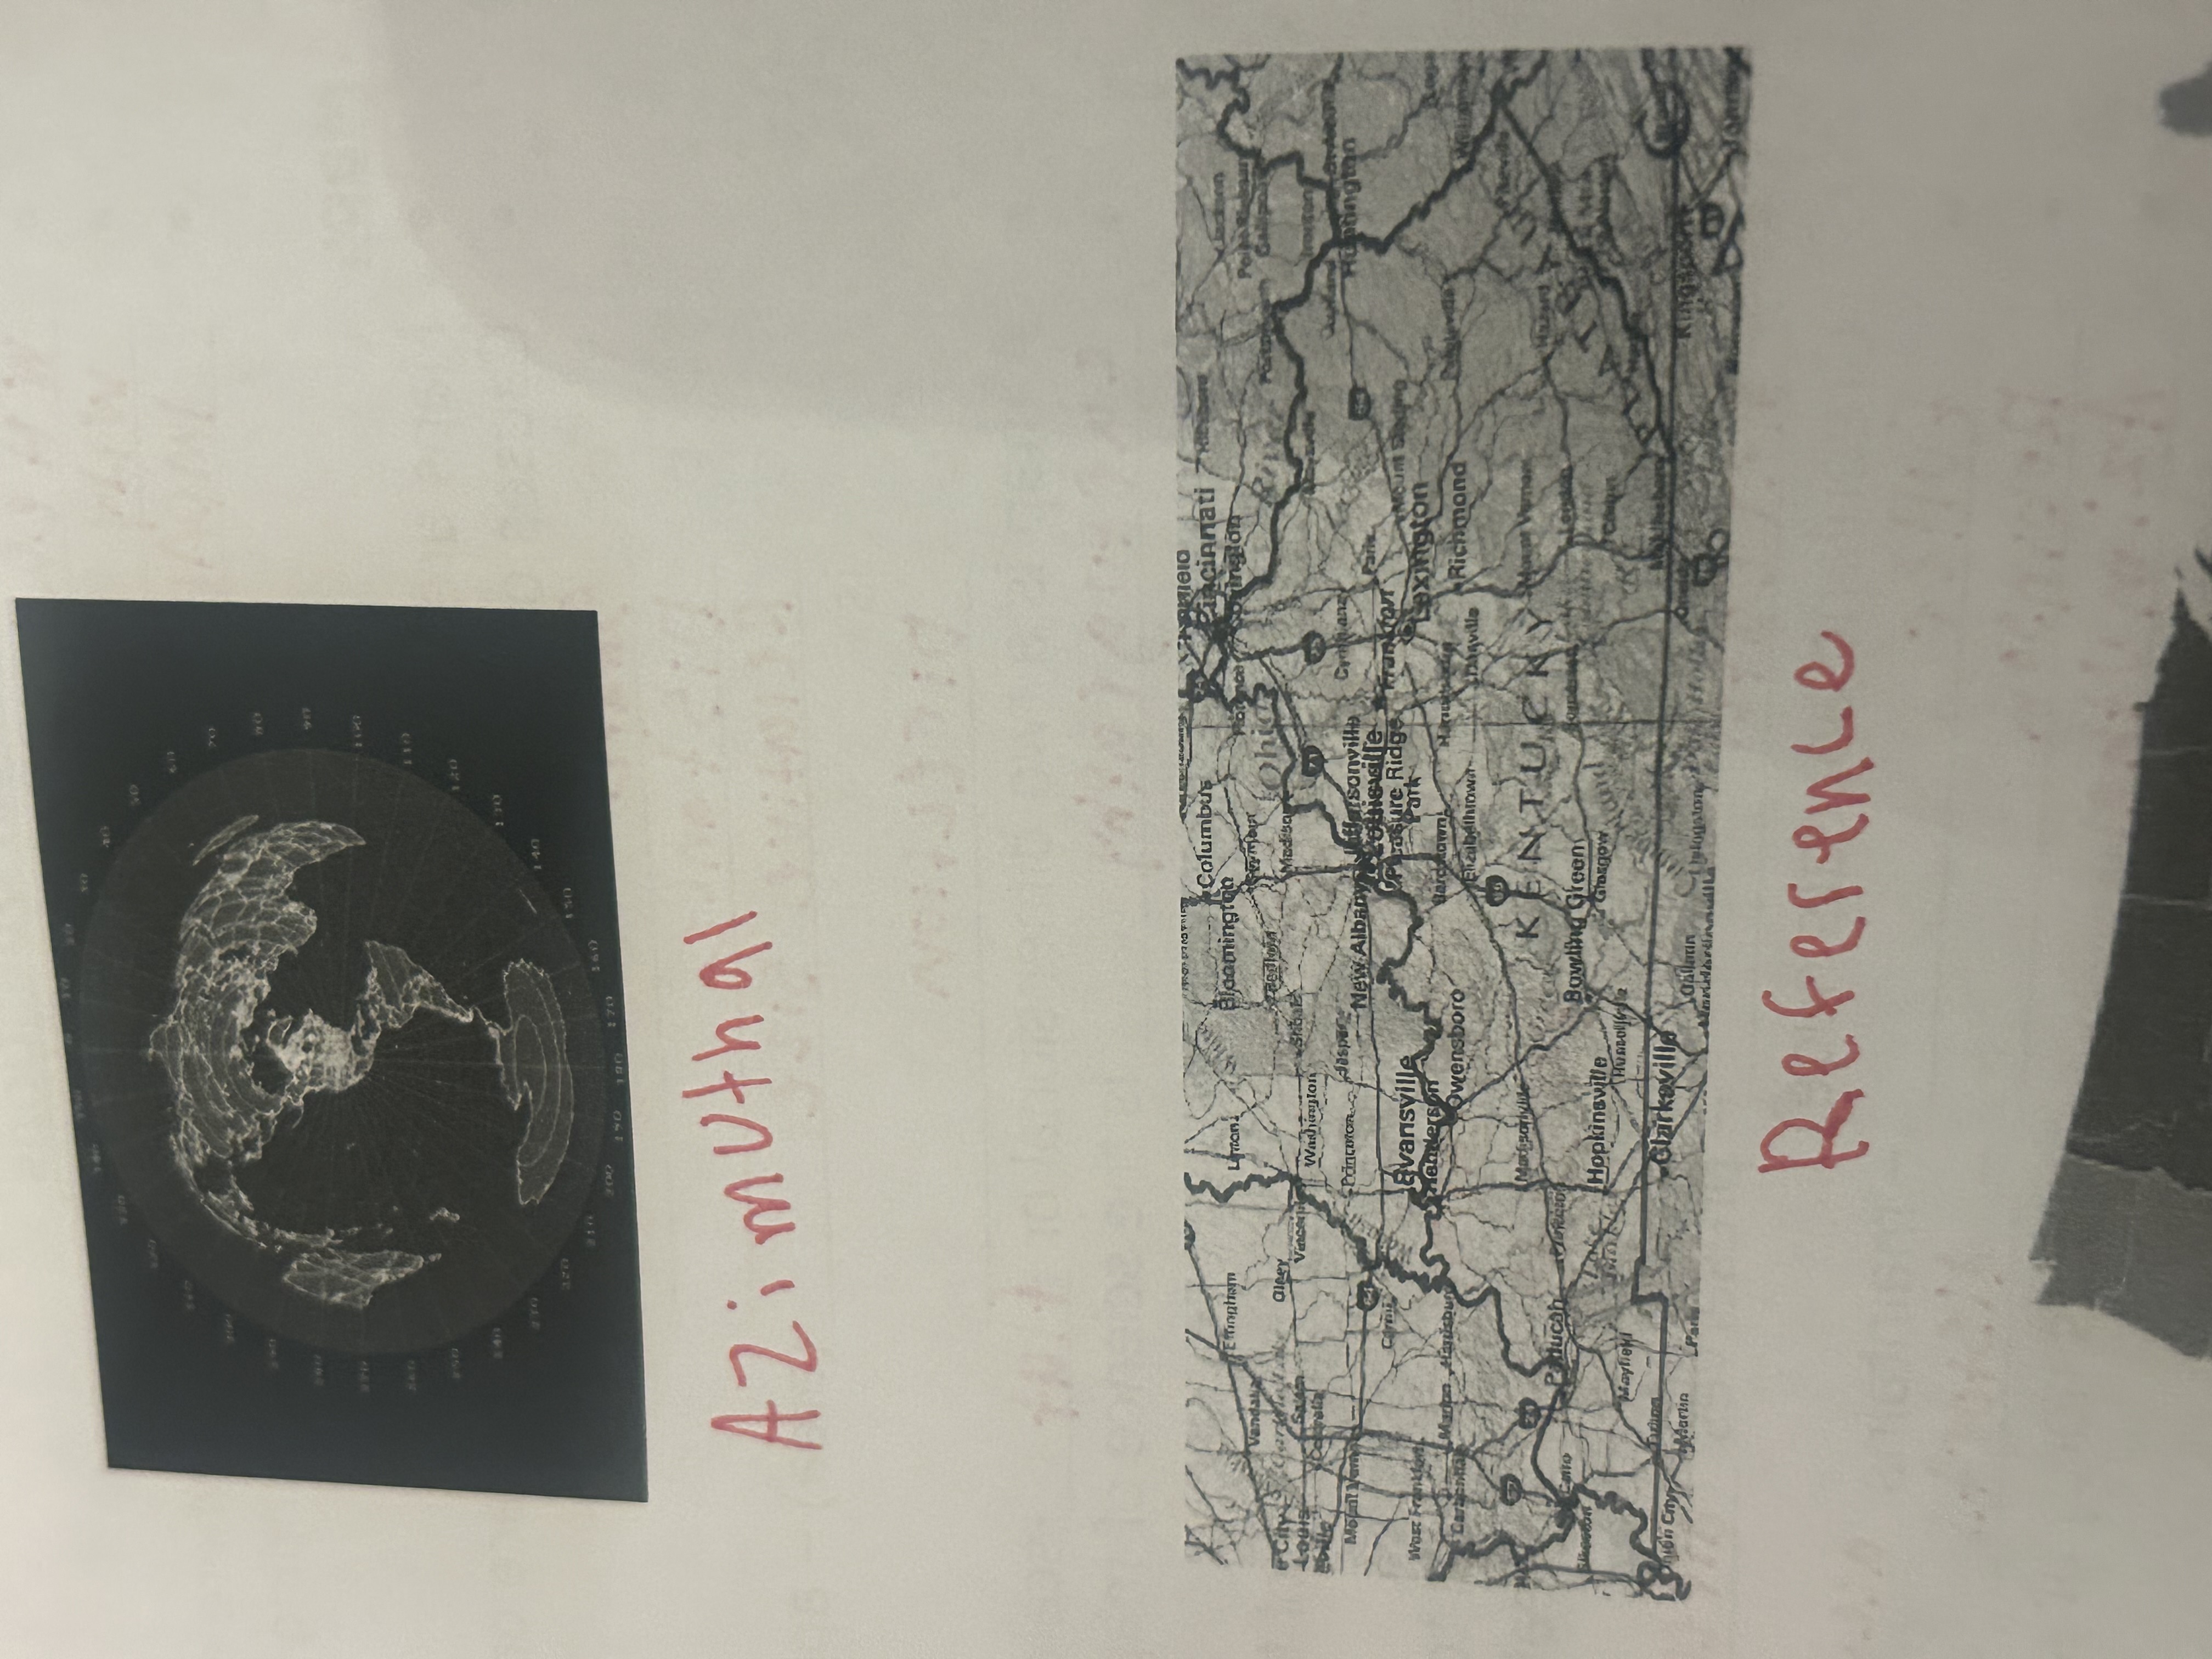
azimuthal
puts north or south pole at center of map (view of looking up or down at earth)
what is a map
a two dimensional or flat scale model of Earth's surface or a portion of it
whats a projection
earths 3d surface onto a 2d flat surface
what are the types of projections
mercator, fuller, Robinson, azimuthal
what are the types of maps?
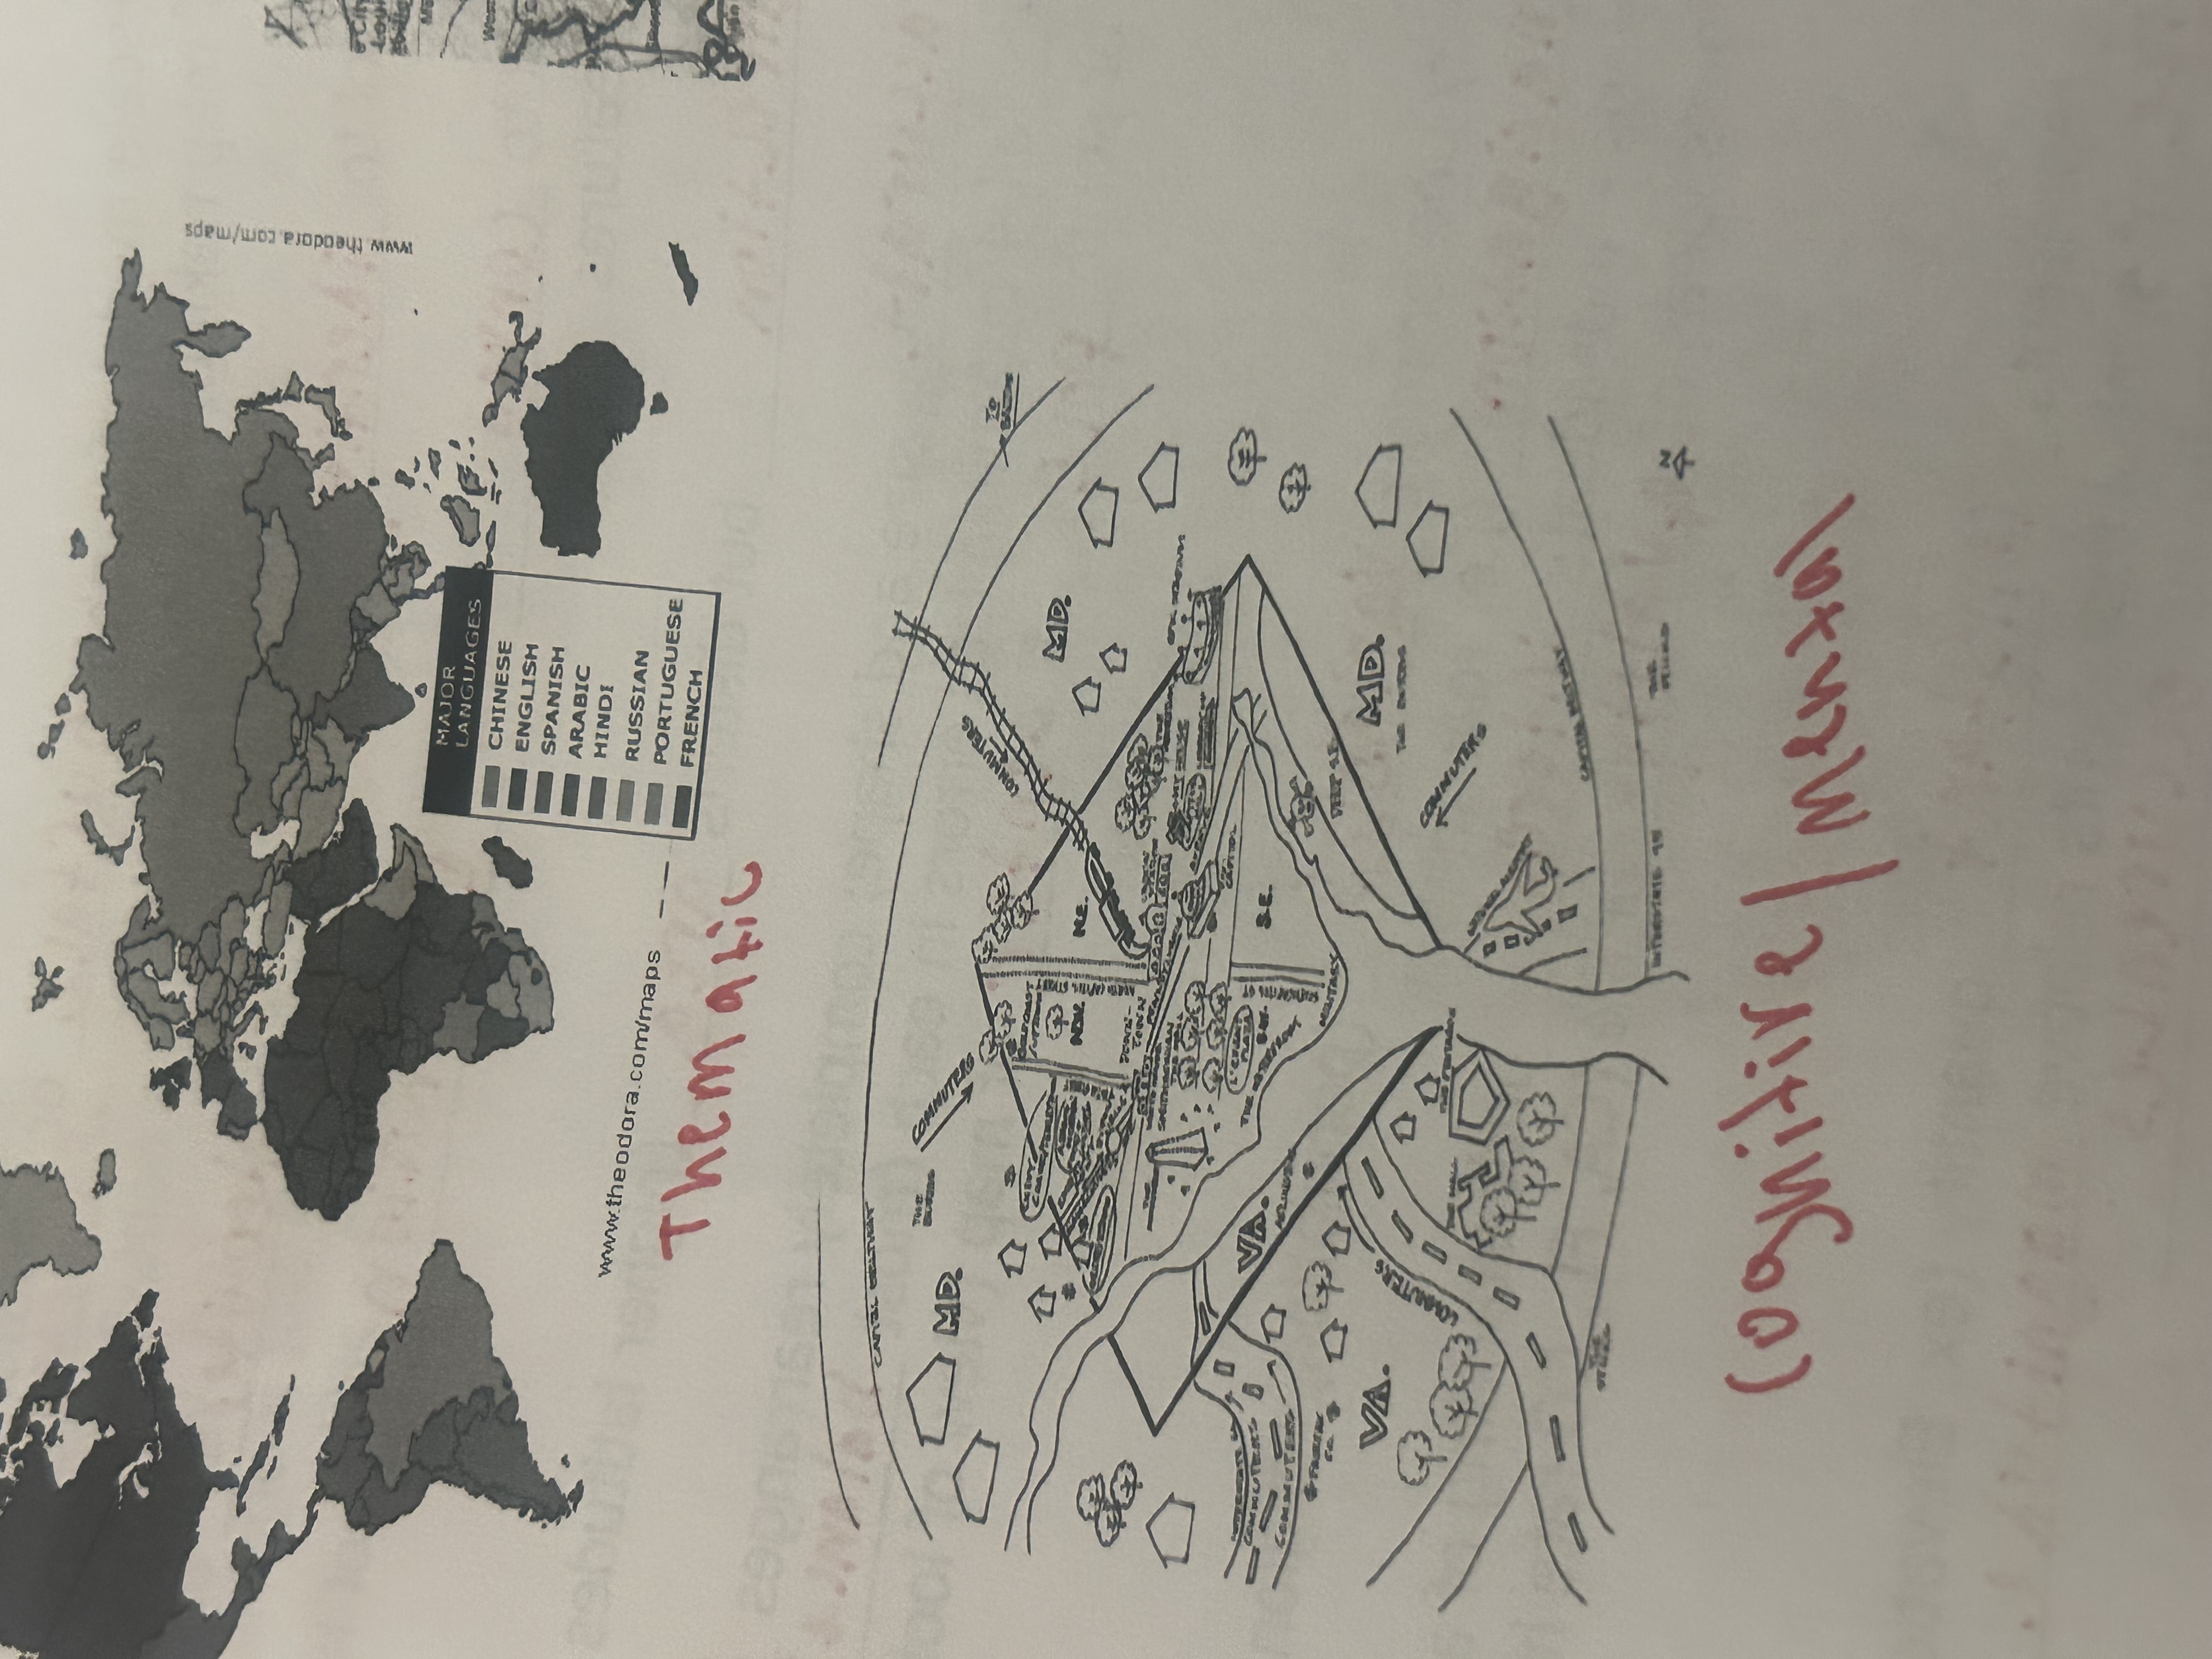
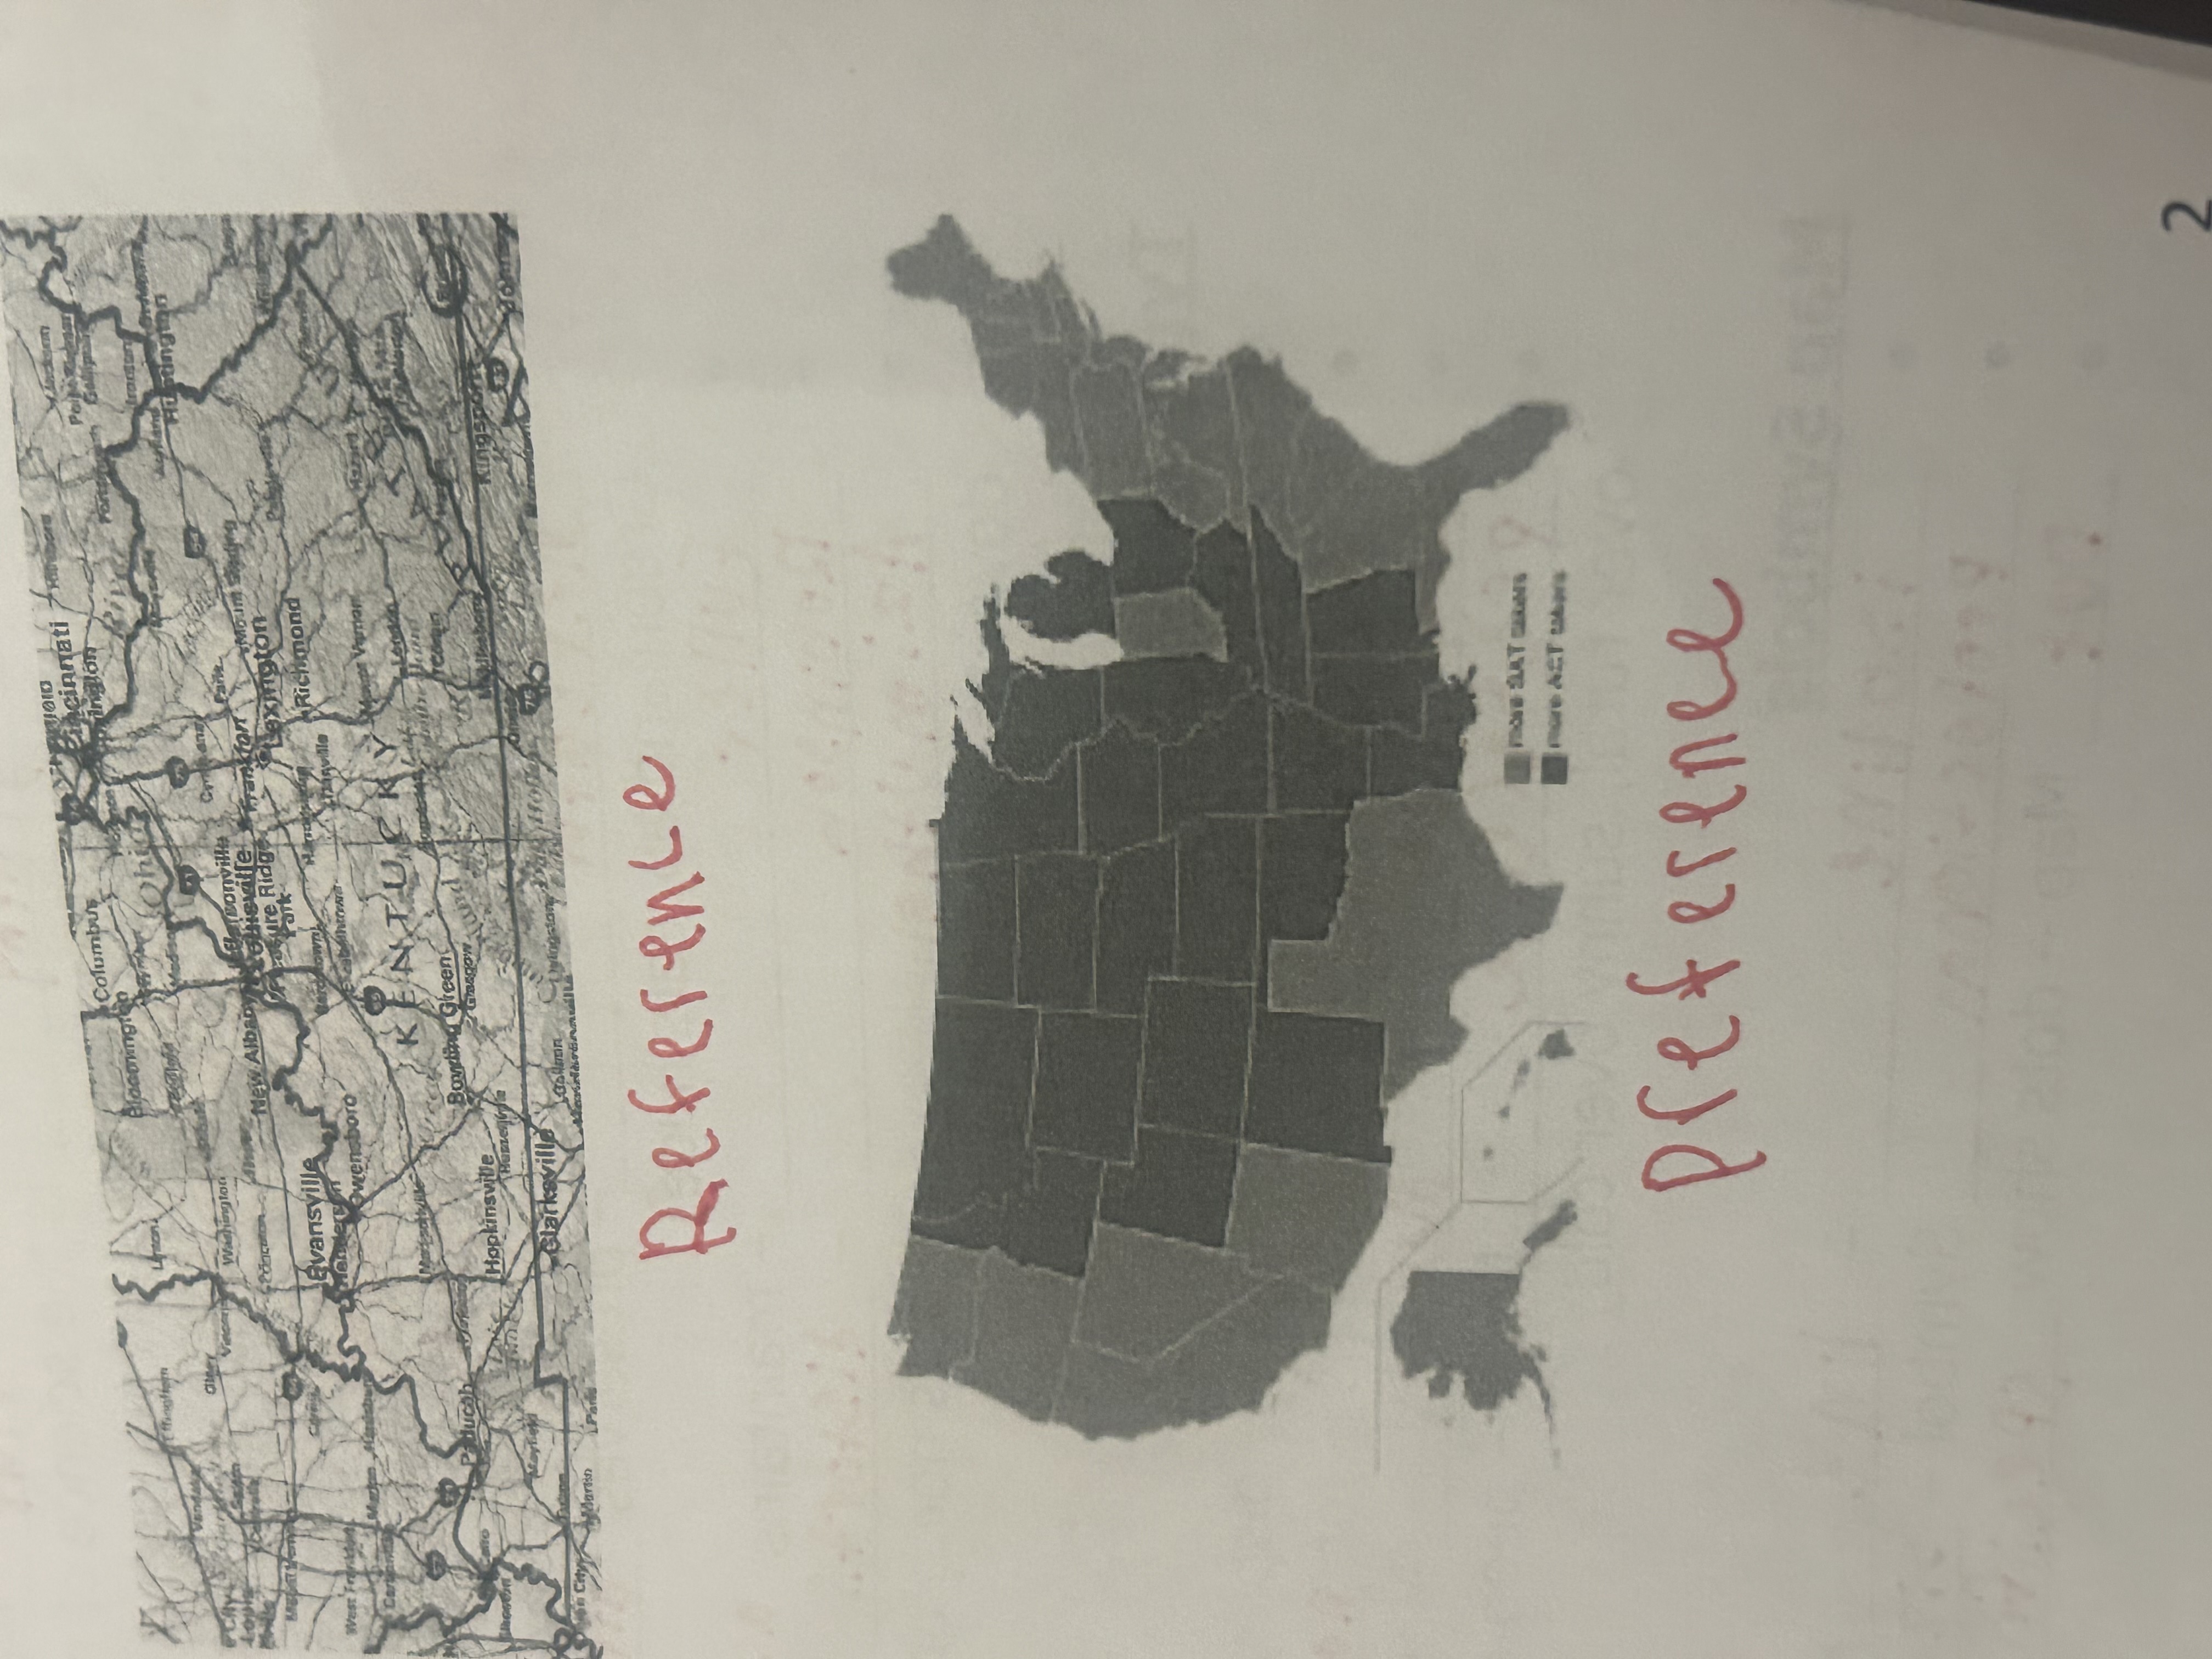
thematic, reference, cognitive/mental, preference
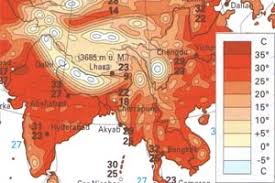
thematic map
display one or more variables ( population, religion, language)
reference map
for navigation (I.e road maps)
cognitive/mental maps
individuals internal understanding of a place

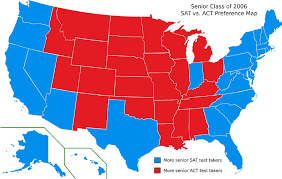
preference map
peoples ideas of quality of life (CA, FL, CO rate highest,, city over rural, sunny over cold)
what are the map symbols?
isoline, proportional, dot map, choropleth, cartogram
isoline
line represents constant quantity (ex. elevation)
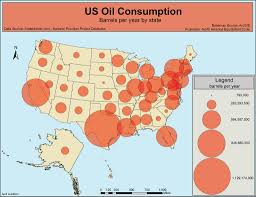
proportional symbol
size of symbol represents relative magnitude of value
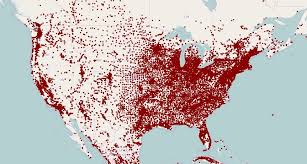
dot map
dots show specific location of occurrences
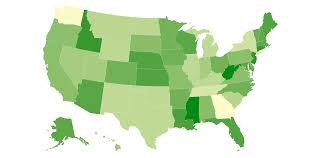
choropleth
uses color to represent data
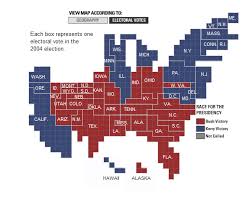
cartogram
transform country size relative to data
stressed use of…
empirical evidence, more scientific, quantitative, and objective