STAT 164 - RANDOM VARIABLES AND PROBABILITY DISTRIBUTION CHAPTER 2
1/88
There's no tags or description
Looks like no tags are added yet.
Name | Mastery | Learn | Test | Matching | Spaced | Call with Kai |
|---|
No analytics yet
Send a link to your students to track their progress
89 Terms
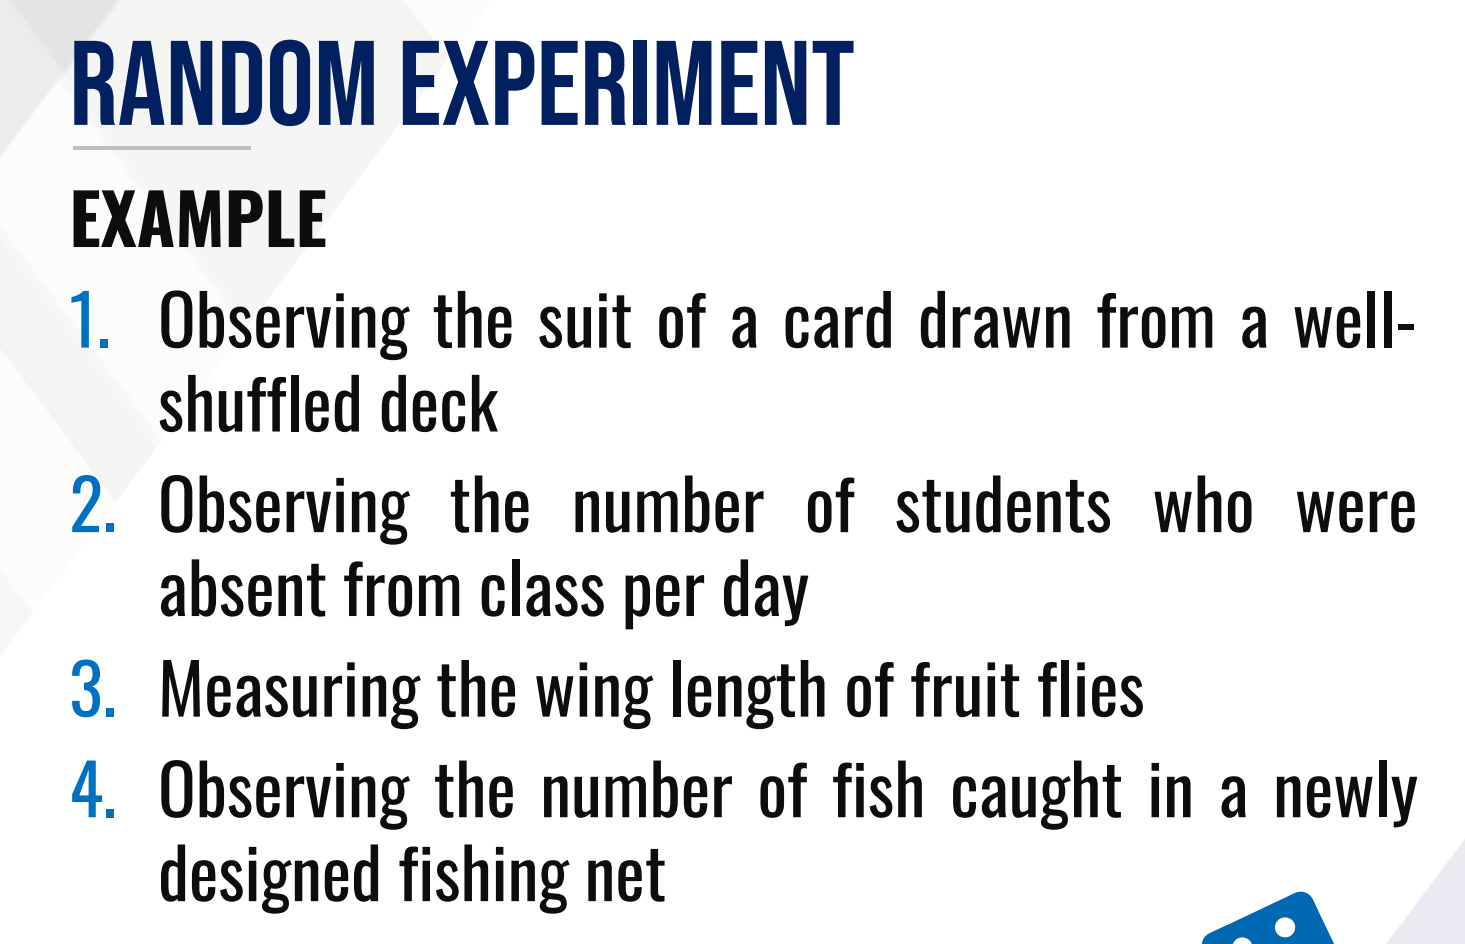
RANDOM EXPERIMENT
Although the possible outcomes are known in advance, the outcome of a particular trial is unpredictable.
a process of drawing observations capable of repetition under the same conditions with welldefined possible outcome
No.1 is the only valid random experiment
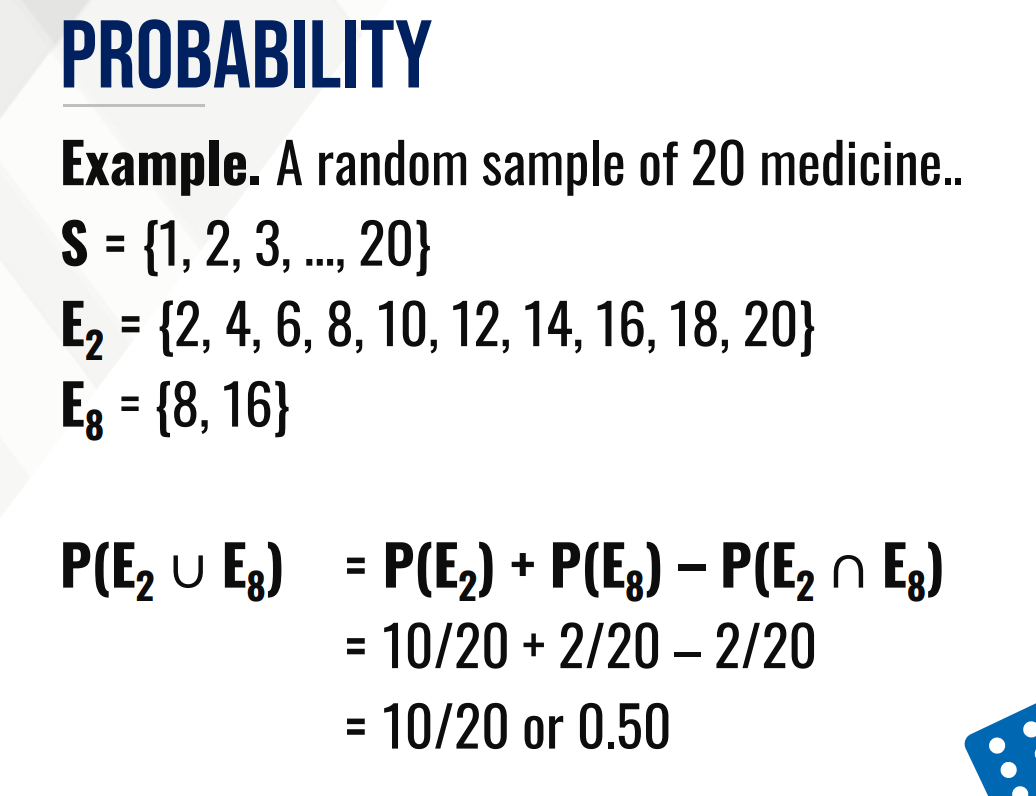
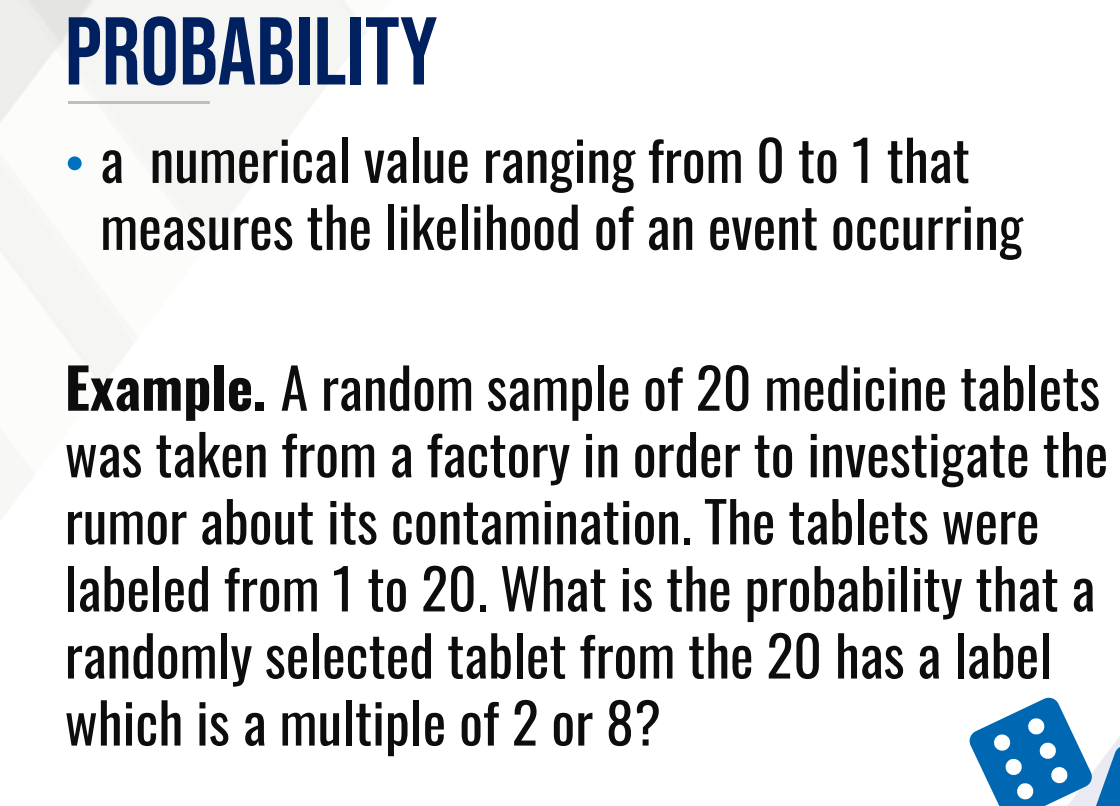
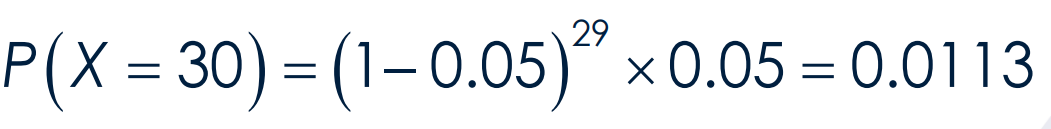
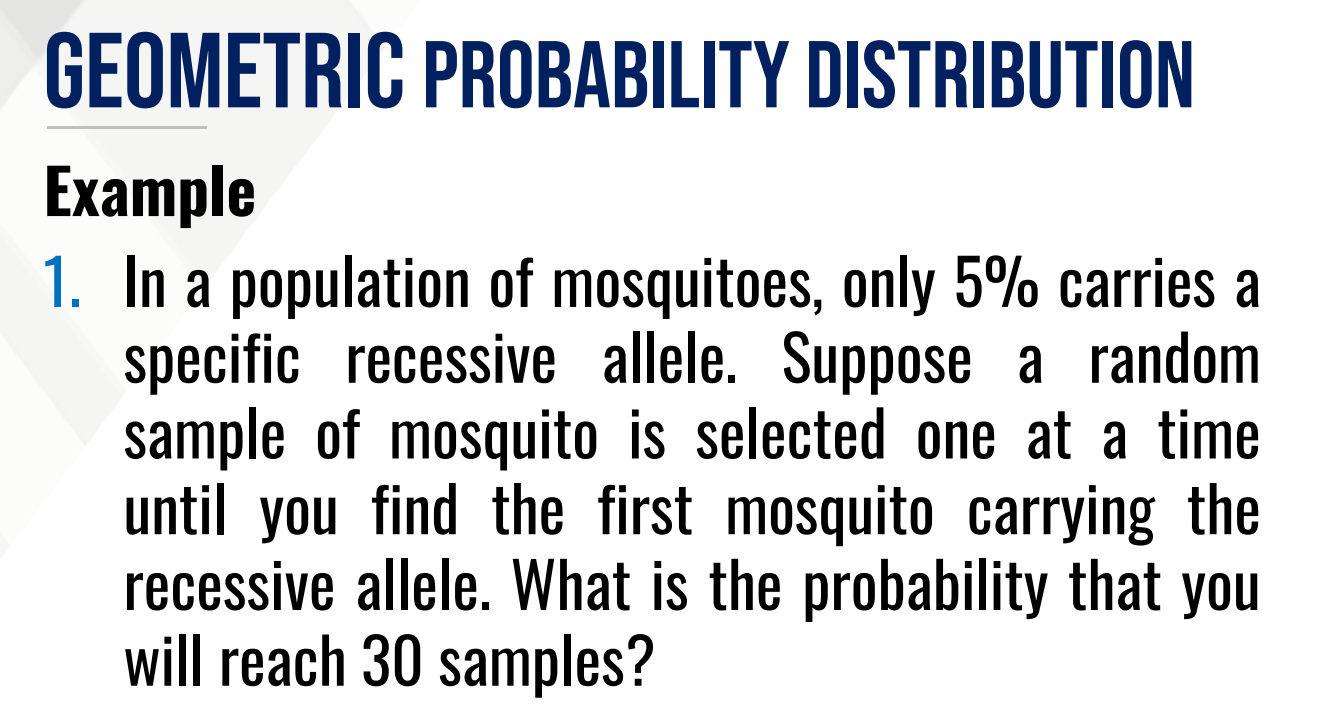
Which of the following is a random experiment.
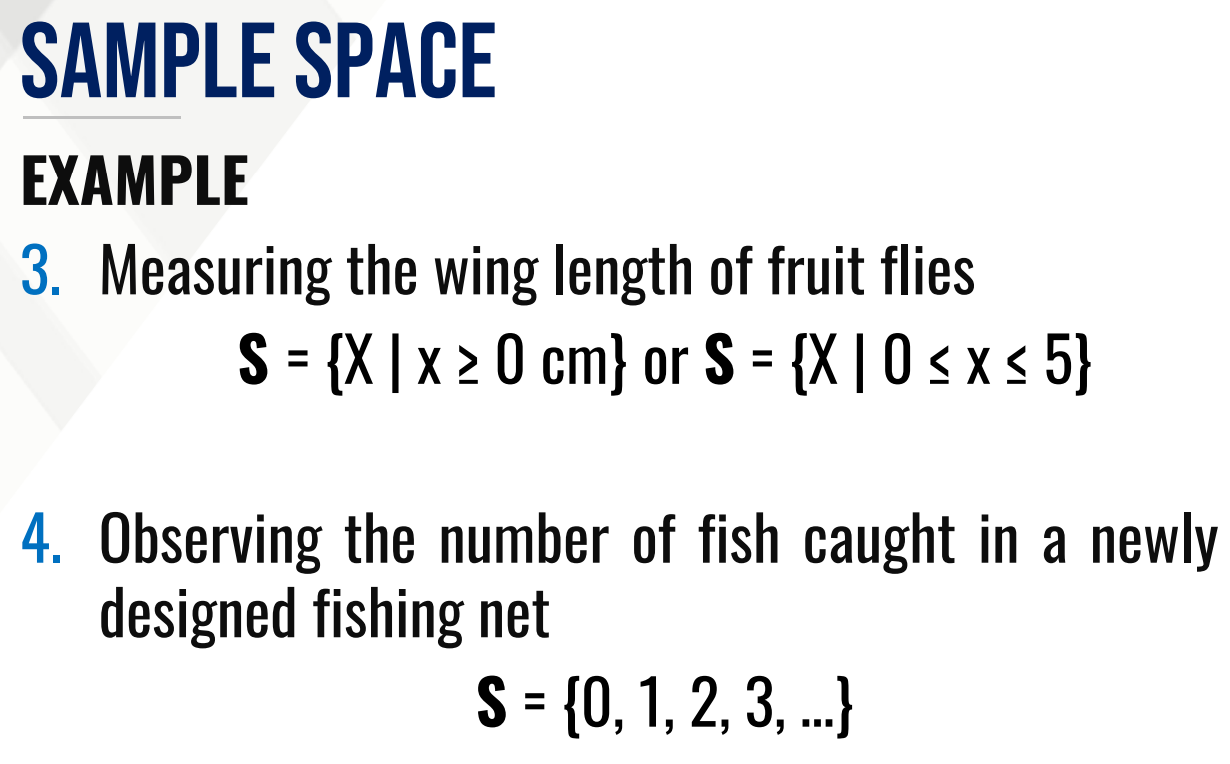
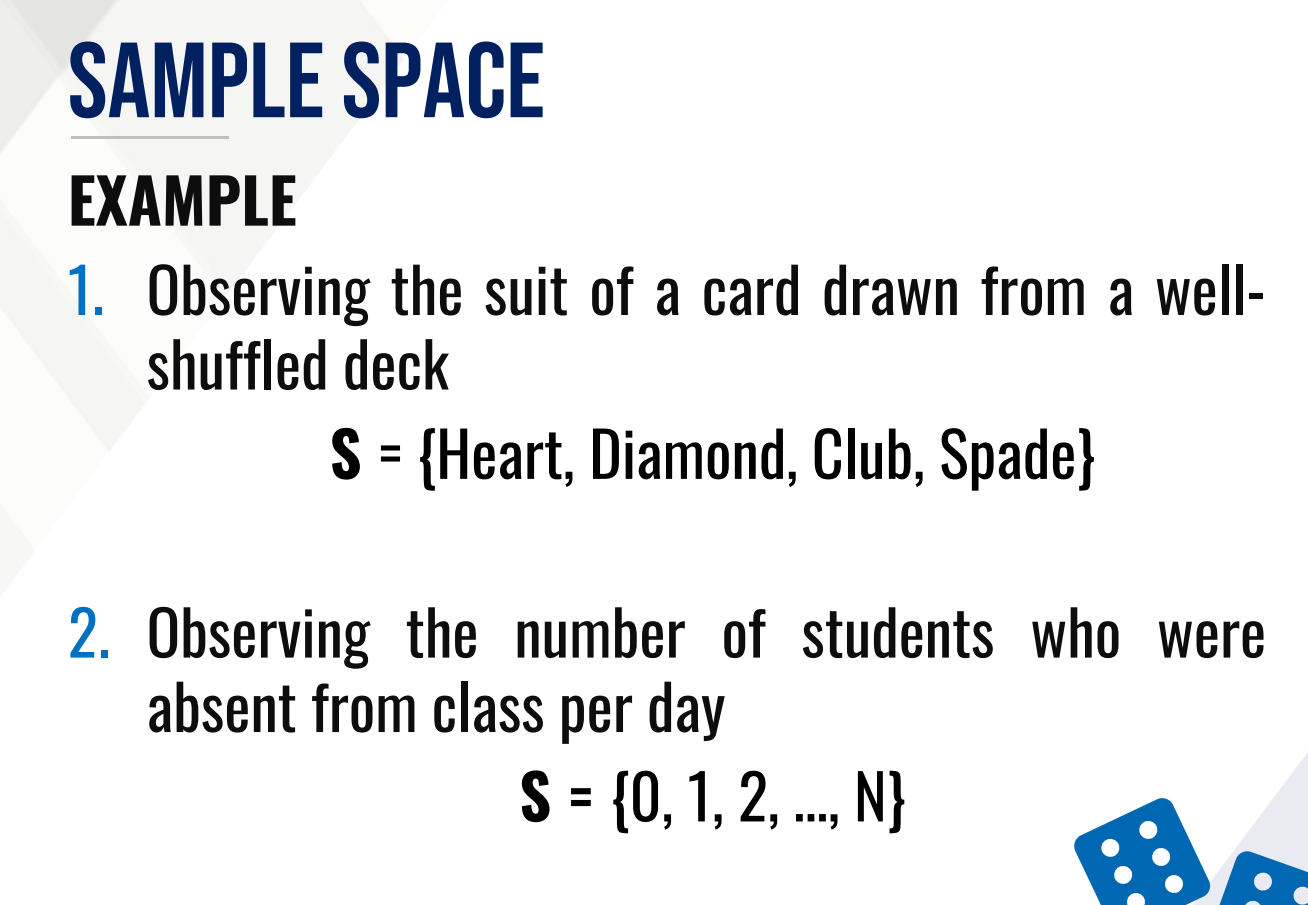
SAMPLE SPACE
It is a set or collection of all possible outcome of a random experiment.
It may either be finite or infinite.
outcome; sample points
Elements of the sample space are referred to as ___________ or _____________.
EVENT
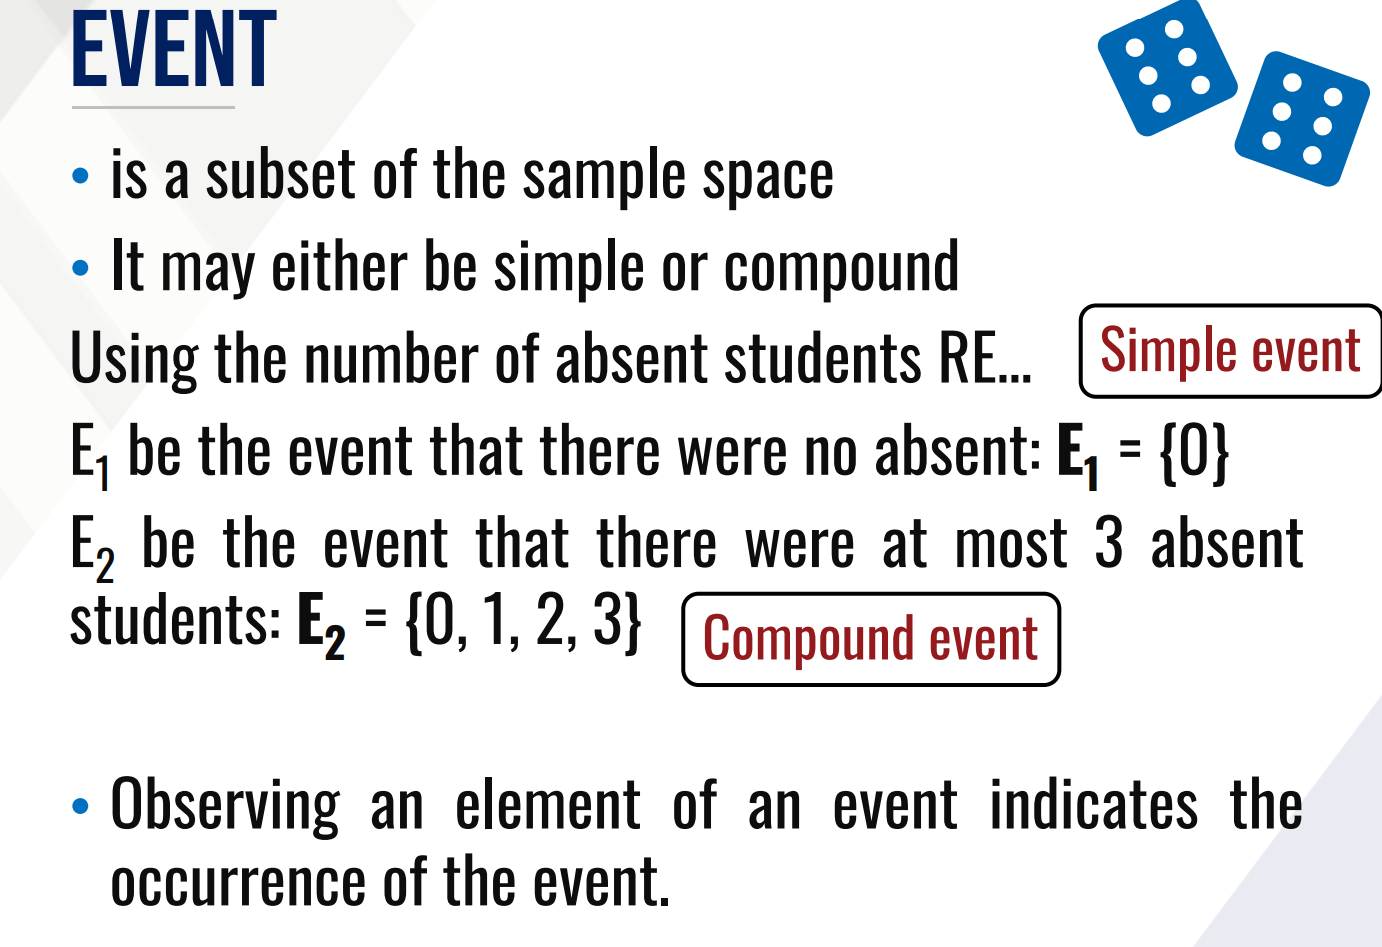
It is a subset of the sample space
EVENT
It may either be simple or compound
simple; compound
A compound event involves at least a minimum of two simple events.
A _________ event, is when only one event can occur. A __________ event in probability is the chance of two or more events occurring.
PROBABILITY
It is a numerical value ranging from 0 to 1 that measures the likelihood of an event occurring
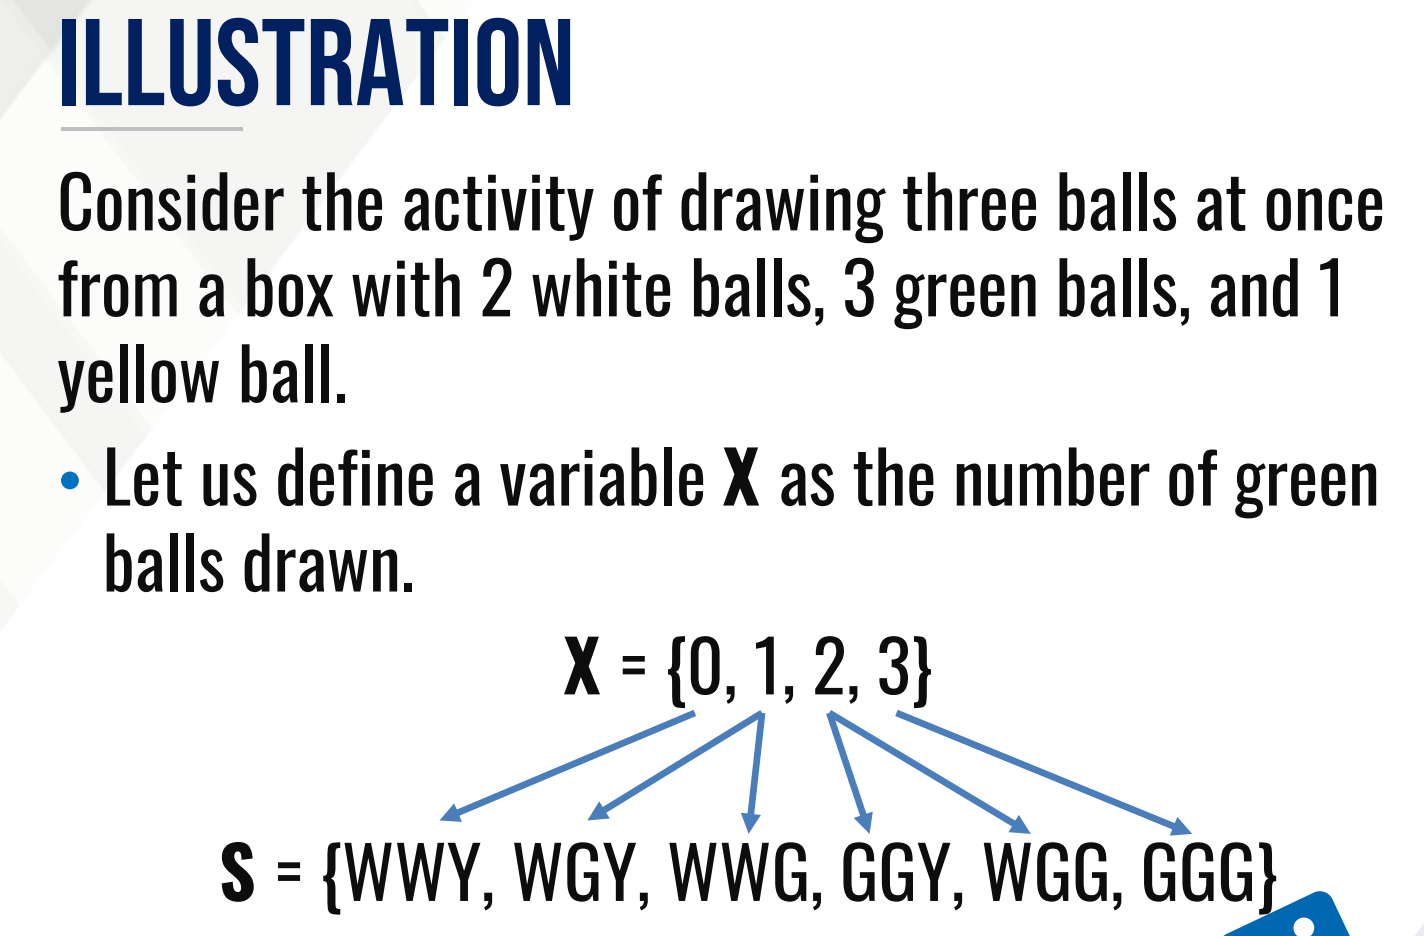
RANDOM VARIABLE
It is a rule or function that assigns exactly one real number to every possible outcome of a random experiment.
It can either be discrete or continuous
discrete RANDOM VARIABLE
take on a set of distinct possible values or a countably infinite number of possible values
continuous RANDOM VARIABLE
take on any value within a specified interval or continuum of values
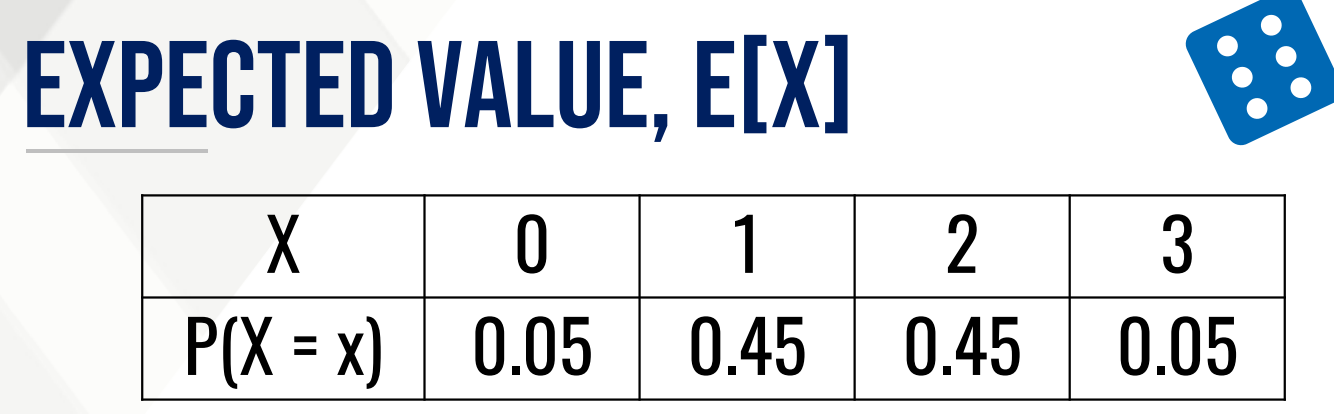
PROBABILITY DISTRIBUTION
Listing of all possible values of a random variable with their corresponding probabilities
The sum of the probabilities is equal to 1.0.
PROBABILITY DISTRIBUTION
It may be presented in the form of a table, formula, or graph.
PROBABILITY DISTRIBUTION
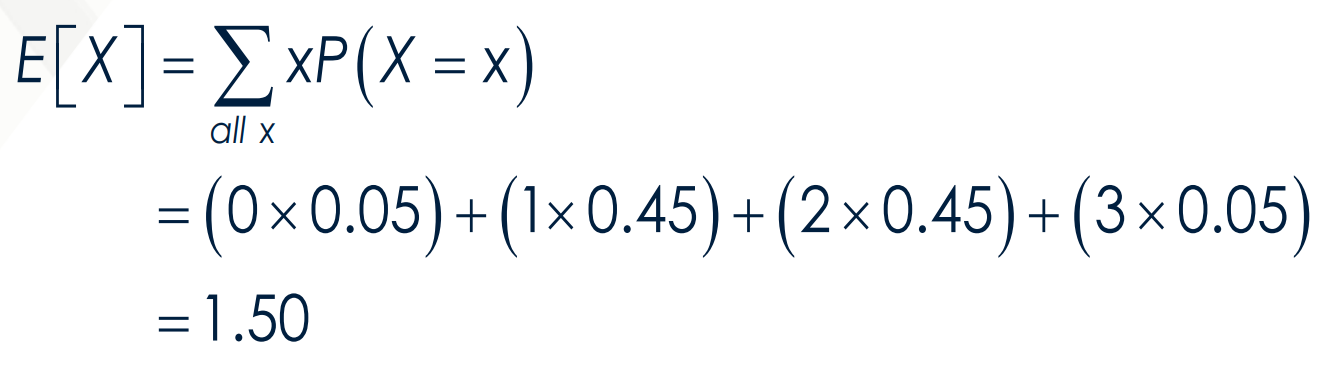
It gives the expected value of a random variable denoted by μx or E[X] which is interpreted as the long-run average of a random variable
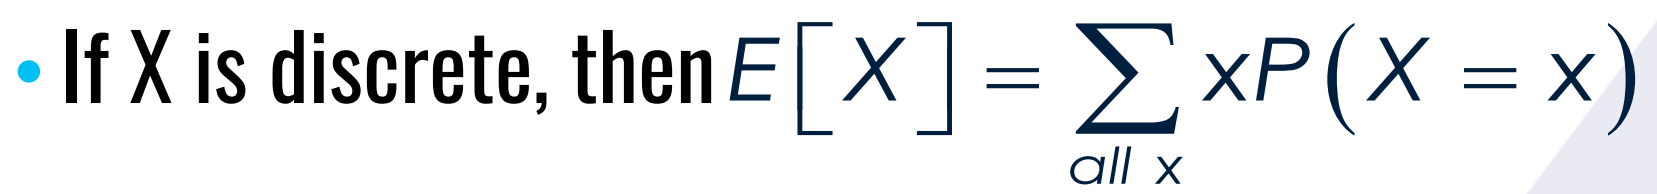
What is the formula for the expected value E[X] if X is discrete?
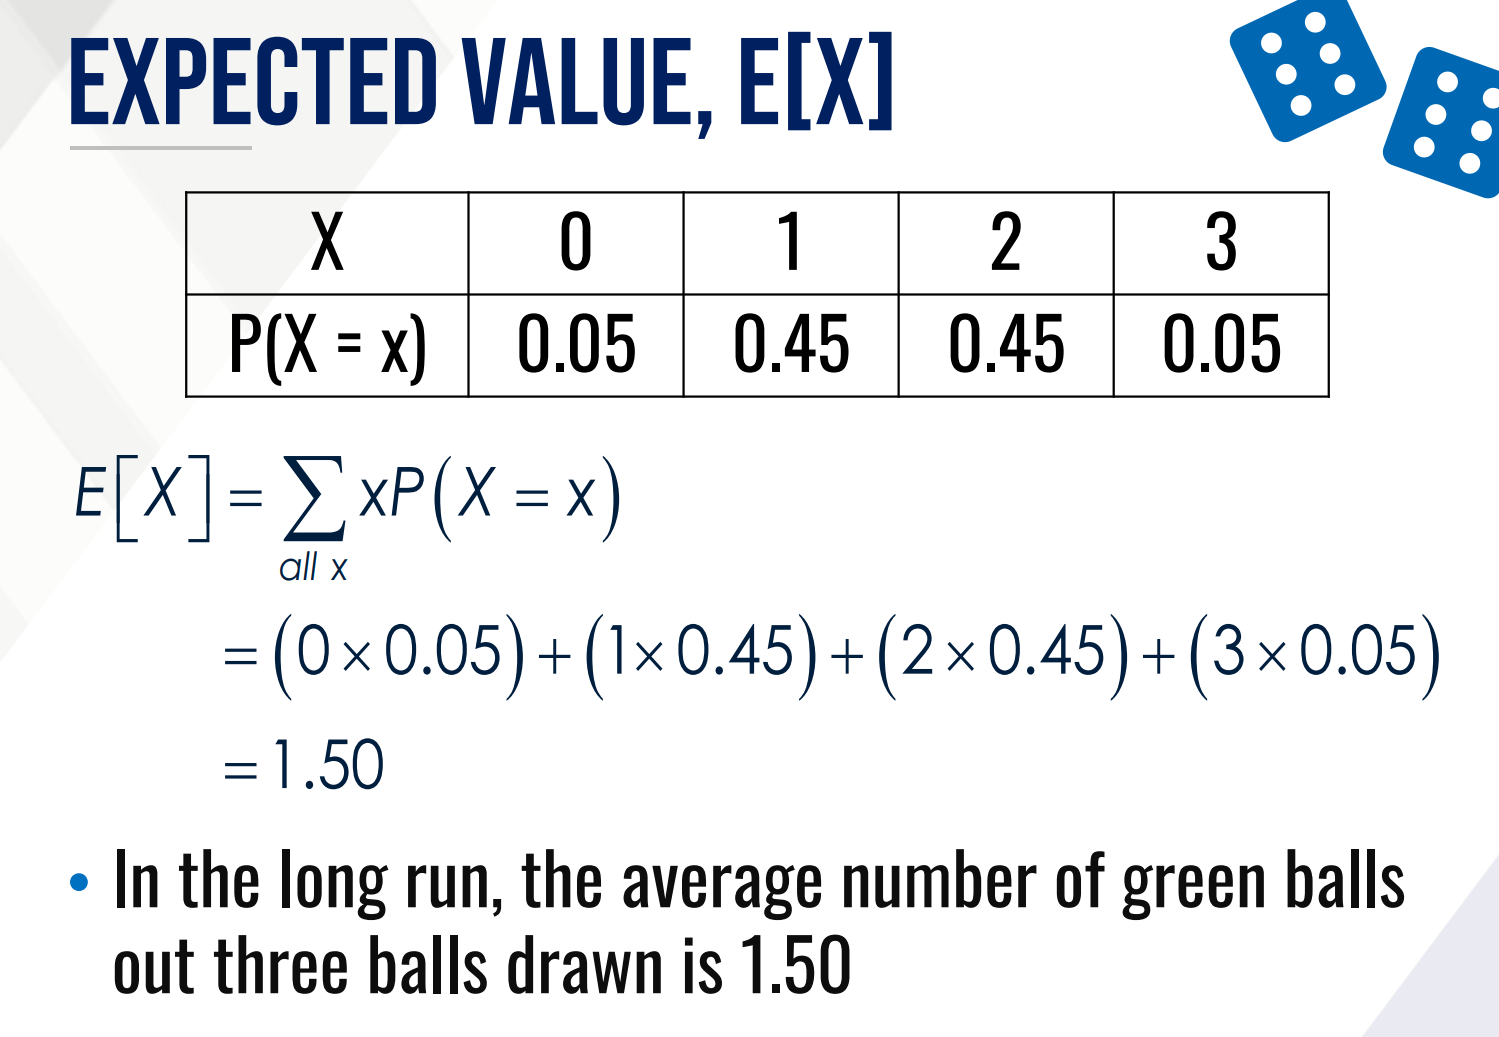
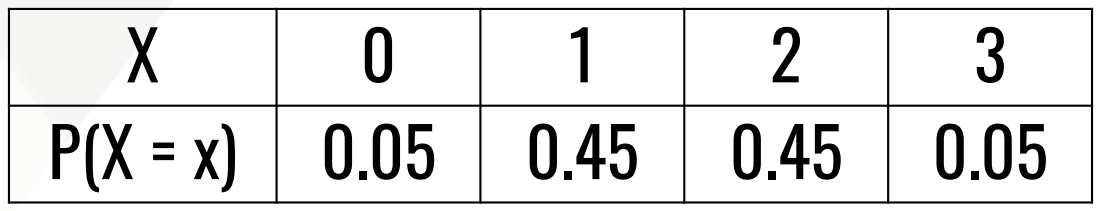
Calculate the expected value of the following:
PROBABILITY DISTRIBUTION
It also gives the variance of a random variable denoted by σ2x or V[X] which is the squared average deviation of the values of the random variable from μx.
variance of a random variable denoted by σ2x or V[X]
It is the squared average deviation of the values of the random variable from μx.
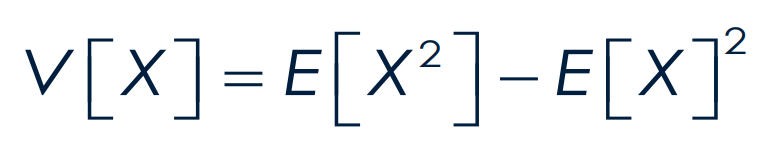
We usually get the standard deviation, σx or SD[X] which is the positive square root of V[X]
What is the formula for variance?
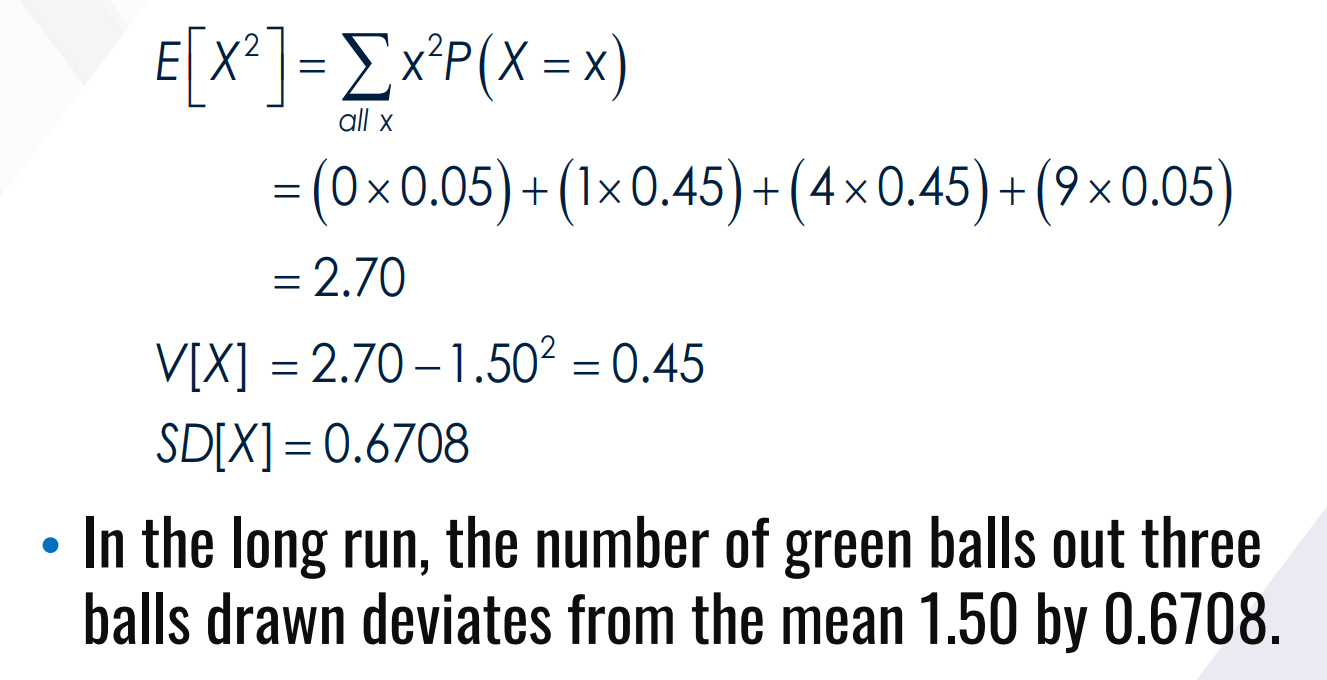
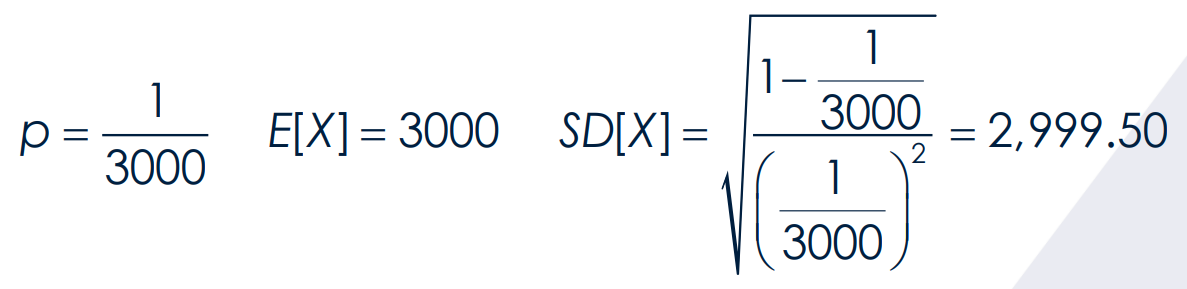
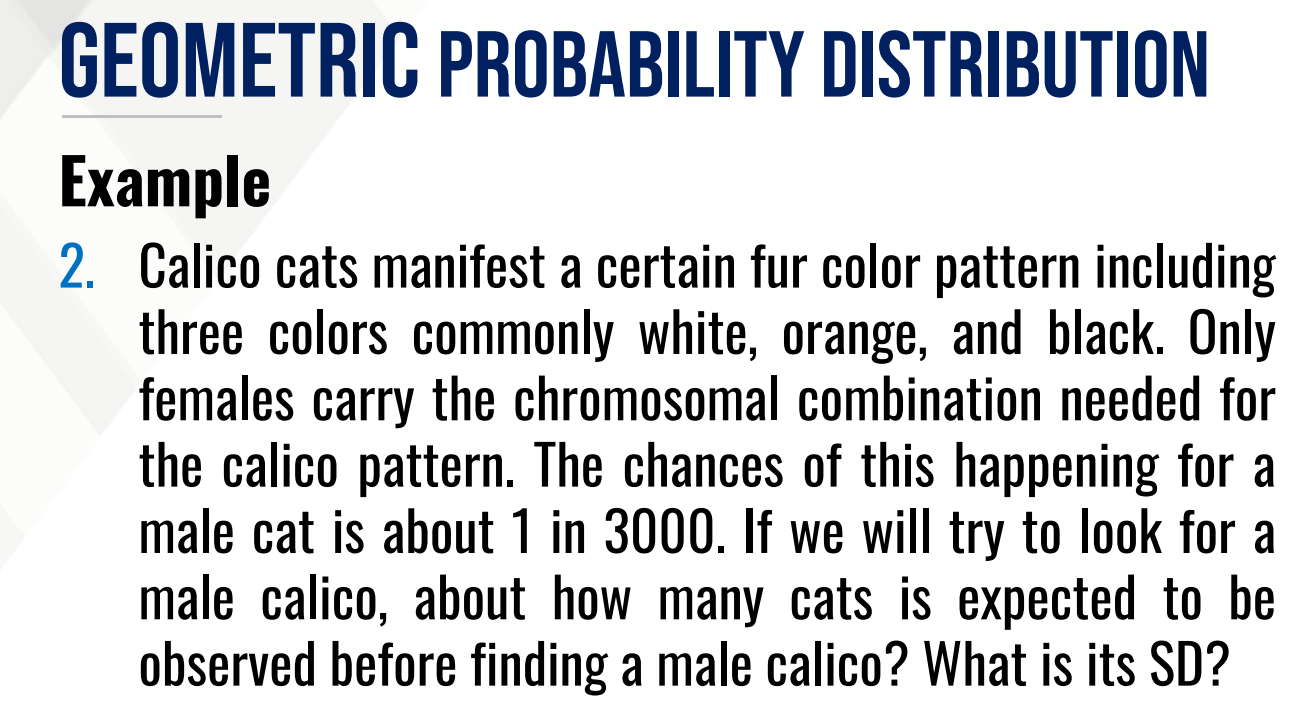
Given the following, CALCULATE the variance and INTERPRET:
A binomial random experiment is a probability experiment with the following features:
There is a fixed independent n trials.
Each trial has exactly two outcomes only, success and failure.
The probability of success is constant across trials.
A binomial random experiment is a probability experiment with the following features:
_______________________
_______________________
_______________________
number of success in n trials
The binomial random experiment yields the binomial random variable defined as the ________________.
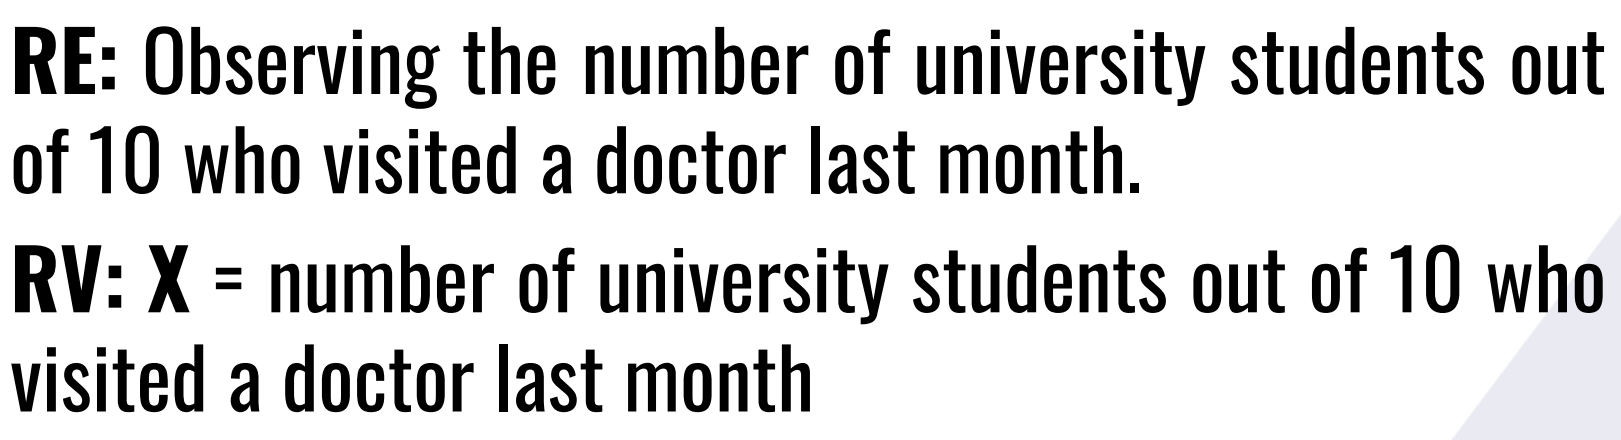
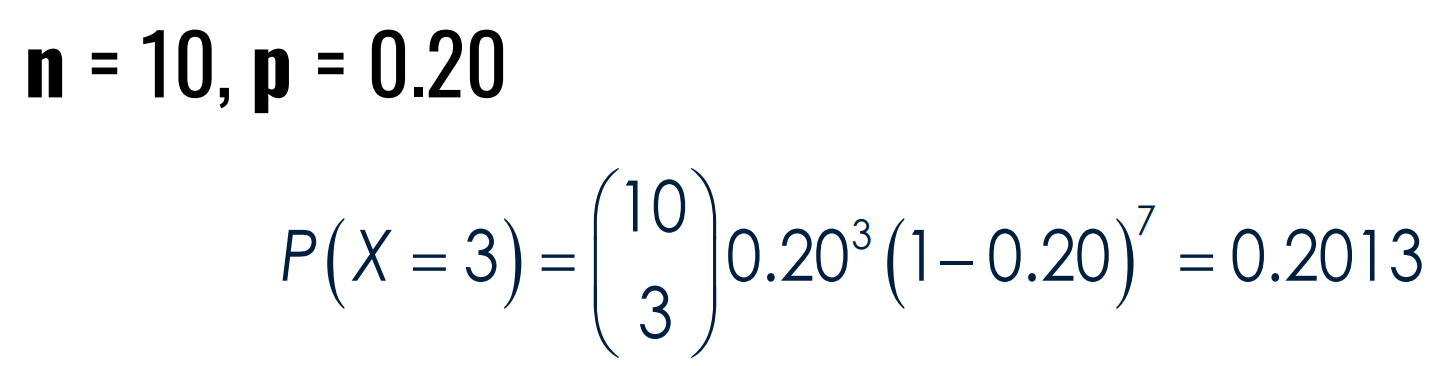
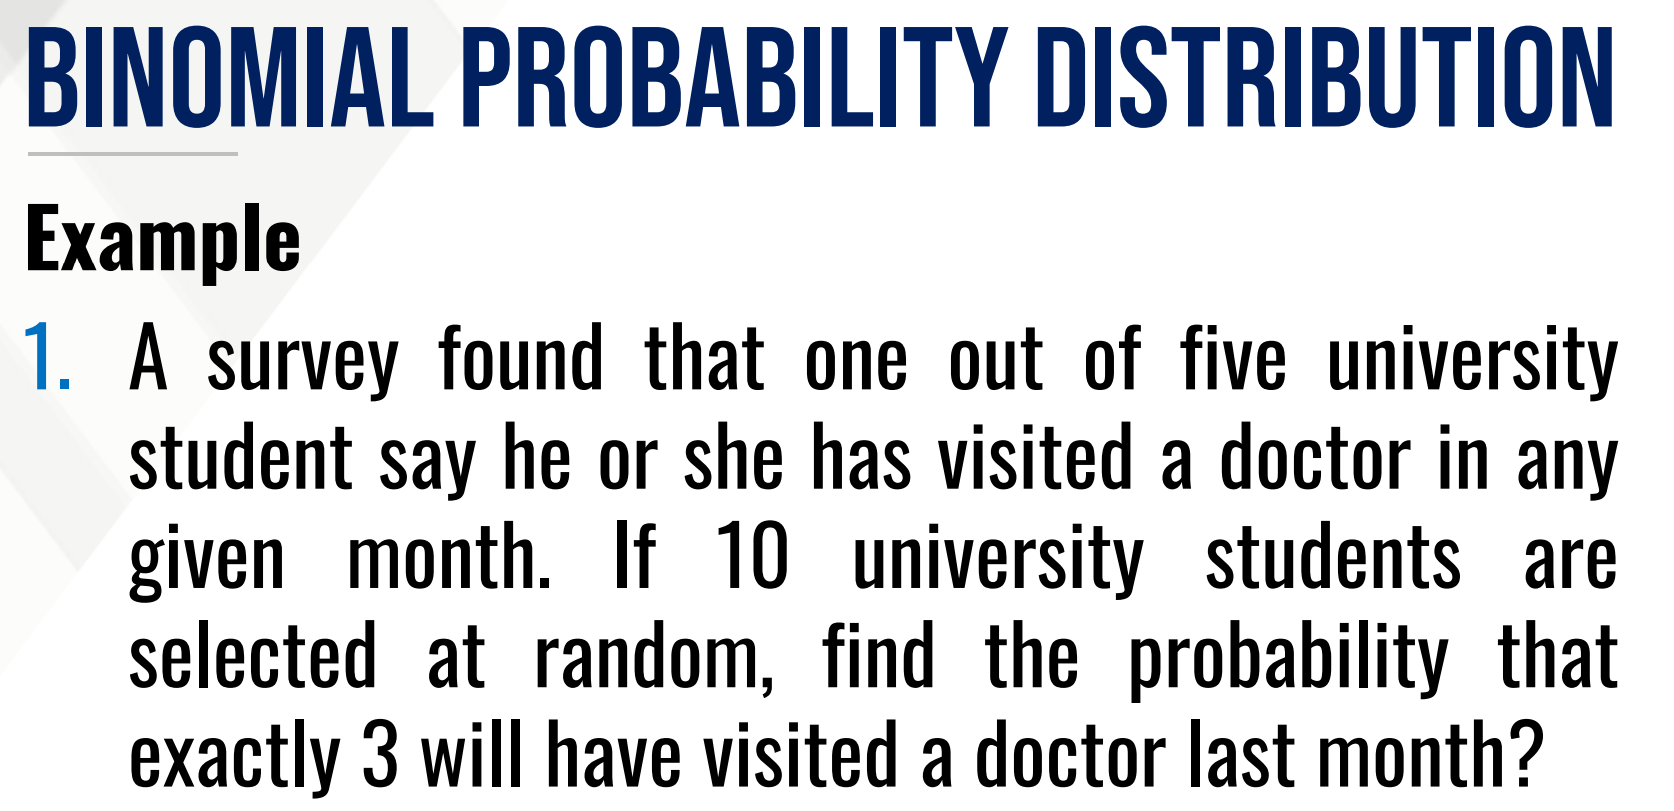
Find the random experiment, random variable, and the probability.
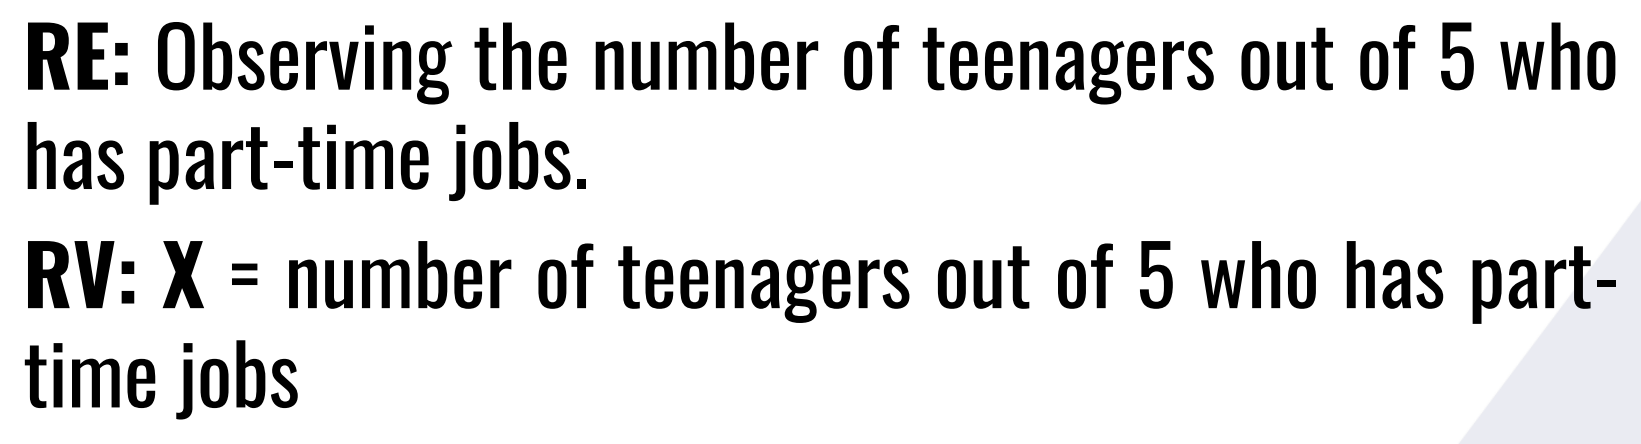
Find the random experiment, random variable, and the probability.
A multinomial random experiment is a probability experiment with the following features:
There is a fixed independent n trials.
Each trial has at least two outcomes.
The probability for each outcome occurring is constant across trials.
A multinomial random experiment is a probability experiment with the following features:
___________________
___________________
___________________
number of successes of each outcome in n trials
The experiment yields the multinomial random variable defined as the ___________________.
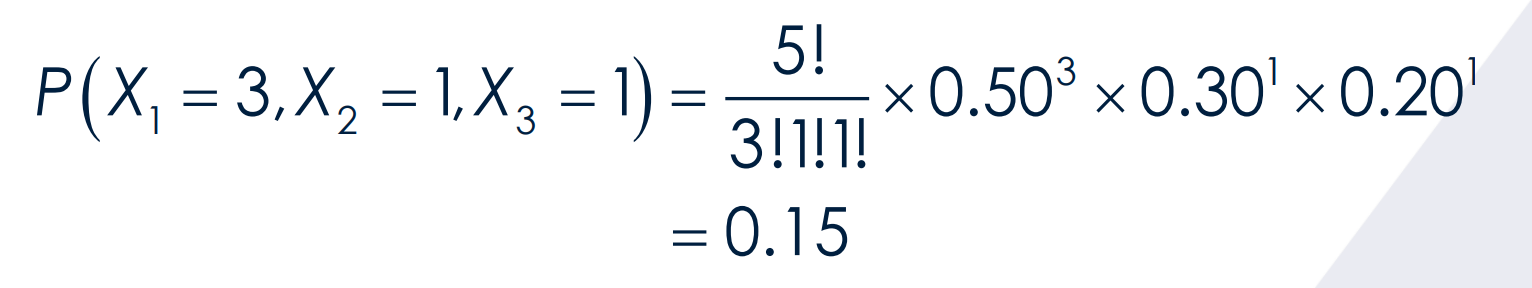
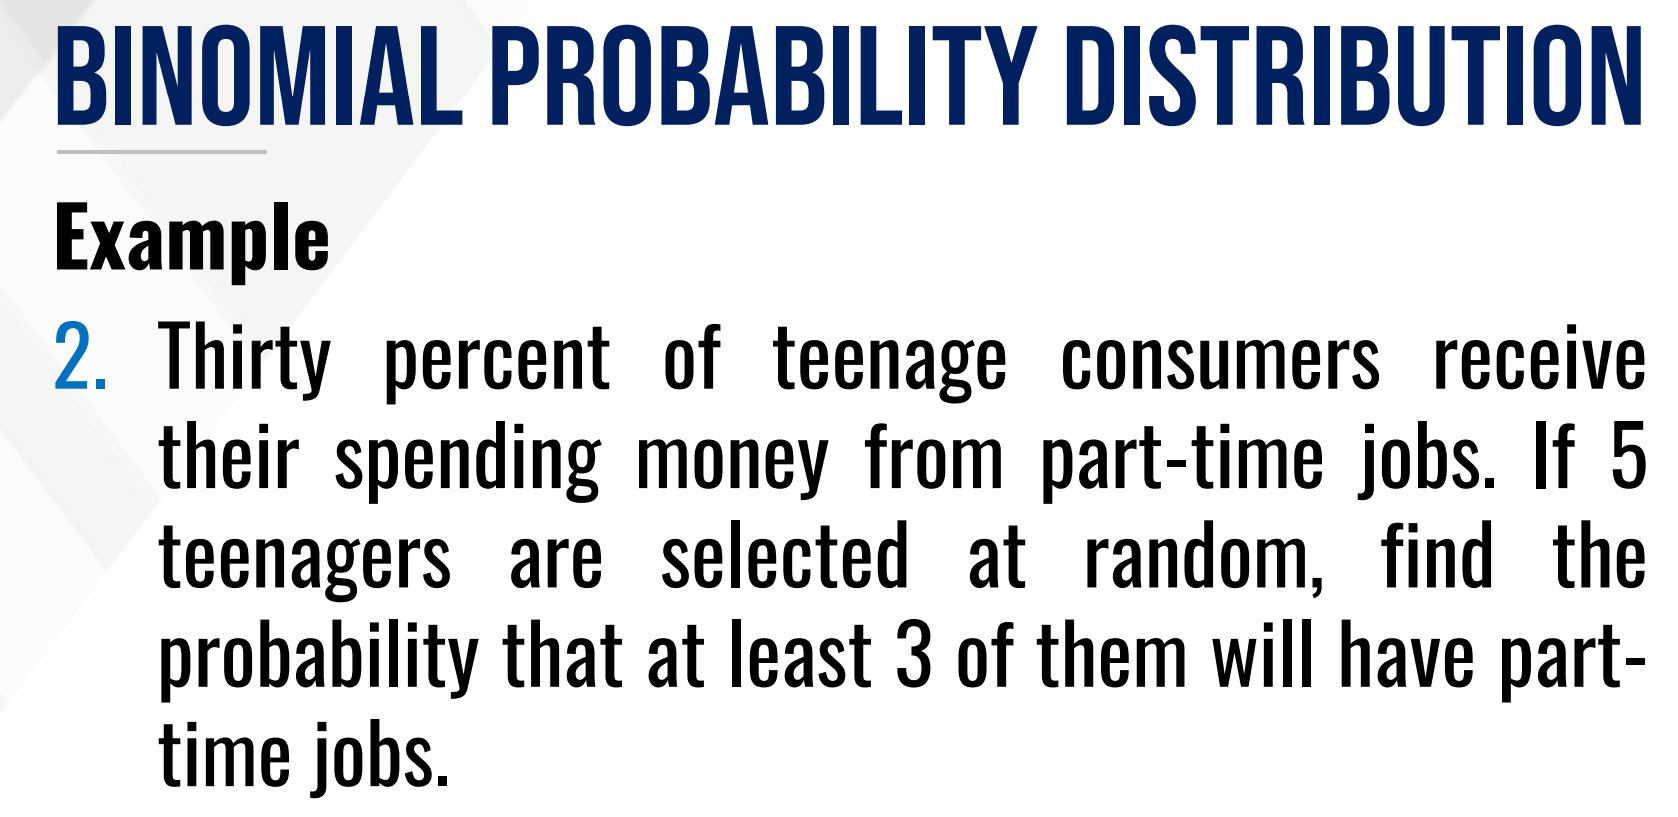
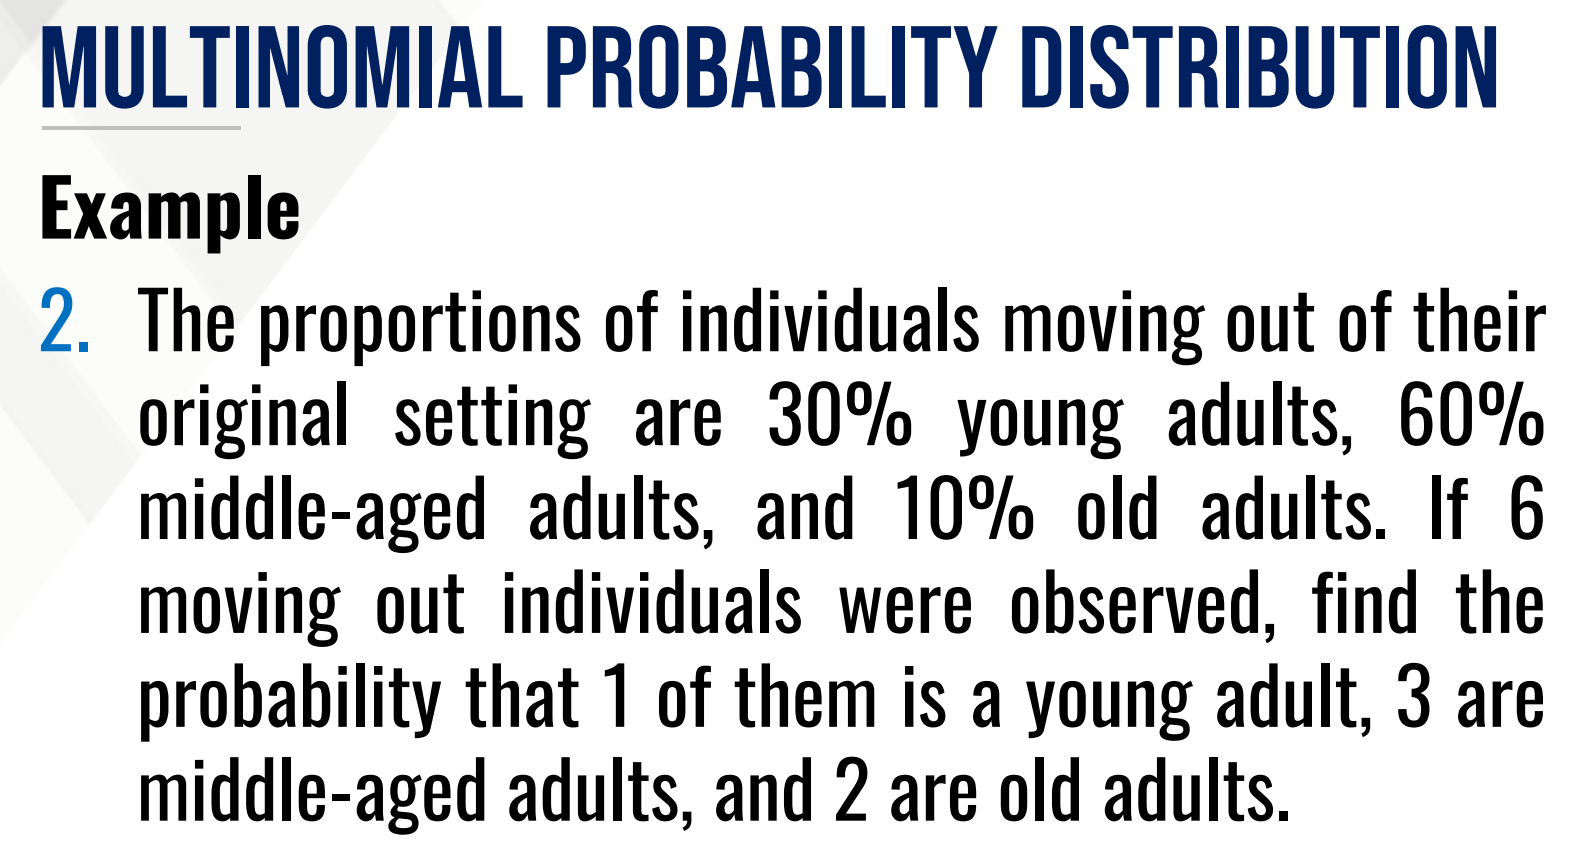
Find the probability.
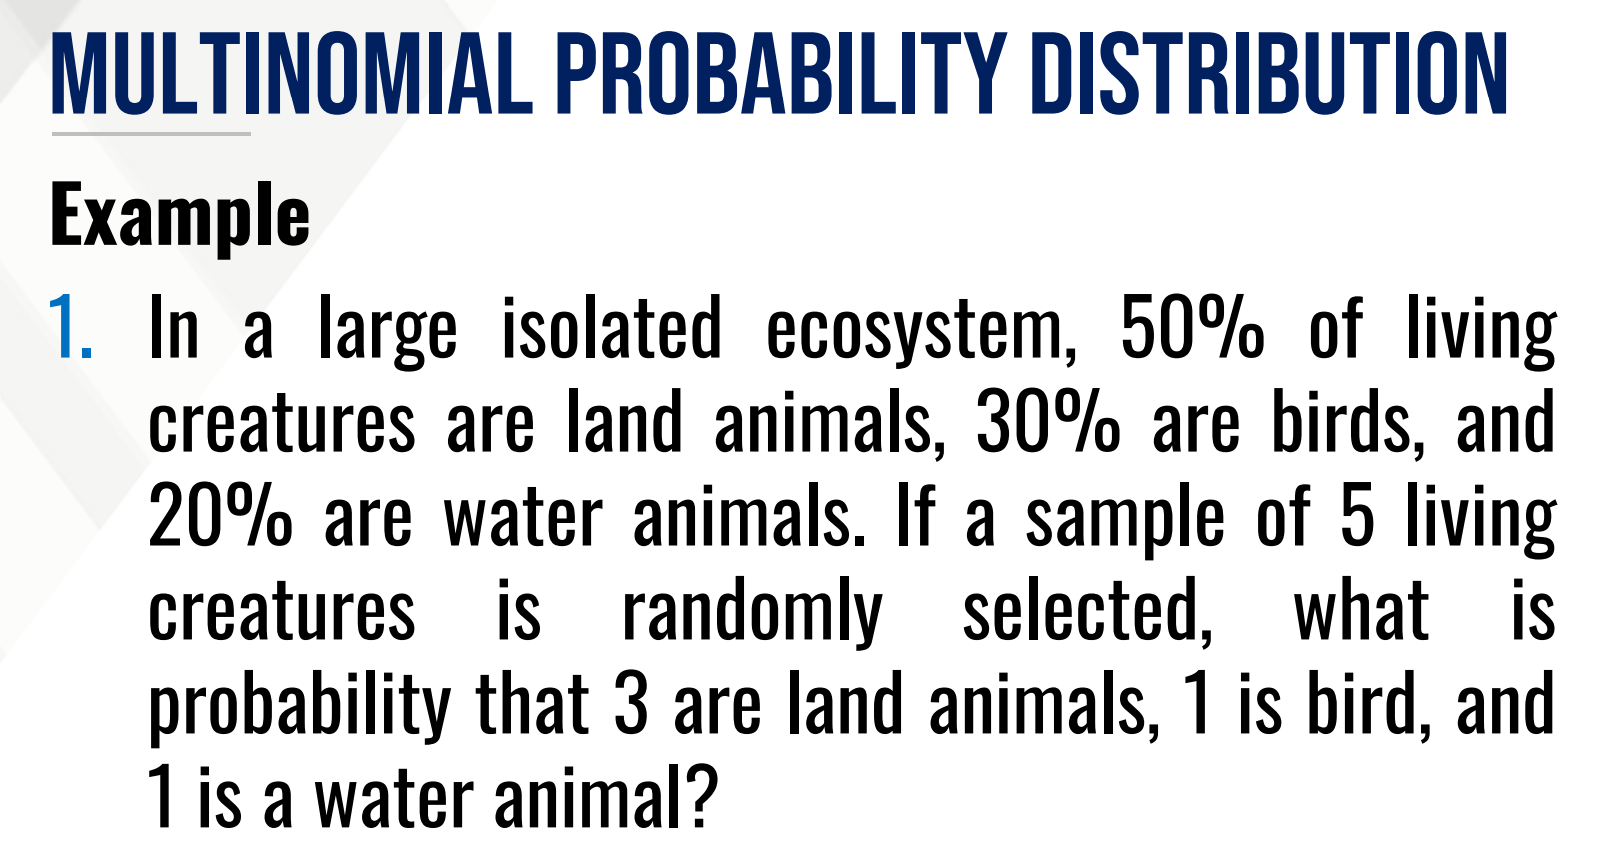
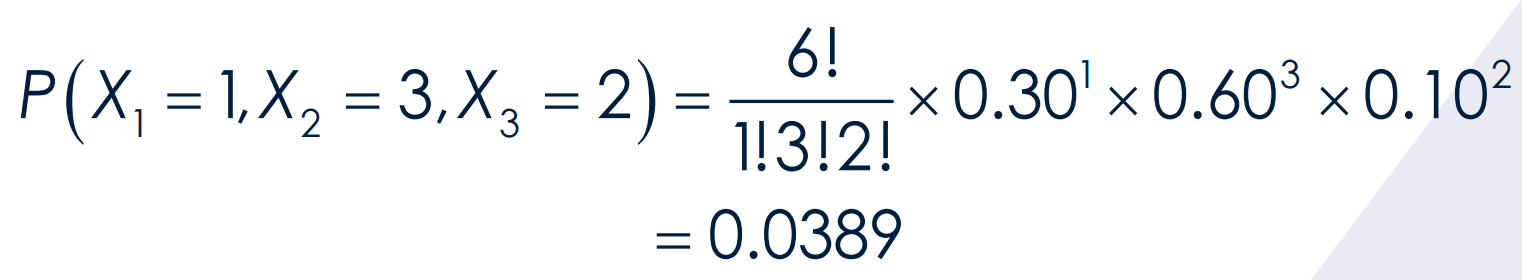
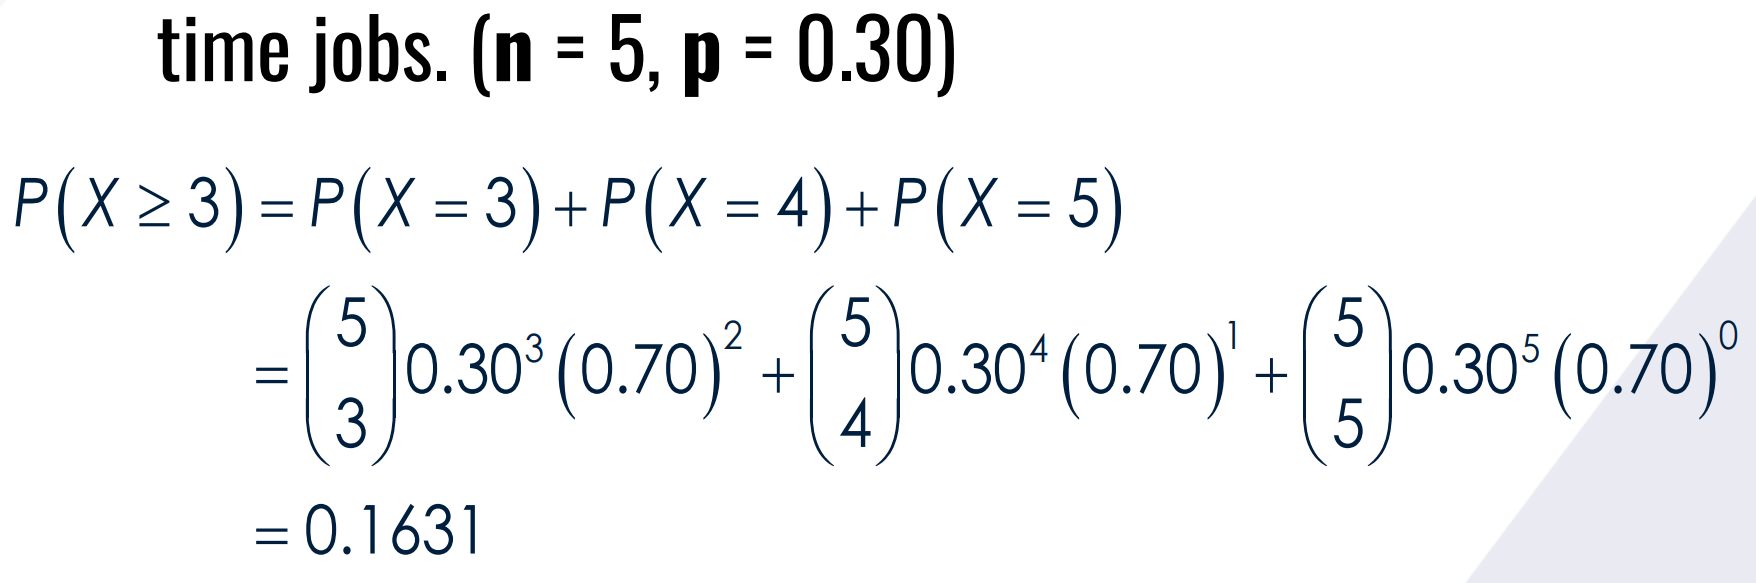
Find the probability.
geometric random experiment
A __________________ is a probability experiment of counting the number of trials before achieving the first success in a sequence of independent trials.
GEOMETRIC PROBABILITY DISTRIBUTION
Similar to binomial, it has a series of independent trials each with two possible outcomes and a constant probability of success.
geometric random variable
The experiment yields the _______________ defined as the number of trials before achieving the first success
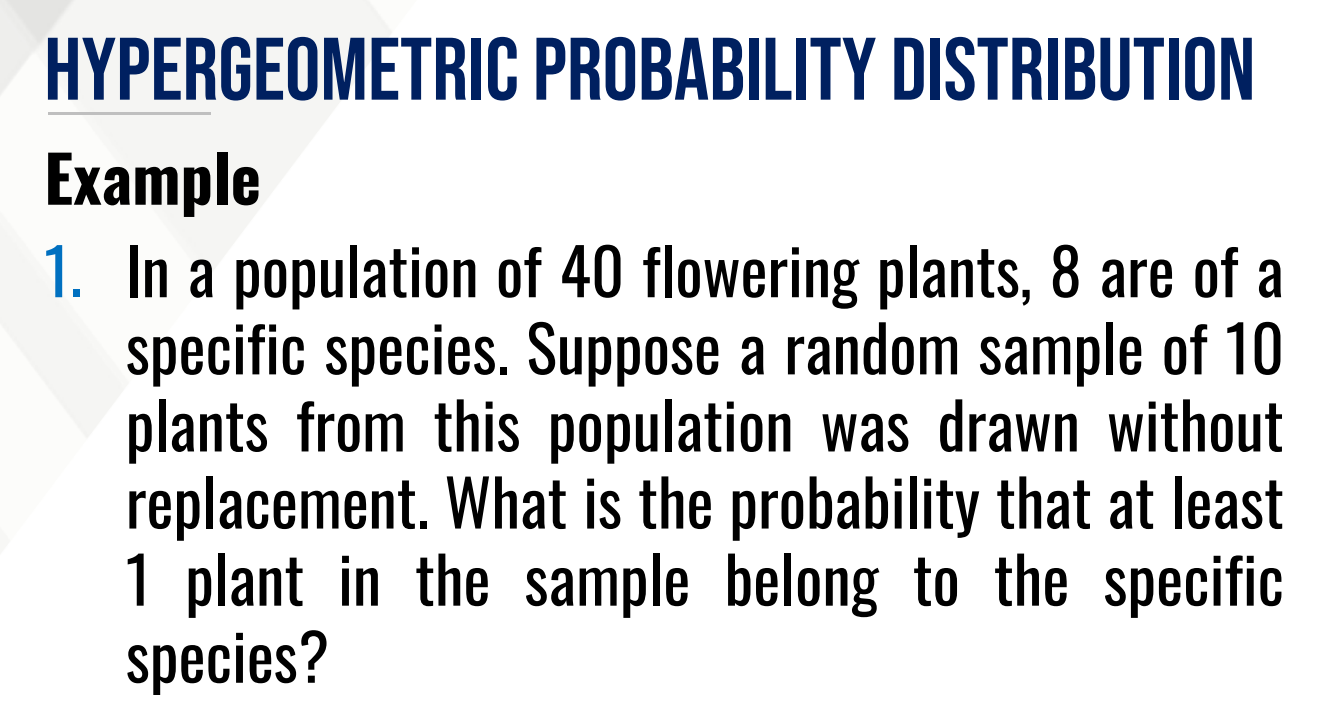
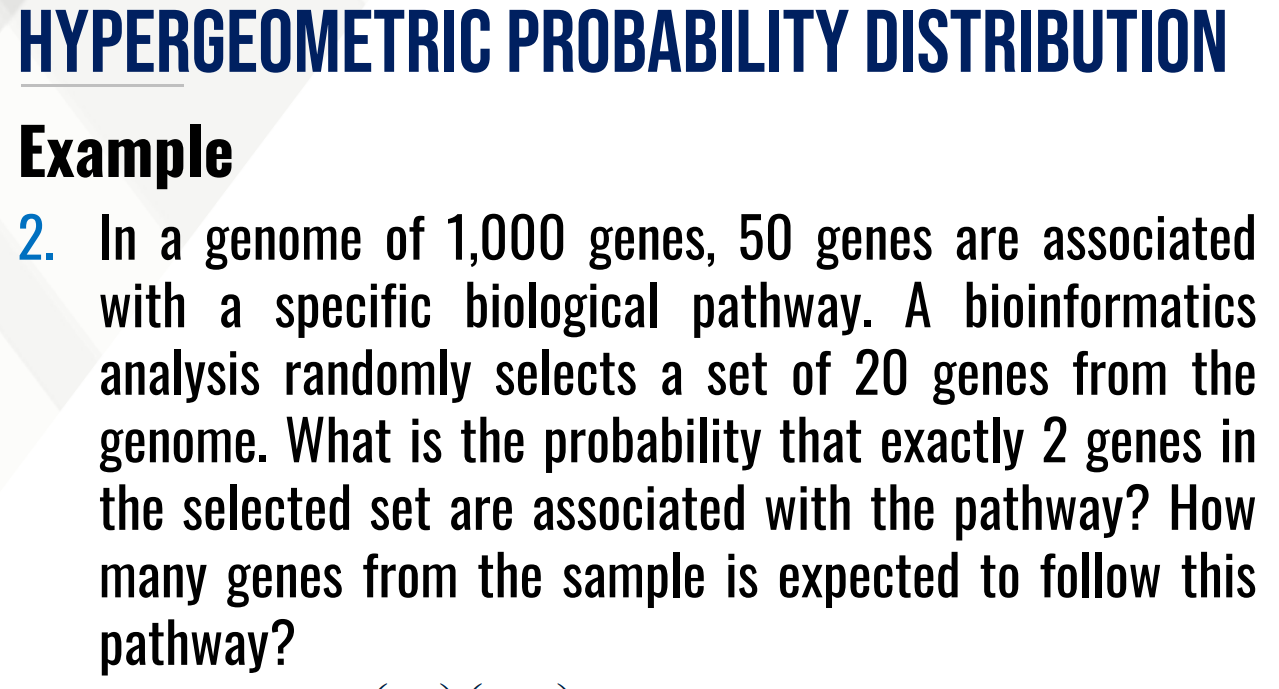
hypergeometric random experiment
A _____________ is a probability experiment of counting the number of events or occurrences in a sample drawn without replacement from a finite population.
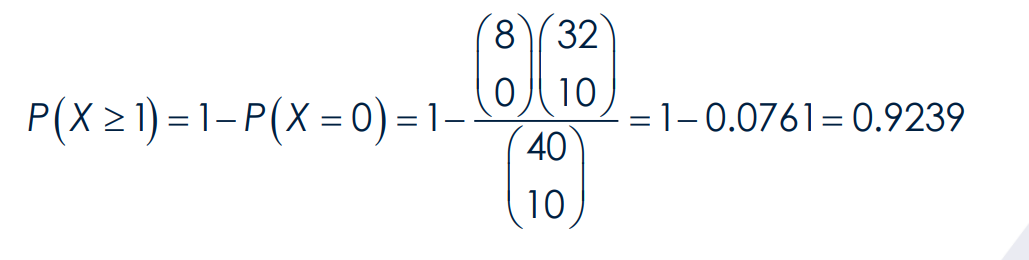
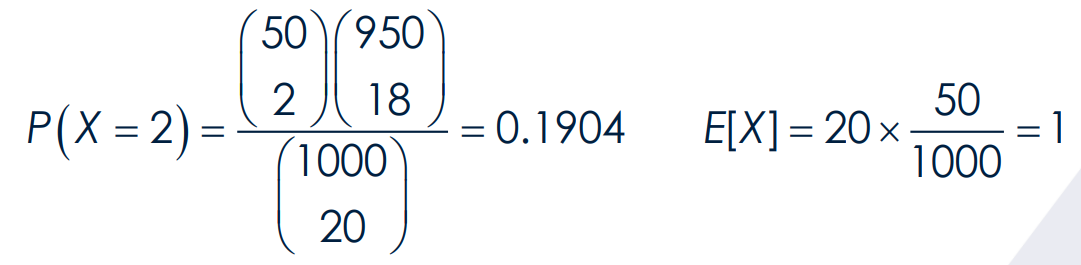
HYPERGEOMETRIC PROBABILITY DISTRIBUTION
Each sample drawn affects the probability of subsequent selections, hence p is not constant.
hypergeometric random variable
The experiment yields the ________________ defined as the number of occurrences in a sample drawn without replacement from N objects.
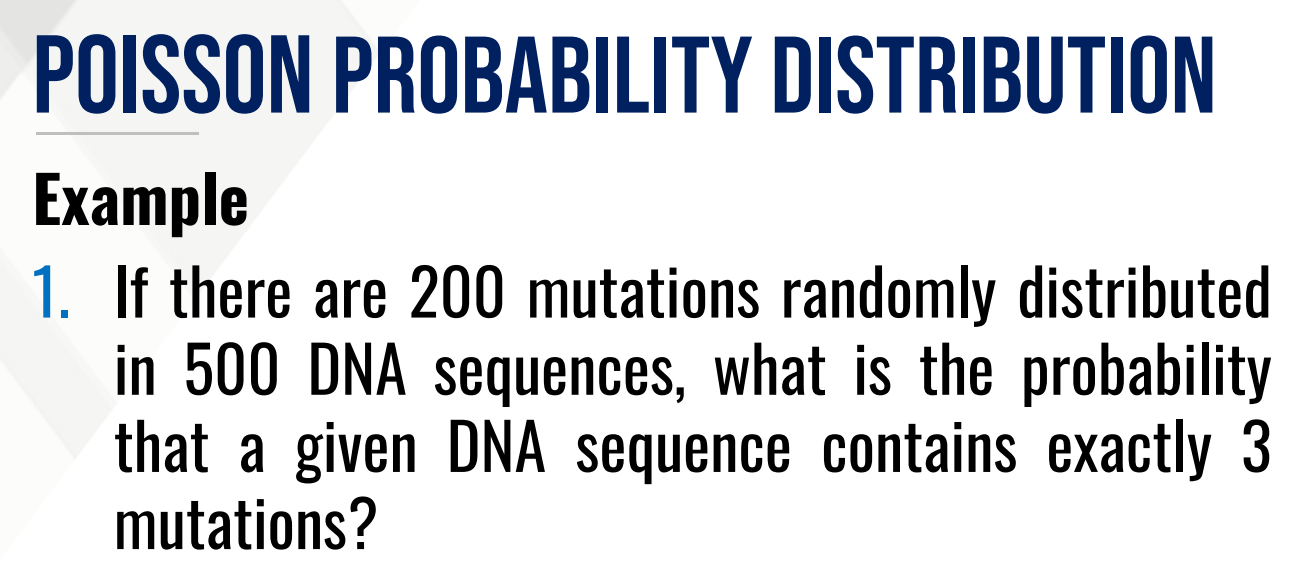
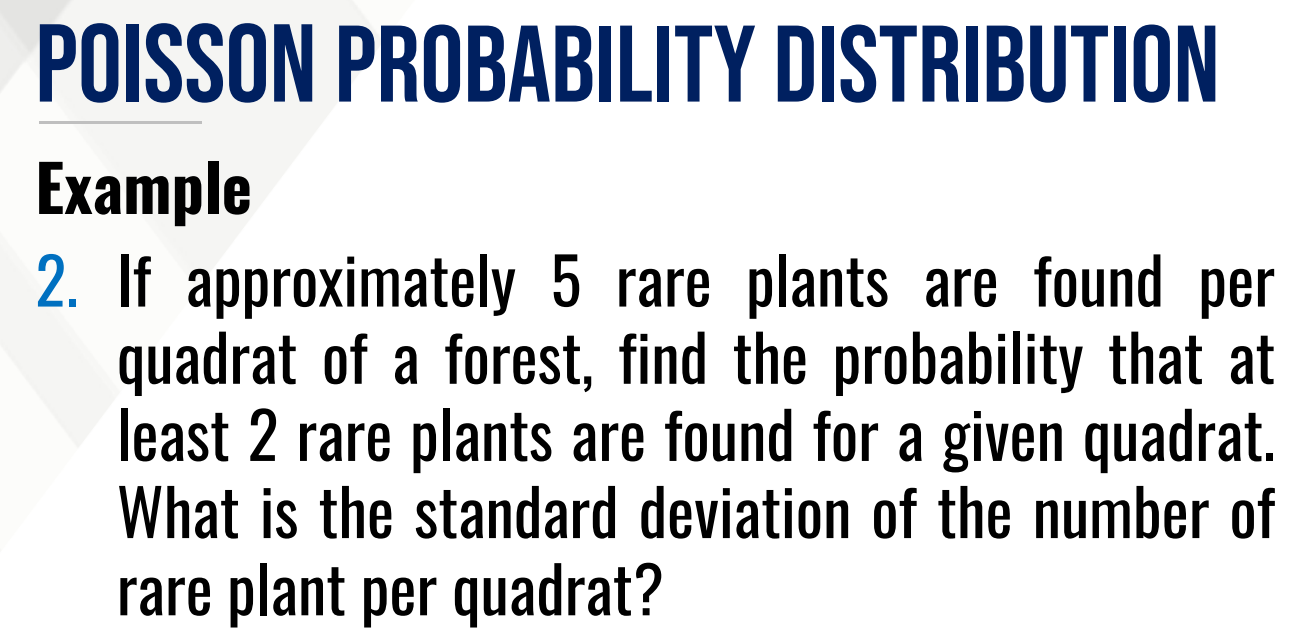
poisson random experiment
A _______________ is a probability experiment of counting the number of events or occurrences within a fixed interval of time or space.
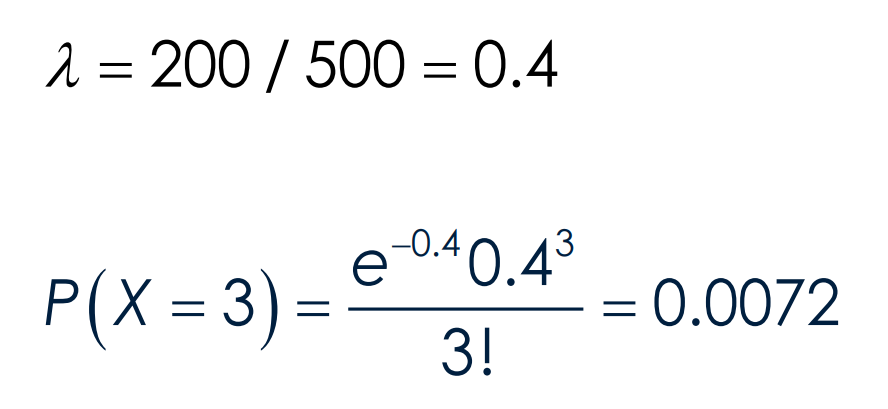
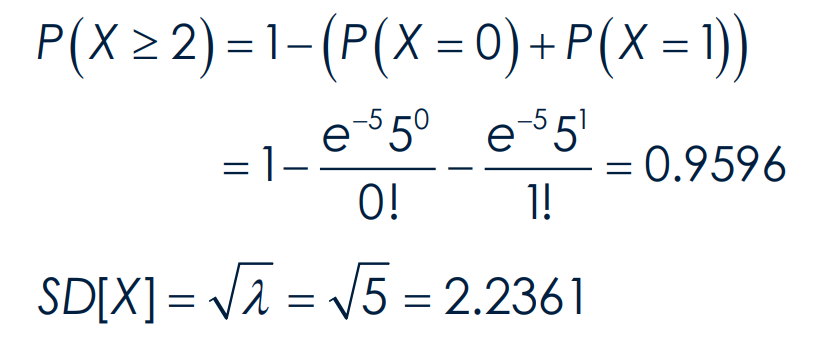
POISSON PROBABILITY DISTRIBUTION
Used specifically for large number of trials but with small probability of success. Hence, usually associated to rare events.
poisson random variable
The experiment yields the ______________ defined as the number of occurrences in an interval of time or space.
normal random variable
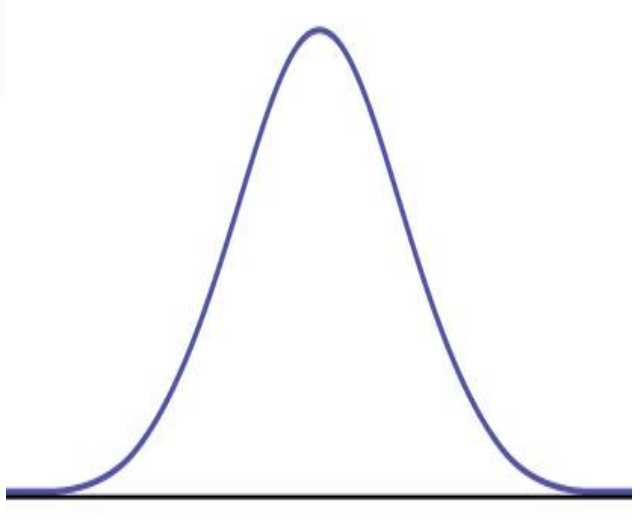
A continuous random variable X is said to be a _____________ if its distribution resembles this shape
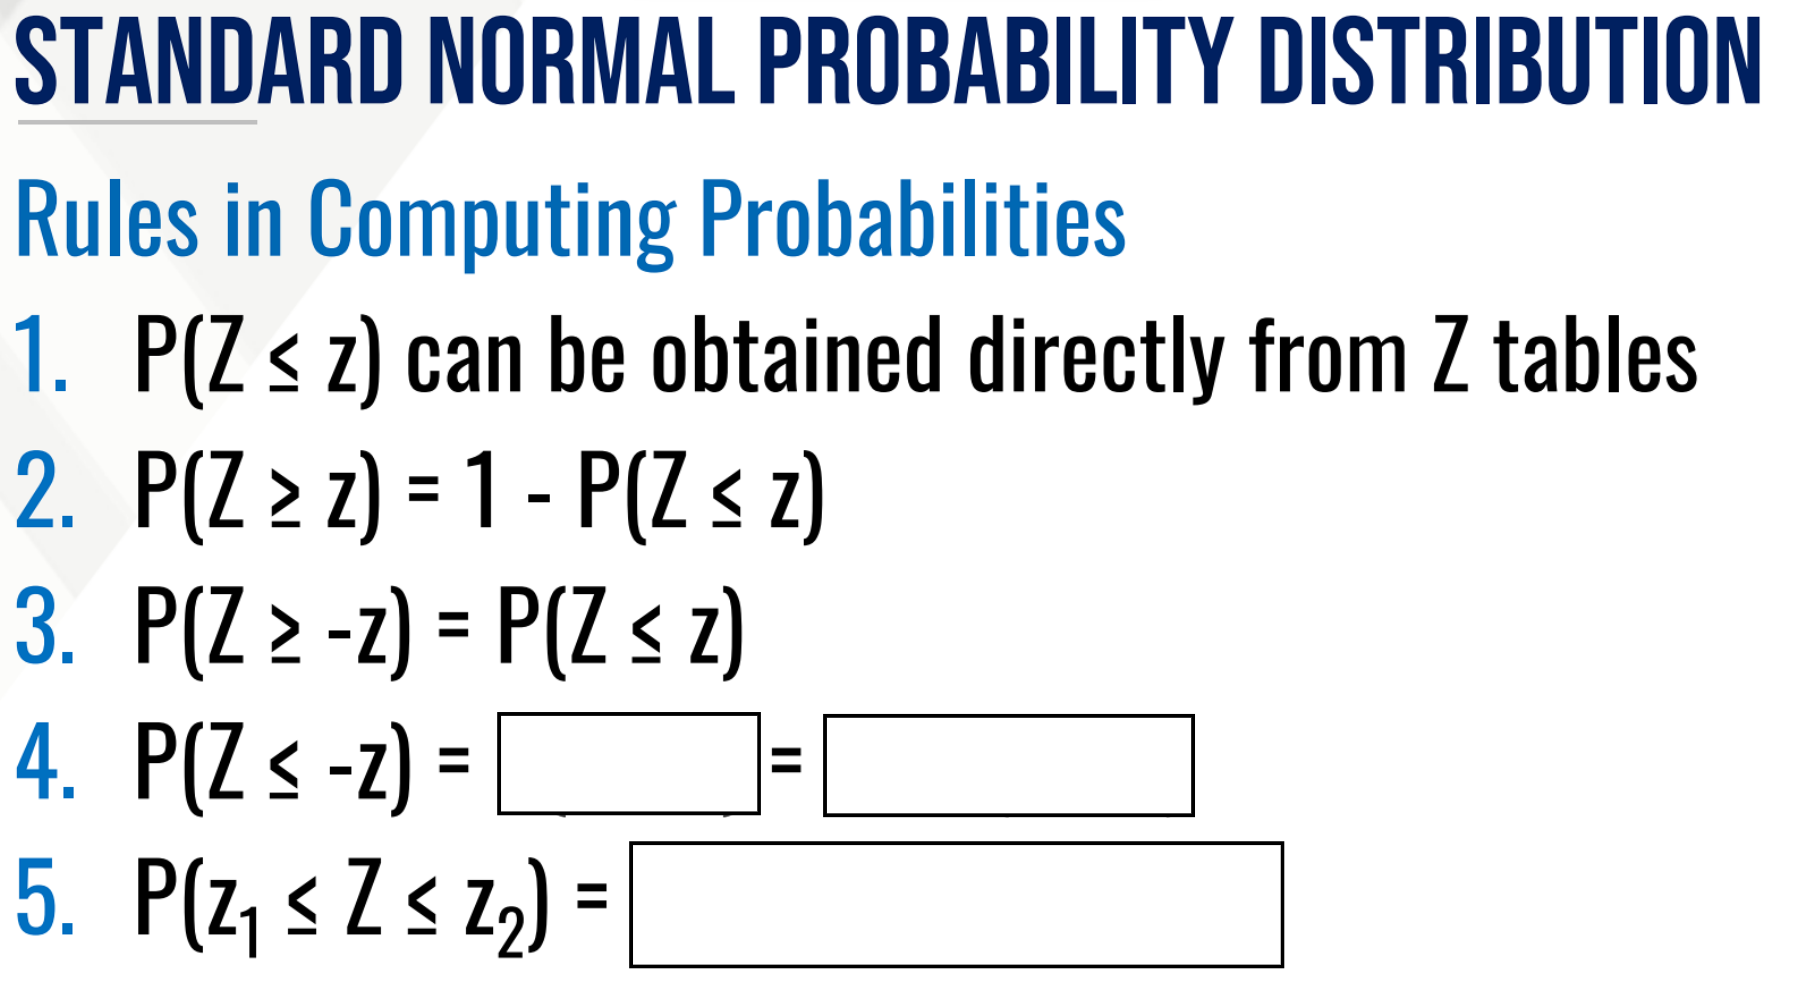
NORMAL PROBABILITY DISTRIBUTION
Mean = Median = Mode
NORMAL PROBABILITY DISTRIBUTION
Symmetric about the mean
50% of the values are less than the mean and 50% are greater than the mean
normal curve
The graphical form of the NORMAL PROBABILITY distribution is commonly called as the ____________.
Properties of a Normal Curve
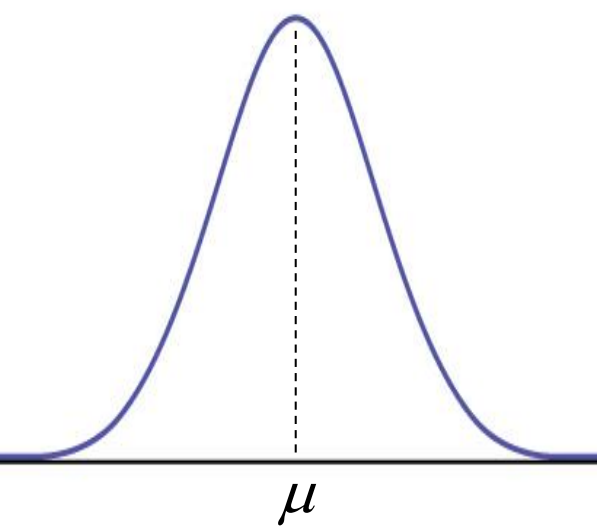
It is bell-shaped and unimodal.
The total area under the curve is 1
Properties of a Normal Curve
It is symmetric at X = μ
It is asymptotic to the X-axis.
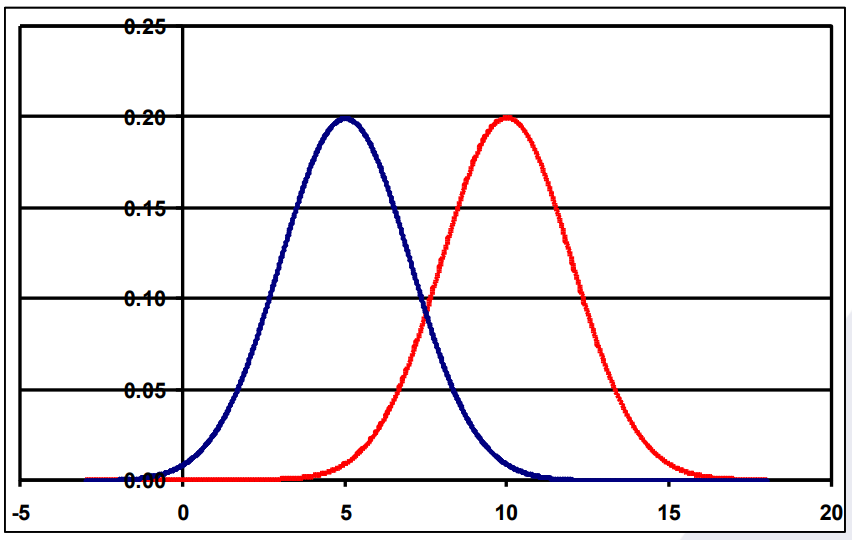
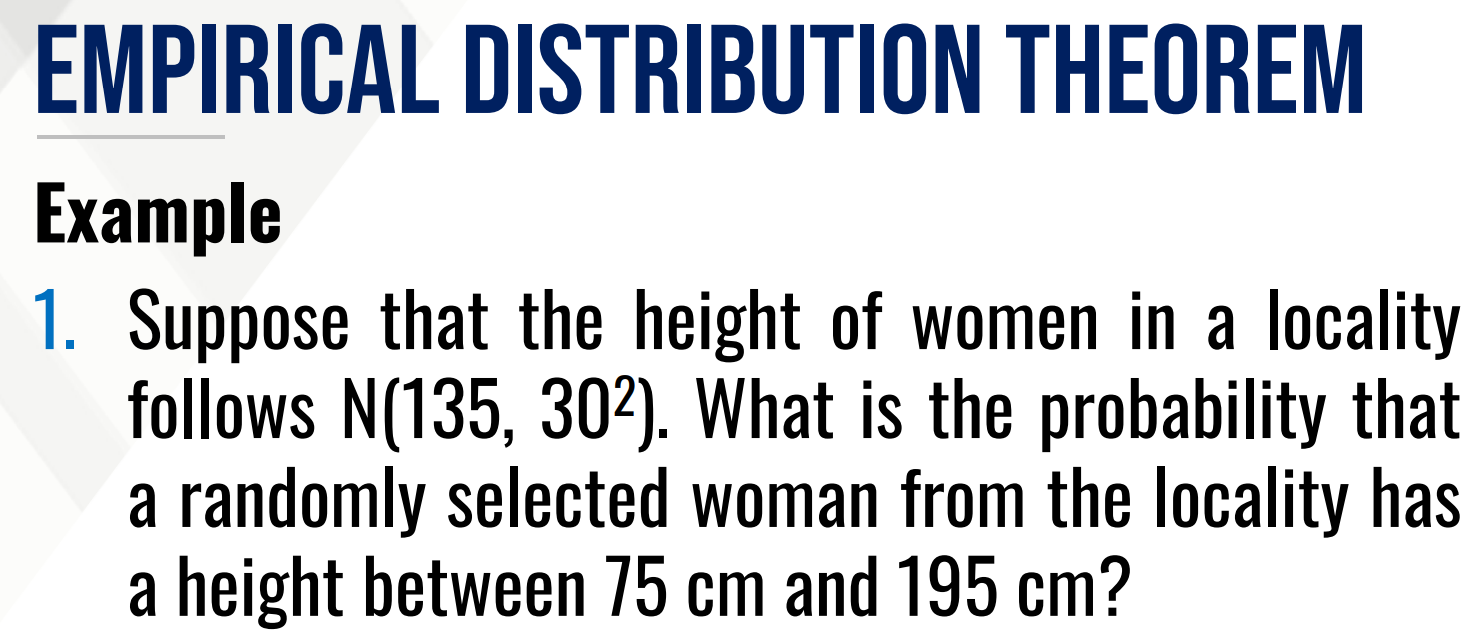
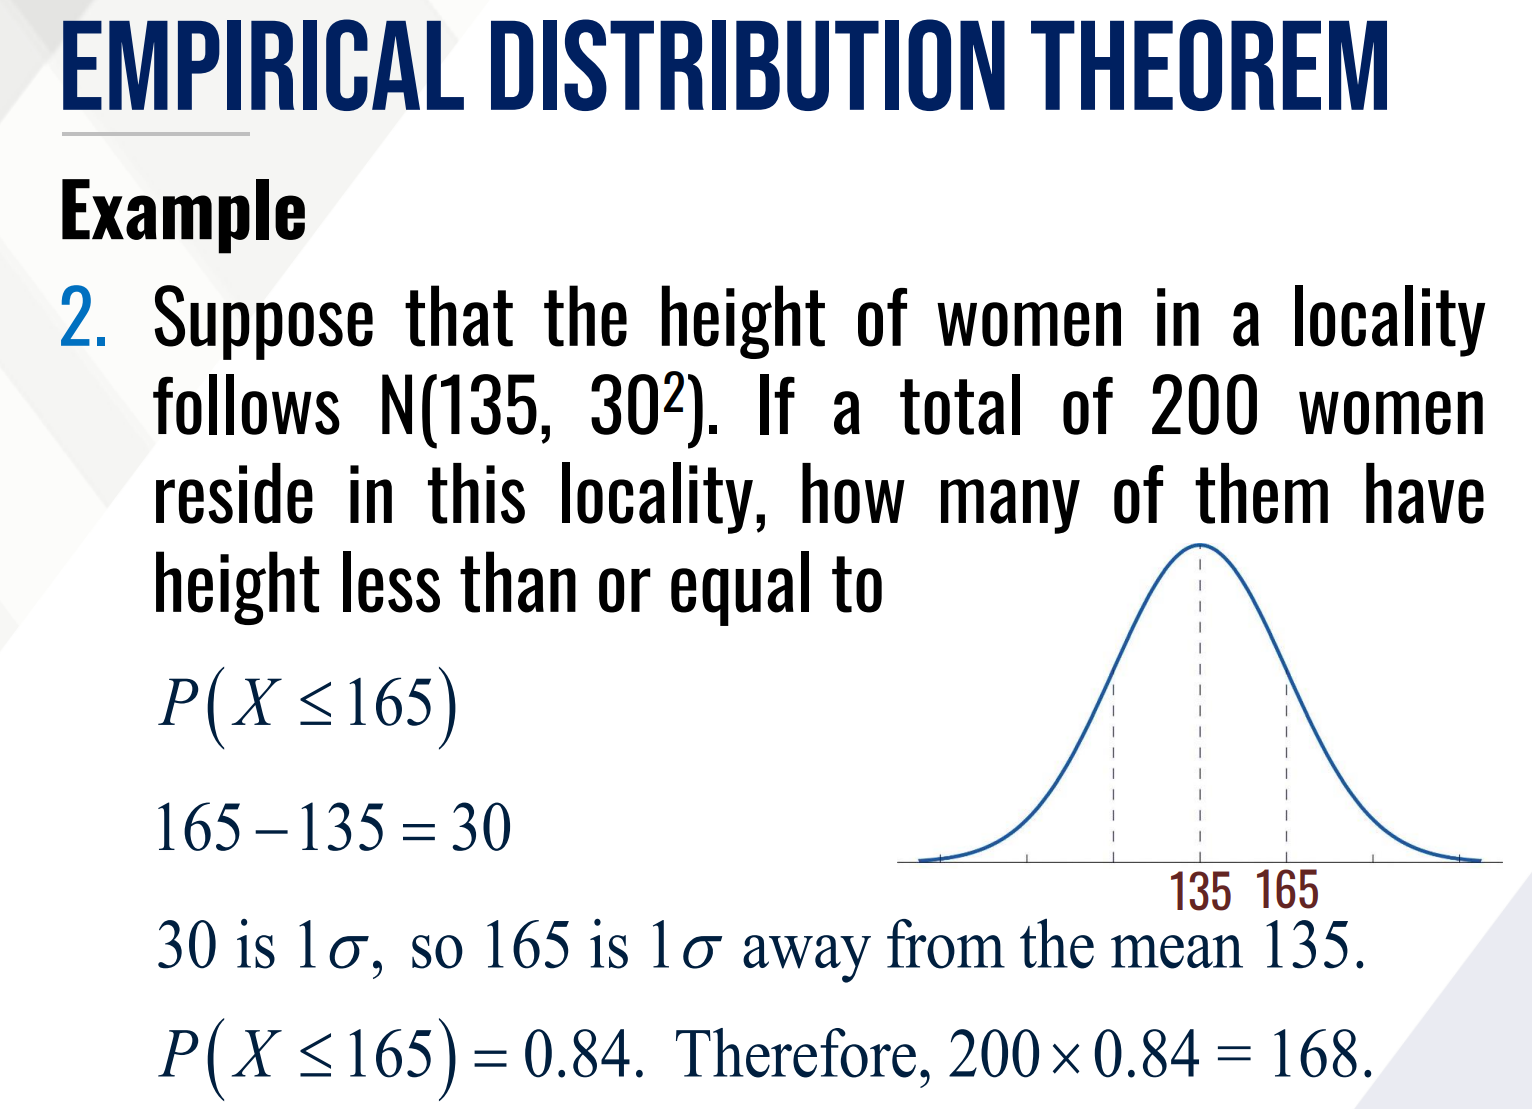
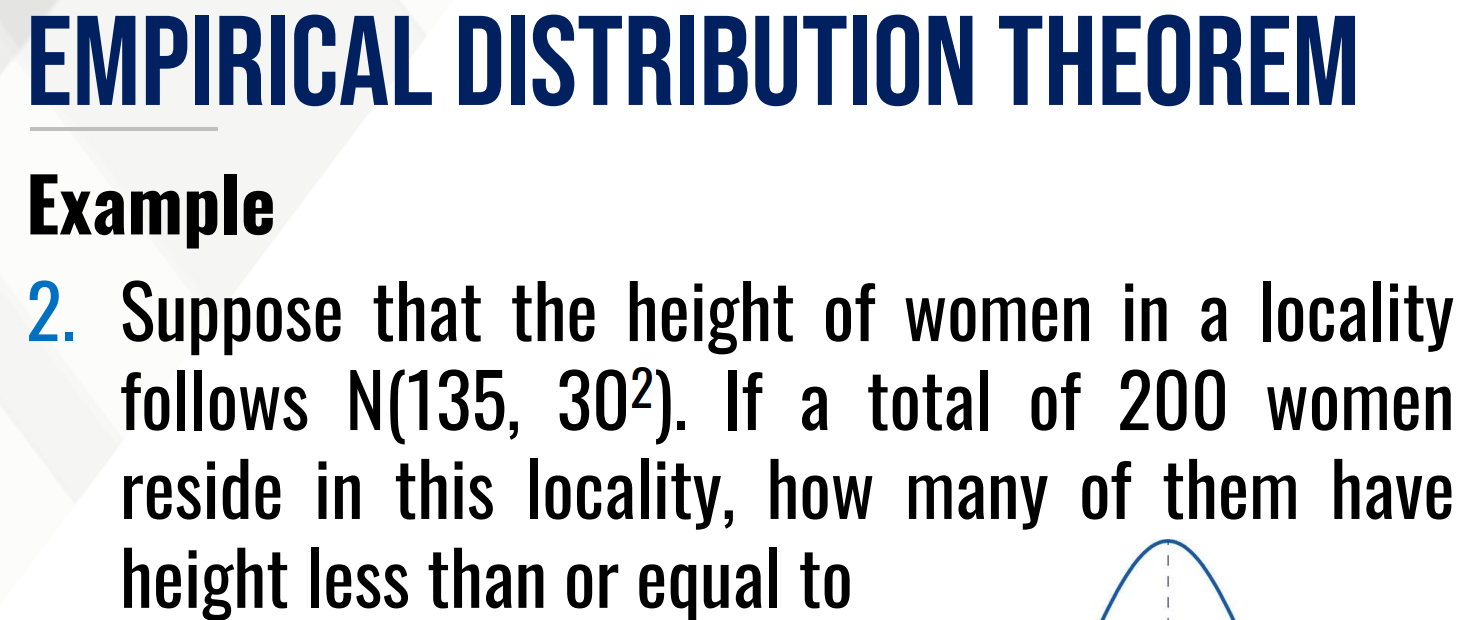
Interpret:
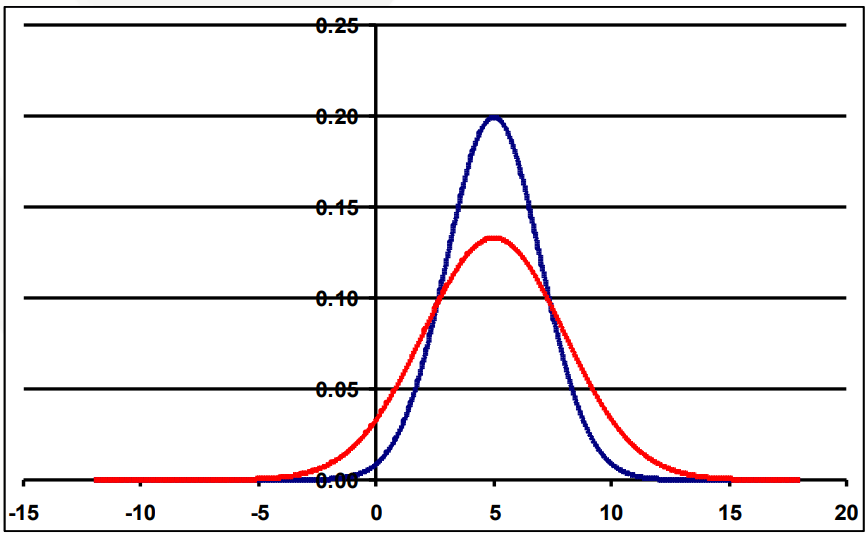
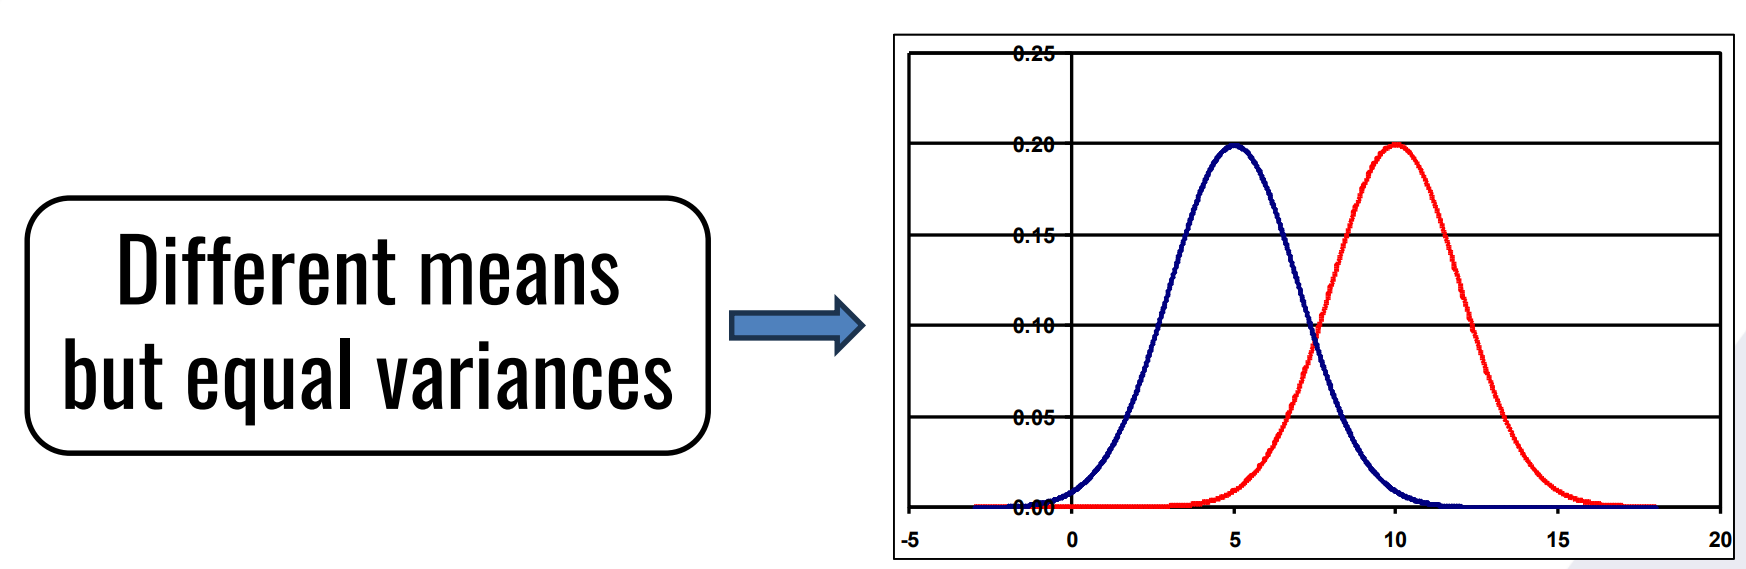
Interpret:
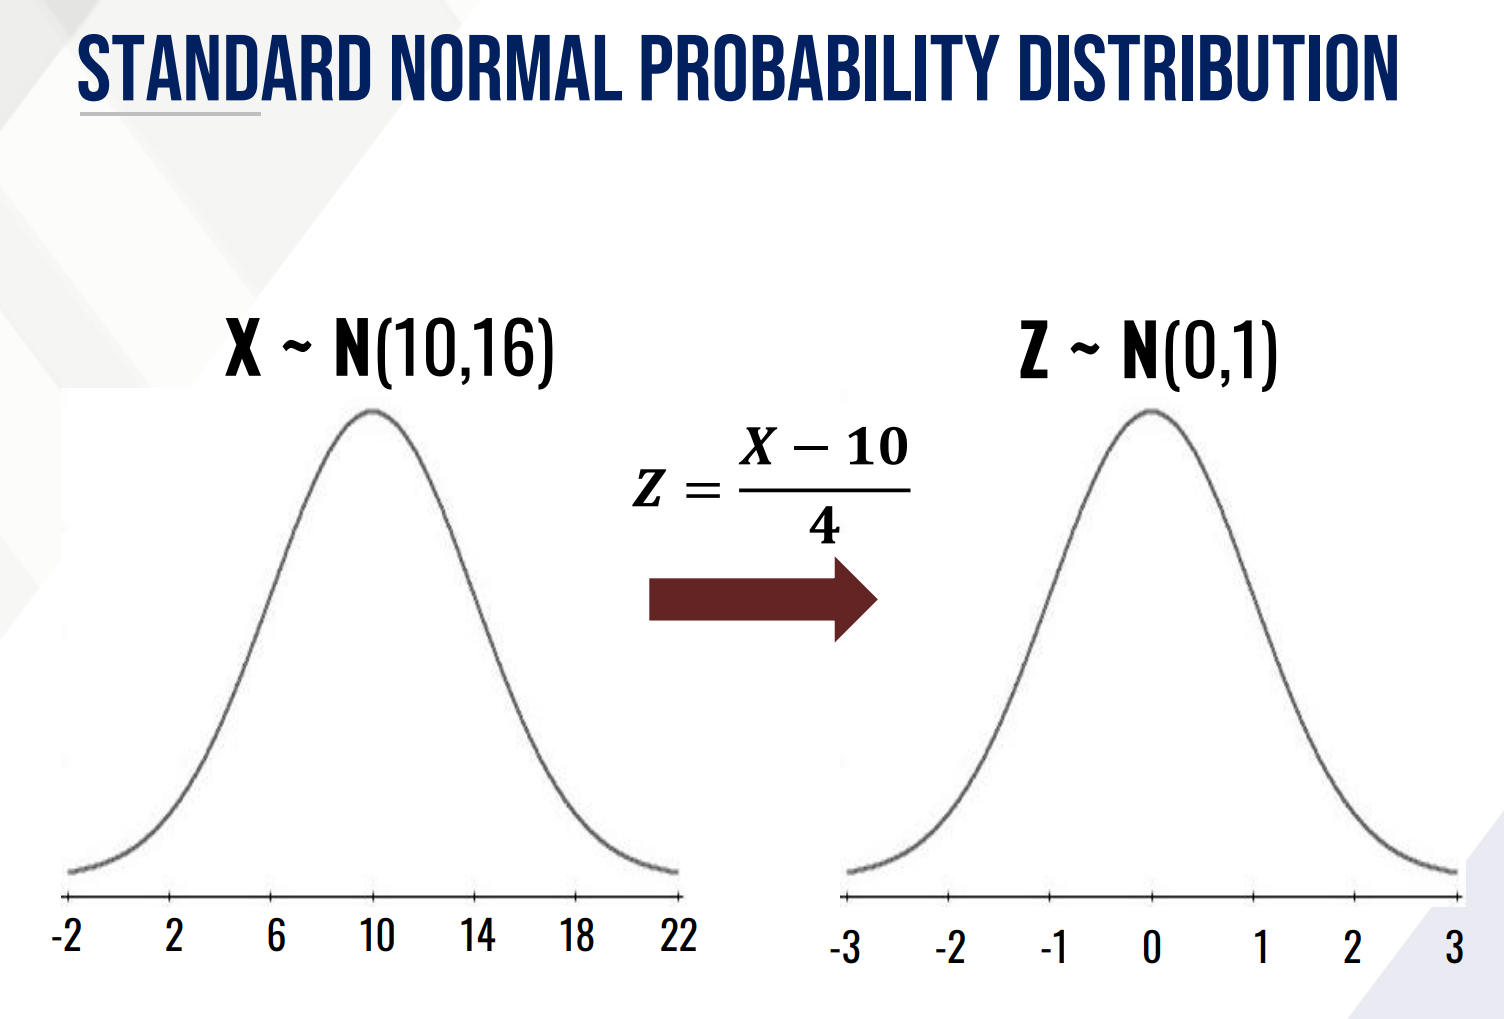
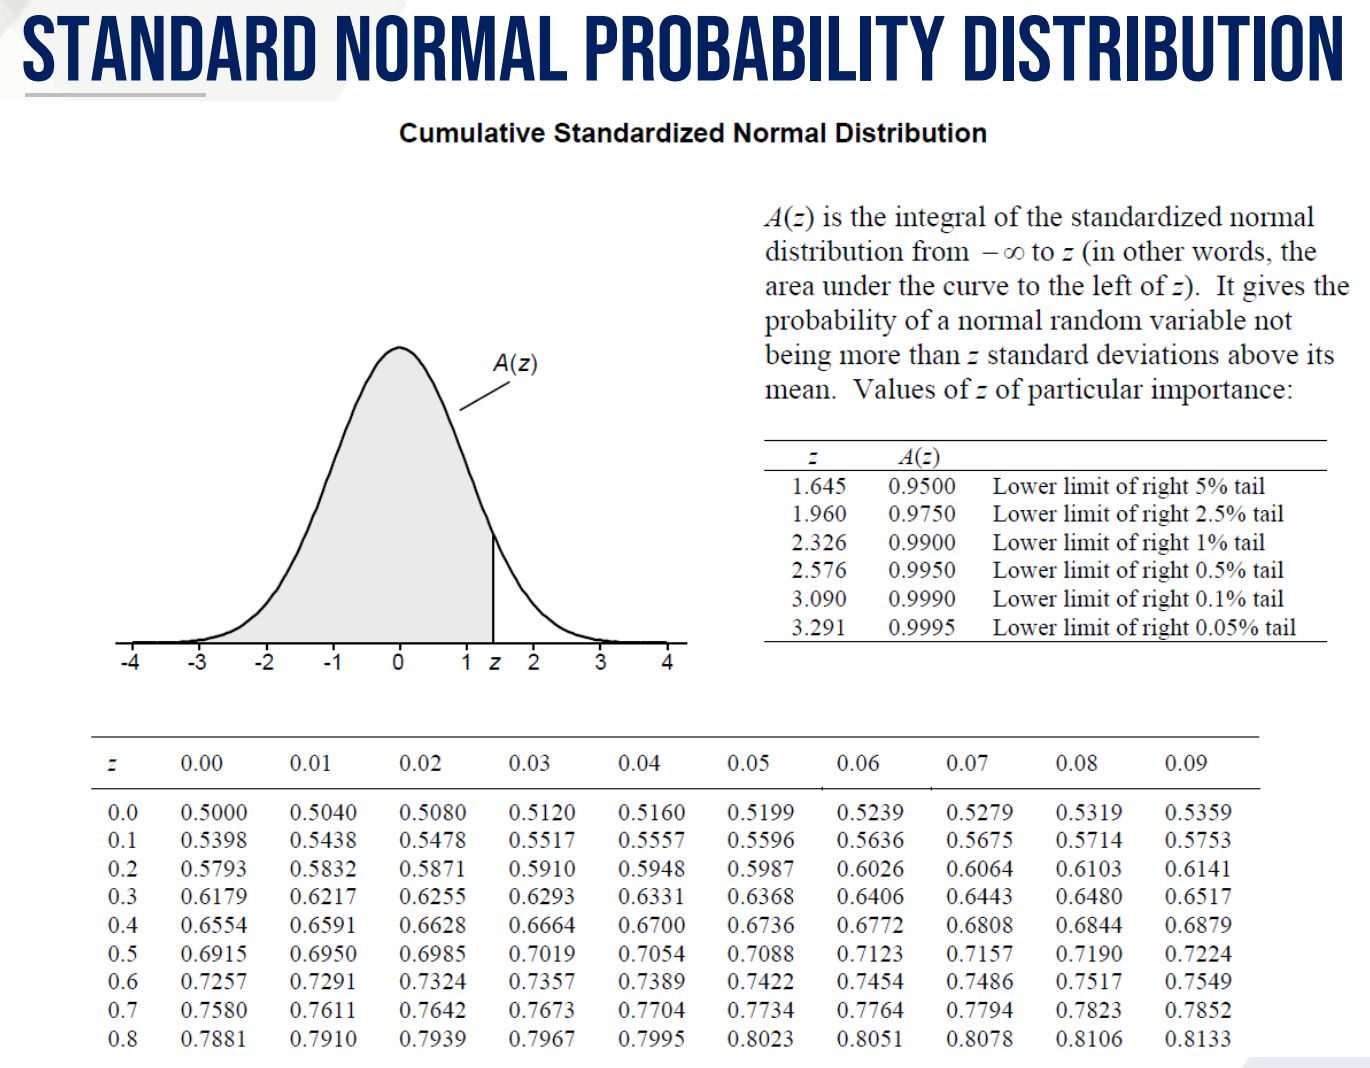
standard normal random variable
A continuous random variable X is said to be a __________________ if it follows the normal distribution with mean 0 and variance 1.
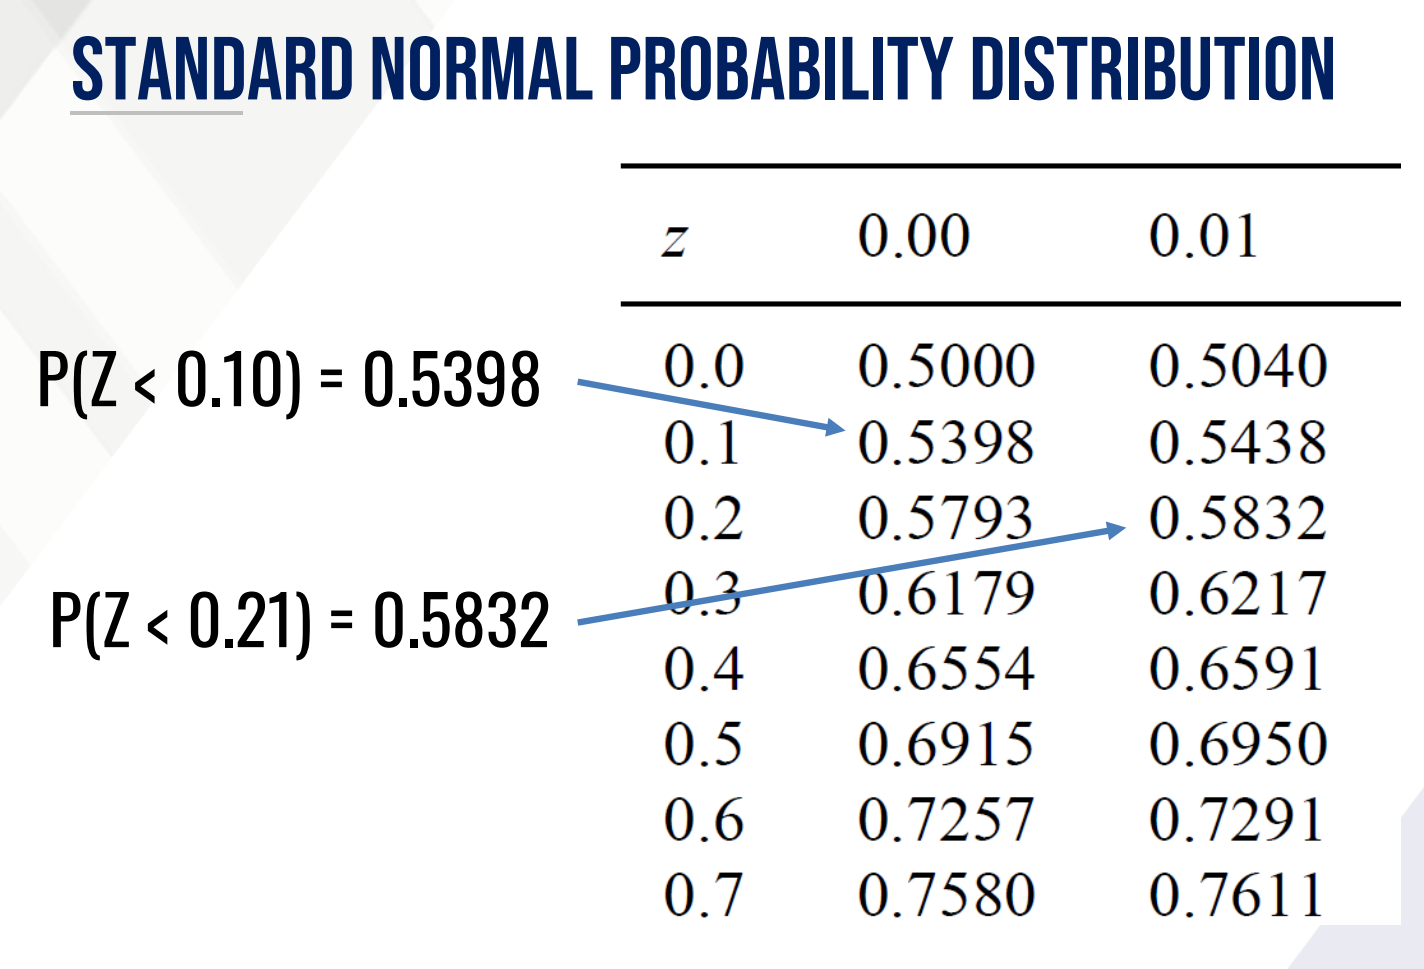
Using the z-score table find P(Z < 0.10) and P(Z < 0.21)
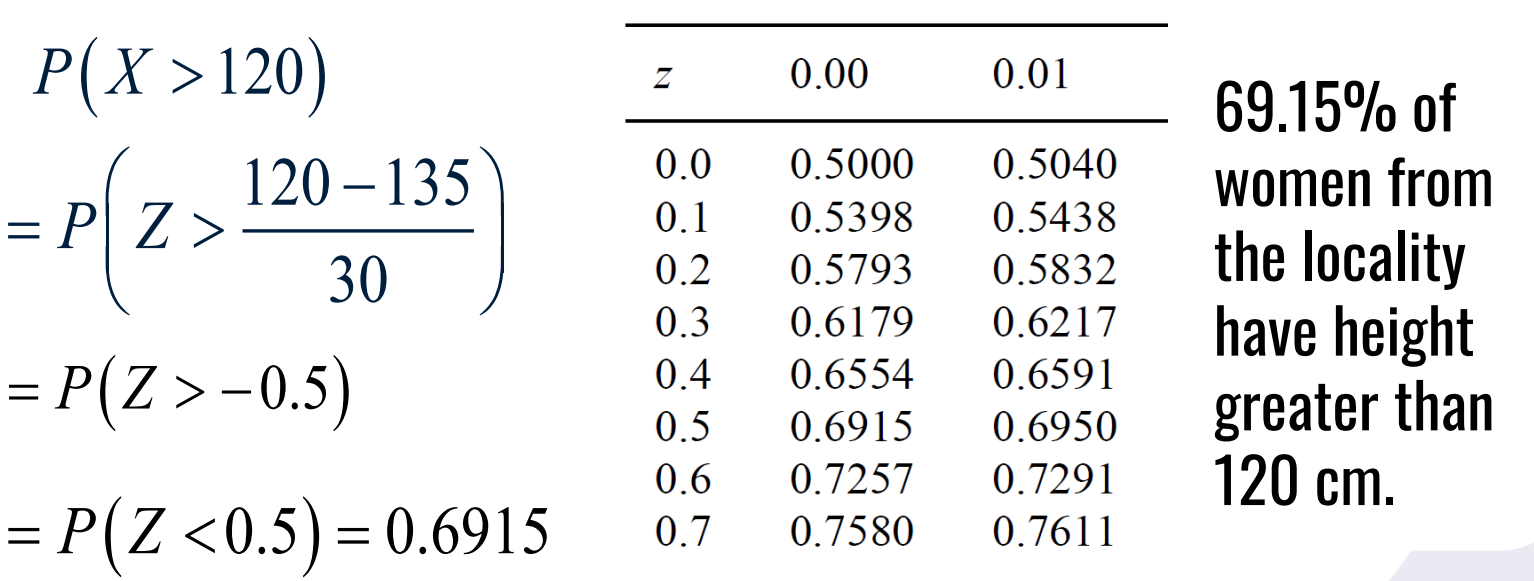
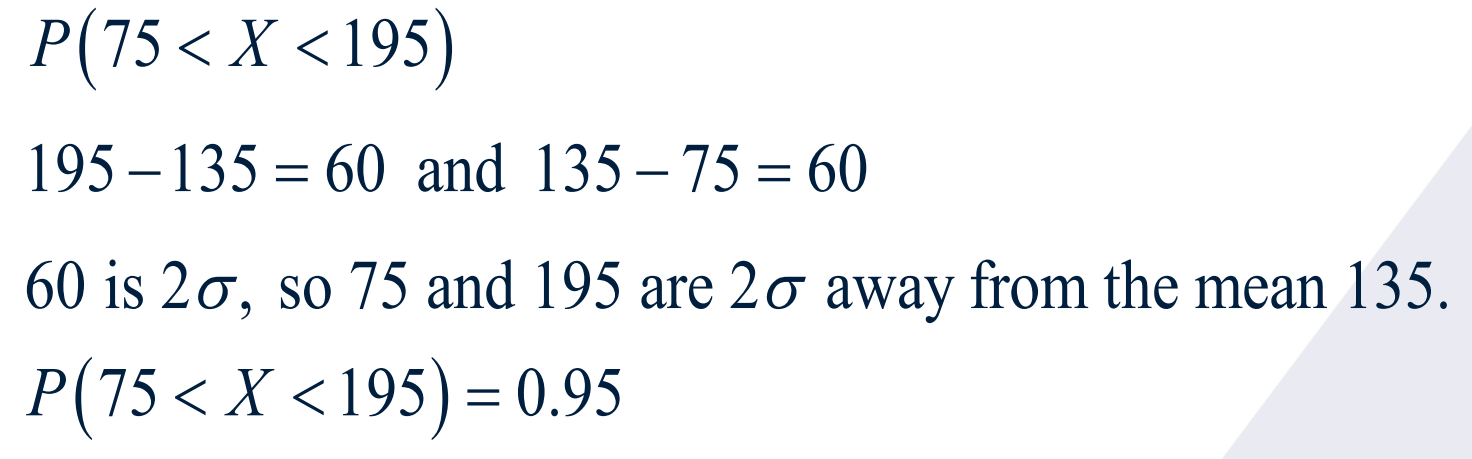
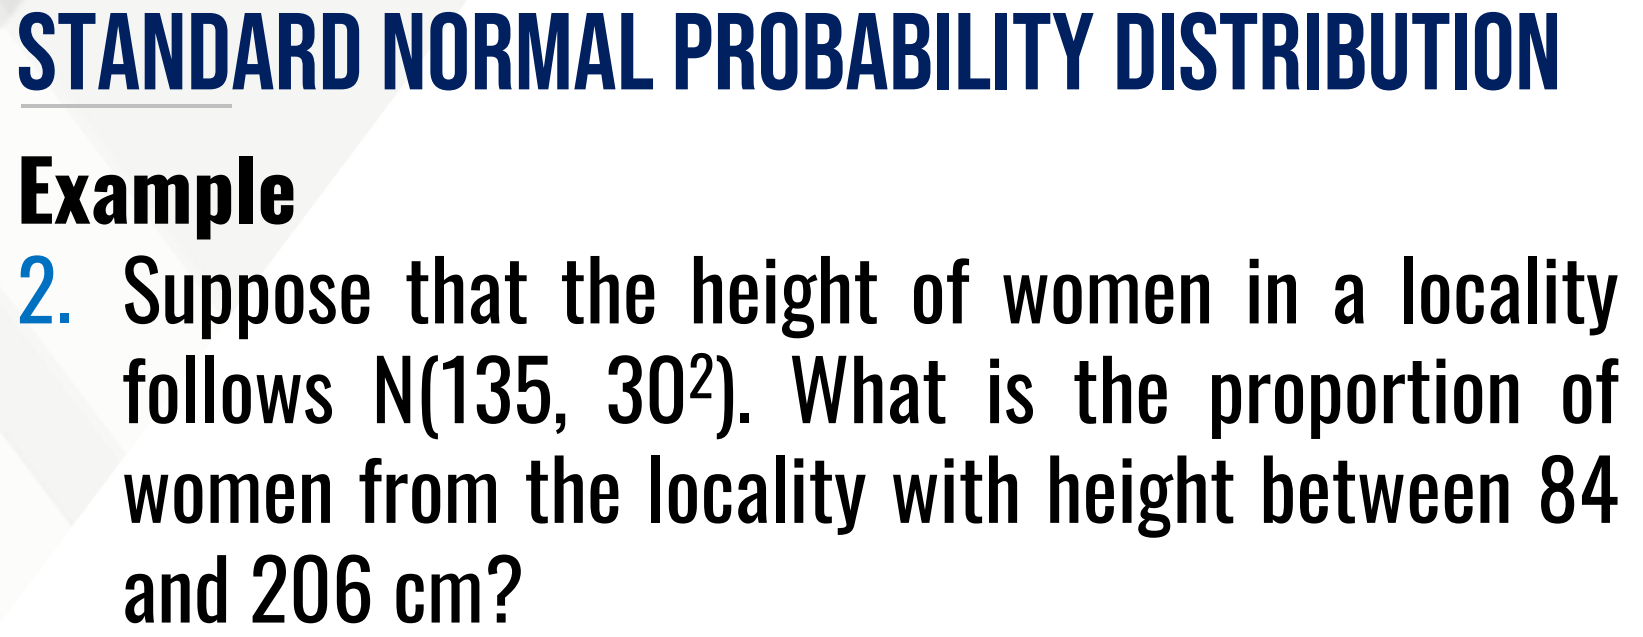
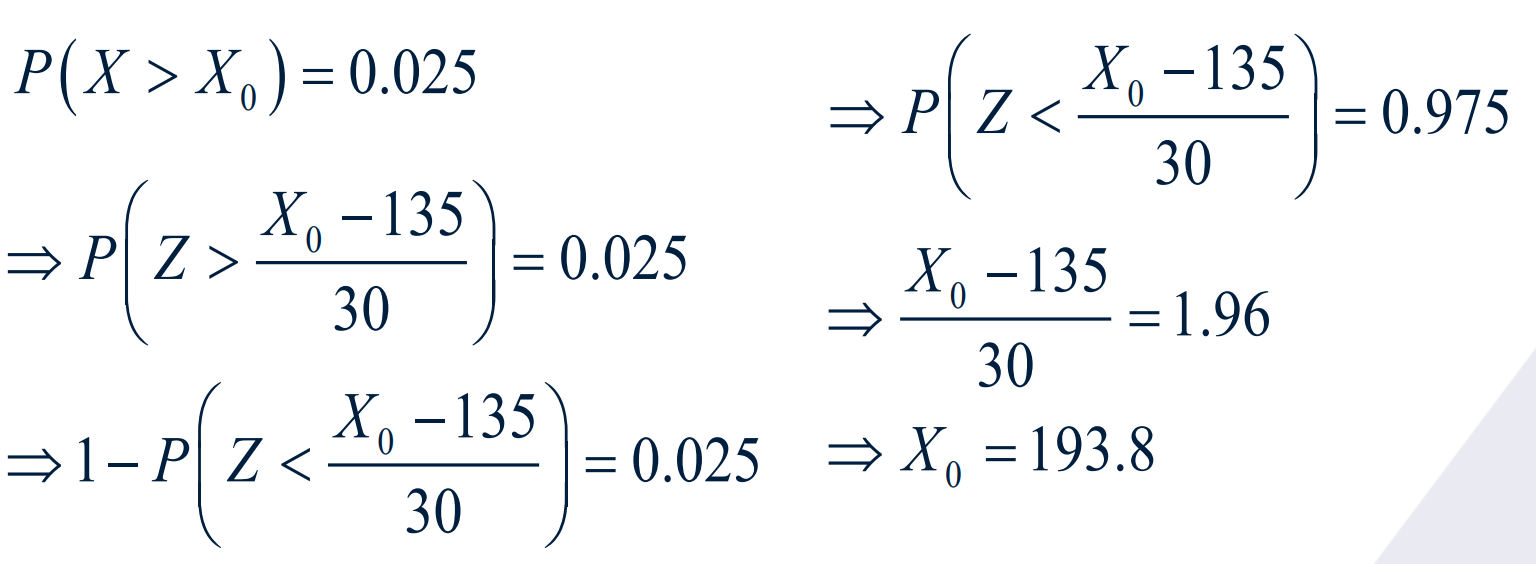
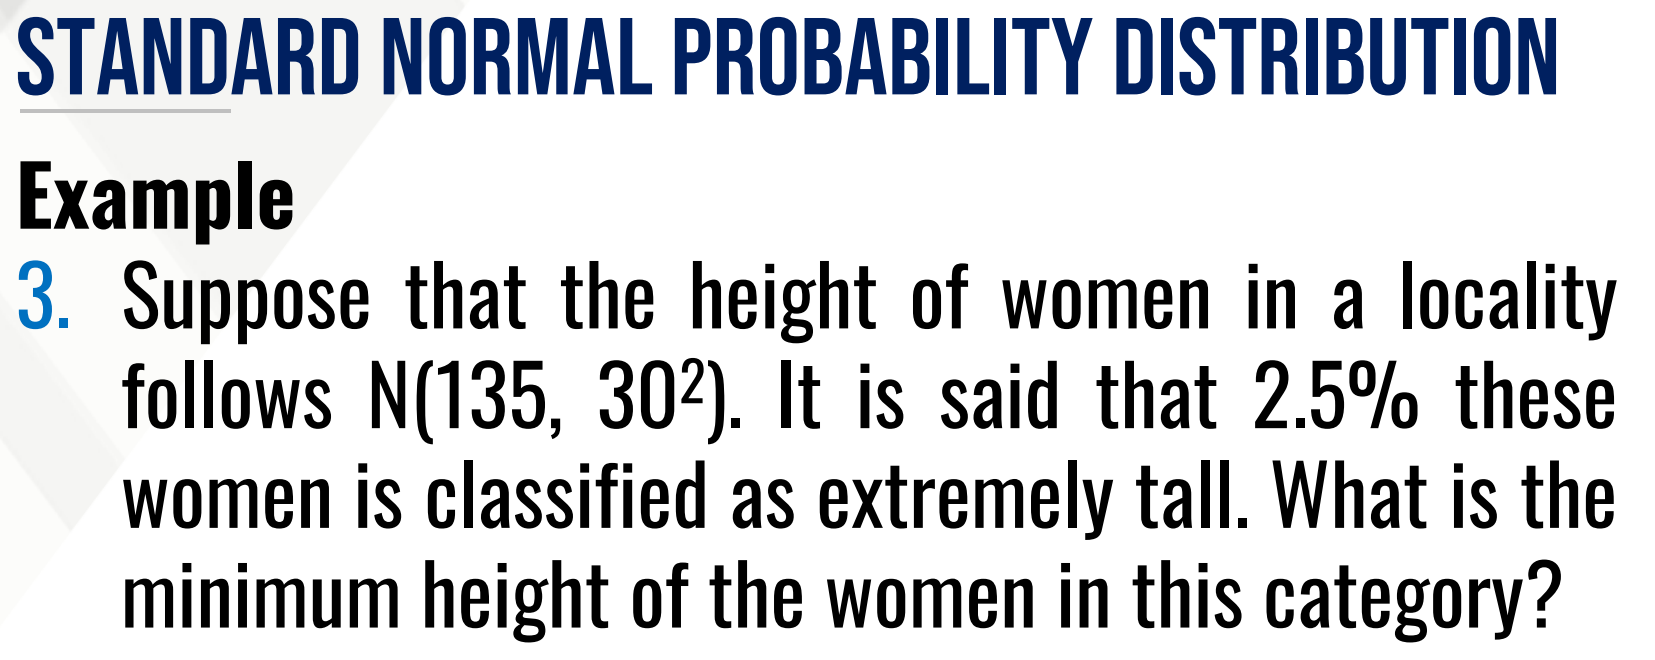
CALCULATE PROPORTION THEN INTERPRET
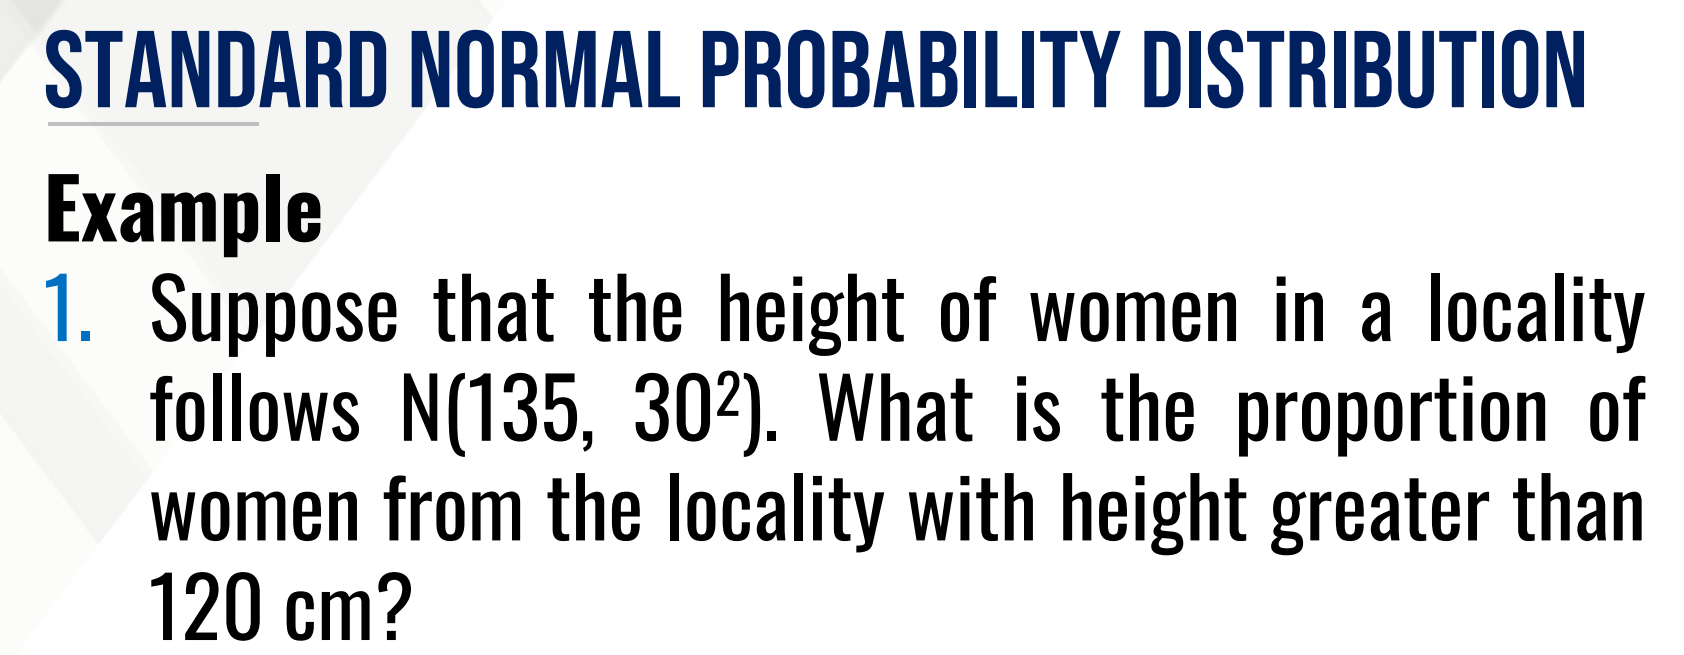
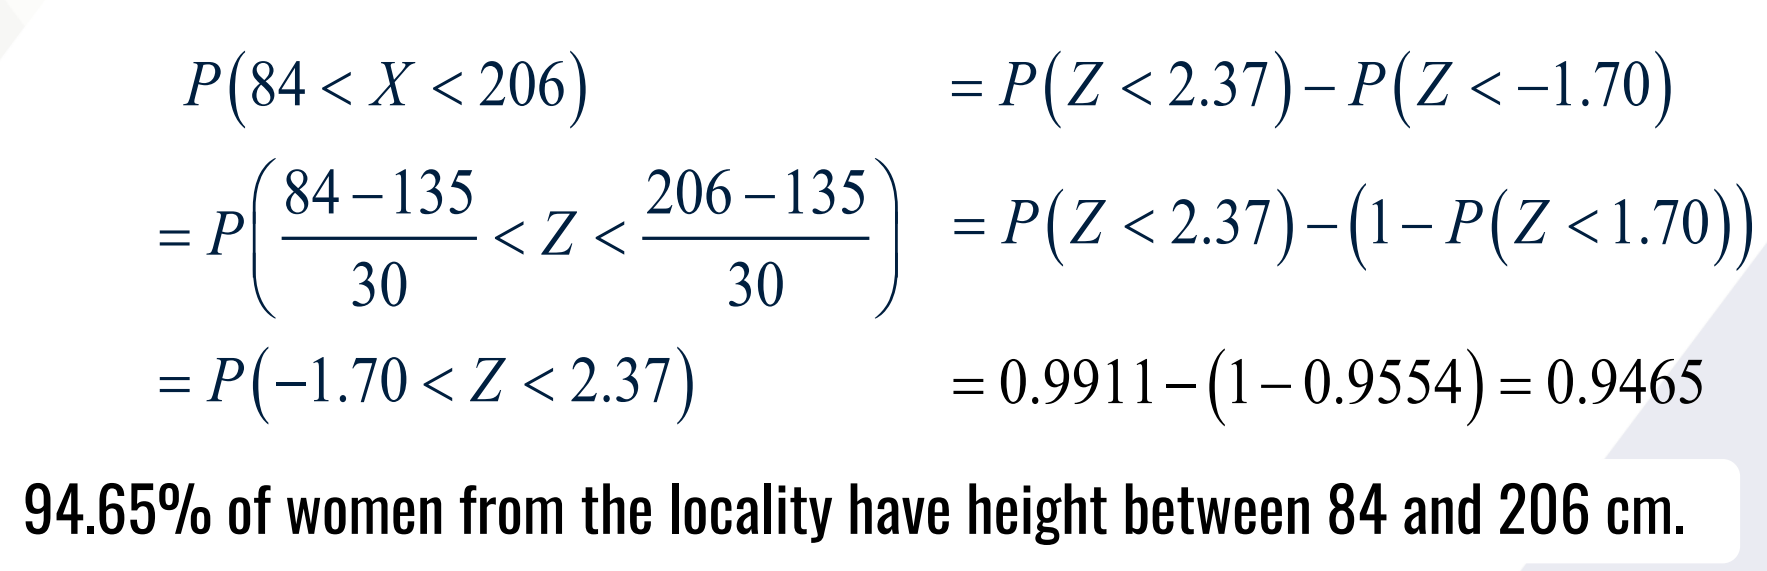
CALCULATE PROPORTION THEN INTERPRET
EXPONENTIAL PROBABILITY DISTRIBUTION
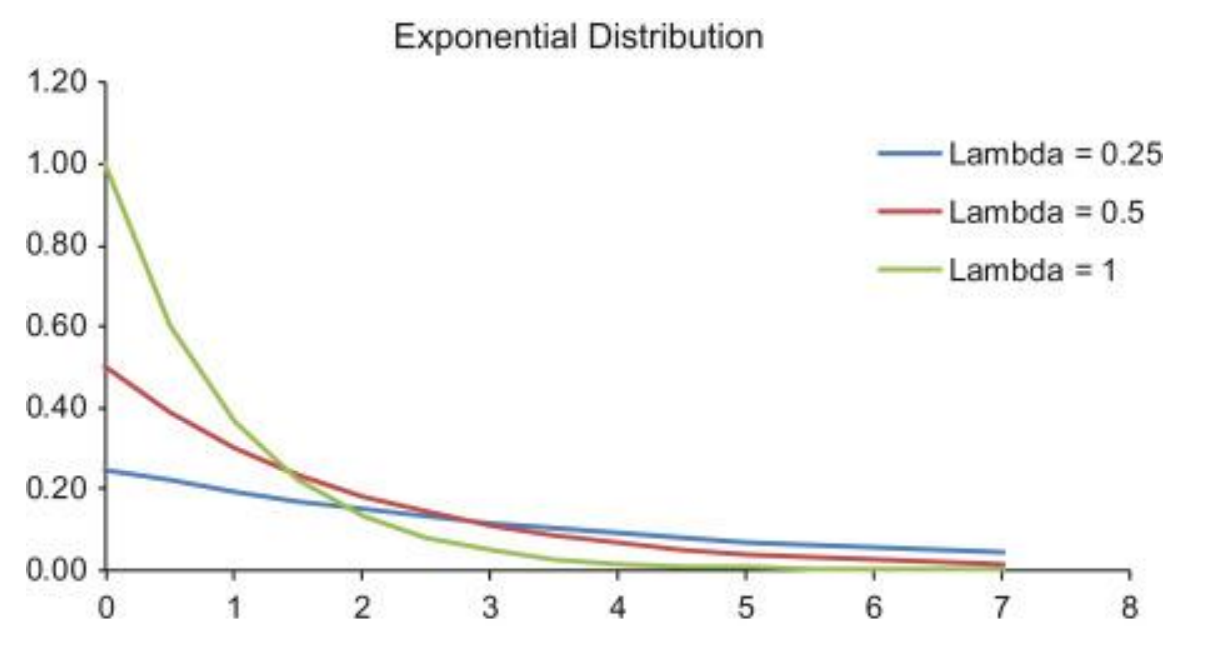
It is appropriate for modeling life length data, survival time, or time between Poisson events
EXPONENTIAL PROBABILITY DISTRIBUTION
It models waiting time. Hence, it is the continuous counterpart of the geometric distribution.
binomial distribution
Mendelian genetics uses ______________ to model the distribution of offspring with a particular genotype.
binomial distribution
Hardy-Weinberg equilibrium which predicts the distribution of genotype frequencies assumes _______________.
binomial distribution
Applied in sampling studies to estimate species richness and abundance
binomial distribution
Used in the estimation of prevalence and incidence of diseases
Multinomial distribution
Used to model and test frequencies of different genetic variants or genotypic combinations
Multinomial distribution
Applied to analyze relative abundances of different microbial taxa and investigate factors influencing their proportions
Multinomial distribution
Used to estimate the probabilities of different nucleotide substitutions occurring within a DNA sequence alignment
Hypergeometric distribution
Used in population genetics to model genetic drift and gene flow.
Hypergeometric distribution
Used to estimate species richness and genetic diversity for conservation strategies
Hypergeometric distribution
In genomic and bioinformatics, it is used for pathway analysis and gene enrichment studies.
Geometric distribution
Used to model the number of contacts needed for disease transmission to occur.
Geometric distribution
Helps in assessing the likelihood of successful colonization of a new habitat among ecological species
Geometric distribution
In genetics, it help estimate the probability of the first mutant cell arising within a given number of divisions.
Geometric distribution
Used to model the number of doses required for a drug to exhibit therapeutic effect
Poisson distribution
In molecular biology, it is employed to analyze the distribution of mutations or rare genetic events occurring in a given DNA sequence.
Poisson distribution
Used to monitor and analyze the frequency of environmental disturbances such as typhoons and earthquakes
Poisson distribution
In epidemiology, it is used to estimate the number of cases occurring within a specific population over a given time.
Normal distribution
Has wide applications in biometric measurements such as height, weight, BMI, blood pressure and other physical characteristics of human and nonhuman populations.
Normal distribution
Allows for the estimation of genetic parameters such as heritability and prediction of phenotypic values.
Normal distribution
Most statistical procedures and tools applied in almost all disciplines assume normality of data.
Exponential distribution
Vital in survival analysis to model time to event such as death, relapse and recurrence
Exponential distribution
Models the decay of radioactive isotopes over time and provides insights on half-life
Exponential distribution
In Pharmacokinetics, it estimates drug clearance rates and predicts drug concentration decay over time.
Exponential distribution
In epidemiology, it models the incubation period of a disease and estimates the time of disease onset.