Accounting Information Systems Vocab (Chapters 1+2.2 &2.3, 5) + Required Study Areas Part 1
1/66
There's no tags or description
Looks like no tags are added yet.
Name | Mastery | Learn | Test | Matching | Spaced | Call with Kai |
|---|
No study sessions yet.
67 Terms
System
A framework of interacting parts that work together to achieve an objective.
Simple System
Systems that have relatively few parts and interactions between them. Ex: A bike
Complex System
Systems that have many parts or interactions and are too difficult to identify or explain. Ex: Immune System, FED, and accounting systems.
1. An objective, 2. The parts, 3. Their interactions
What are the 3 aspects of general systems?
System Problem
When the system objective is not being met. This happens when parts are missing, parts are not functioning properly or are not working together, or the objective is unclear or in dispute. Ex: A flat tire, or late payroll checks.
Accounting Information Systems (AIS)
A system that involves a framework of people, processes, technologies, and controls that work together to provide information needed to operate effectively and efficiently, make sound decisions, and file necessary reports accurately and on a timely basis.
People, processes, technologies, and controls
What are the 4 components of AIS?
People
The human beings who perform tasks (processes) involved in collecting, processing, tracking, and reporting accounting information. Ex: Data Entry clerks, bookkeepers, controllers.
Processes
The tasks that people perform to get things done in an organization. Ex: purchasing inventory, paying vendors, billing customers, paying employees, etc.
Technologies
The things (manual or electronic) used to produce accounting information. Ex: includes software and hardware to produce purchase orders, journals, ledgers, income statements, checks, invoices, etc.
Controls
Used to reduce the likelihood that something will go wrong. Ex: Reconciling the bank accounts in a timely manner, using a cash register to protect from theft of cash, using passwords . . ., requiring a second signature on large checks, obtaining a credit check before goods are shipped, and locking the warehouse doors to prevent unauthorized people from accessing inventory.
Data
Raw unorganized facts that need to be processed. Ex: numbers, dates, names, weights, and costs are considered data.
Information
Data organized to provide some meaning. Ex: 100 pounds of tomatoes from an invoice totaling $80.97
Internal Data
Data needed for payroll: wage rates and exemptions.
External Data
Payroll tax percentages needed to withhold taxes from employees’ paychecks.
Quantitative Data
It is a numerical value, such as the amount of sales revenues and the value of inventory.
Qualitative Data
Refers to data that have non-numerical value and are also relevant to organizations. Ex: A restaurant review.
EDI
A standard electronic format for exchanging business documents.
1.Relevant (Reduces uncertainty), 2. Reliable (free of bias or error), 3. Timely (Able to affect decisions), 4. Complete (Include relevant data), 5. Understandable. (Intelligent to the user)
5 Characteristics of Useful Information:
Value of information
Benefits of information minus the cost of information.
Information Ecosystem
Any party (internal or external) who needs to interact with the organization from an information perspective and vice versa.
1.Managers (operating decisions and strategic plans), 2. Investors (buy, hold, and sell decisions), 3. Creditors (Determine if a loan should be made based on credit), 4. Auditors (To determine that a company is auditable and not misstating financial records), 5. Employees (Assess financial stability of company)
Who uses Accounting Information?
Competitive Advantage
Can be created with accounting technology by improving service to customers, access to data, and cutting costs, which can then lead to lower prices, improved customer satisfaction, better decisions, increased revenue, and increased profit.
Organizations can: 1. manager larger databases, 2. access data across traditional boundaries, such as operational versus financial, 3. Move data more rapidly to and from remote locations, 4. Obtain immediate feedback on the effects of transactions, 5. Allow customers to interact with company systems 24-hours a day from anywhere in the world, 6. Outsource software applications, development, storage, and maintenance to a remote data center maintained completely by an outside vendor, 7. Mine vast amounts of unstructured ‘big data’ to discover information that had been previously unknown or beyond comprehension, 8. Create encrypted transactions or records that are stored in a peer-to-peer fashion on computers around the world in a blockchain file that cannot be hacked.
Effects of Changing Technology on AIS
Fraud and errors
2 types of misstatements
Misappropriation of assets and financial statement fraud
2 types of fraud
Enterprise Resource Planning systems (ERPS)
Integrate data from all aspects of a company’s operations into one large, centralized database.
Hierarchical Block Diagram
Used to represent successive levels of component subsystems; the connecting lines show inter-level associations but not information flows.
Horizontal Block Diagram
Shows the blocks representing the various activities, while the connecting lines depict information flows.
Chart of Accounts
A coded list of all balance sheet and income statement accounts used by a business.
Systems documentation
allows an organization to review and evaluate accounting information design.
Documentation can be used to communicate how a process works, job responsibilities, and provide a reference for training purposes. When properly designed and communicated, documentation can reduce the number of costly misunderstandings and mistakes. Documentation is useful in helping management understand and maintain controls with the current state of the system. In addition, external auditors review system documentation as part of their audit procedures.
Why document?
dataflow diagrams, flowcharts (document, systems, and program), entity-relationship diagrams, resource-event-agent diagrams, business process model notation, and unified modeling language diagrams
main types of systems documentation
1.Accountants (design and monitor, internal controls, the accounting system.), 2.Auditors (understand how a client’s system works and to evaluate the effectiveness of the internal control structure), 3. System users (employ flowcharts to understand a process and learn how a system works.)
Who uses flowcharts
The general rule for choosing documentation
choose the technique that gives you the most explanatory value for the least cost
Narrative Memorandum
Many companies use them because they are the least expensive and easiest to prepare.
ICQ (Internal Control Questionnaire)
describes the internal control procedures that would be expected throughout the process of an effective system. Very helpful in identifying and documenting whether the controls that need to be there are there and have been implemented.
Dataflow diagrams (DFDs)
A visual depiction that focuses on the flow of information through the system.
Logical DFDs
A dataflow diagram that visually depicts the logical flow of information in a process, such as ‘what’ the business activities are.
Physical DFDs
A dataflow diagram that visually depicts ‘how’ the process works, such as the software programs, hardware, and databases.
The DFD similarly diagrams the source and destination of the data (input/output), the processes that transform the data (process), the data storage, and the data flow.
What does the DFD diagram?
Square (DFD)
This symbol is used to define the source or destination of a data flowing, meaning where the data are needed (destination)) and where it initiated (source).

Circle (DFD)
“This symbol is used to show that data are transformed.”

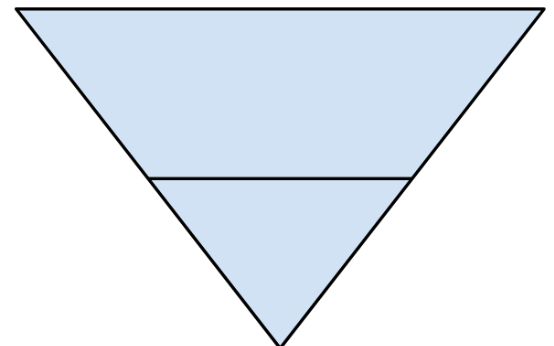
Open rectangle (DFD)
This symbol is used to show that data are at rest, including but not limited to a data file or pieces of a data file, such as a record or attribute from the data file.

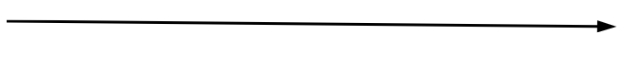
Arrow (DFD)
This symbol is used to show that data are in motion.

begin with going from a logical left to right as you begin your diagram. Make sure that you have the right level of detail for your audience and do not make one diagram too complex; it is better to have subdiagrams.
Advice for making a DFD
Flowchart
A visual diagram depicting the procedures and document flows of an accounting system.
System Flowchart
A type of flowchart that visually depicts manual and computerized accounting systems documenting inputs, processes, and outputs.
Document Flowchart
A part of a system flowchart used to describe the flow of information and documents throughout the responsibility areas of an organization.
Program Flowchart
A type of flowchart that is focused on a single program within the system.
Document
Represents any document, form, or report used in the system such as a purchase order, invoice, check, financial statement, etc. (can also be used as an output.)

Data Input
This symbol is used when someone is entering data into a computer using either a keyboard, a touch screen, or voice recognition.

Display
This symbol is used to represent a computer screen.

Manual
This symbol is used to represent an activity that is carried out by an employee without the use of a computer.

Computerized
Processing of data that is carried out by computers as opposed to being done manually.

Manual File
This represents a file cabinet or folder in which documents such as checks, invoices, purchase orders are kept. A letter in the small triangle at the bottom indicates whether the filing was done Alphabetically, Chronologically, or Numerically.
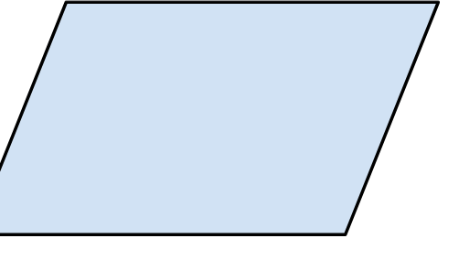
Accounting
A parallelogram is used to represent a journal, register, or ledger.
Direct Access
Can be used for magnetic or solid-state disk storage.

Storage Disk Magnetic Tape
Use when told that the processed information is stored on magnetic tape. This is a sequential-access storage medium.

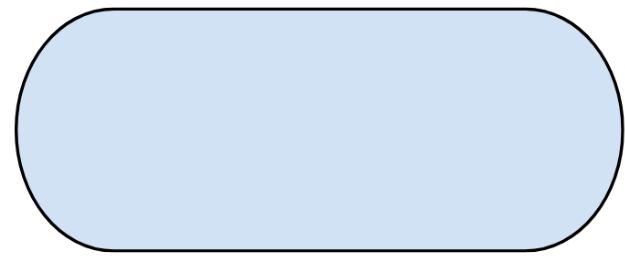
Terminal
Symbolizes the beginning or end of the flowchart such as something you just received from a customer or sent to the treasurer or controller.
Arrowlines
These solid lines are used to connect all symbols. Arrowheads are necessary when the flowchart does not follow the normal left to right top-down convention.
On-Page Connector
Keyed with a number that indicates the point where the flow is being interrupted. Another connector keyed with the same number indicates where the flow picks up.

Off Page Connector
We use this connector when the flowchart of a subsystem does not fit on one page. Use an off-page connector at the end of the page and another on the following page

Comment
This symbol is used to provide further explanation.

Decision
This symbol is used ONLY for programming flowcharts where alternative steps may be taken based on the result of some decision.

1.“Flowchart reads left to right, top down.”2. “Label all symbols with the process performed.”3. “Sandwich Rule: “A process should be sandwiched between an input AND an output. Thus, a document coming out of a manual procedure before filling it.”4.You do not need to document a manual process to file a document.5.Divide the flowchart into columns when you want to show the various departments of the organization involved in the process.
Guidelines for creating flowcharts
Create, review, and evaluate design
Steps of the documenting system.