Statistics Exam 1
1/45
There's no tags or description
Looks like no tags are added yet.
Name | Mastery | Learn | Test | Matching | Spaced | Call with Kai |
|---|
No analytics yet
Send a link to your students to track their progress
46 Terms
Data
Specific info of the individuals
Two types of data:
Quantitative and Qualitative
Quantitative data
numeric
Qualitative data:
Non-numeric or categorical
Two types of Quantitative data
Discrete and Continuous
Discrete
whole numbers, gaps between values
Continuous
decimals, no gaps
Observed studies
Change come variables to see the effect in other variables
Explanatory variables
“cause”
Response variables
“effect”
Lurking variables
Variables not considered which are having an effect on other variables
Frequency
how many of each data value?
Relative Frequency
What proportion if each data values?
Types of samples
Simple Random
Cluster
Systemic
Stratified
Convenience
Simple random
Randomized for each individual
Cluster
A randomized subgroup is the sample
Systemic
Every kth individual is in the sample
Stratified
A random sample from each group
Convenience
Less randomness but easier to create
Types of Bias:
Sample Bias
Non response Bias
Response Bias
Sample Bias
The sample does not represent the population
Non-response bias
Not everyone competes the survey
Response bias
The data doesn’t represent the sample.
Mean Notation in a sample
x̄
Mean notation in a population
μ
Standard deviation notation in a sample
S
Standard deviation notation in a population
σ
A statistic is resistant/resilient
Mean is not resistant, Median is
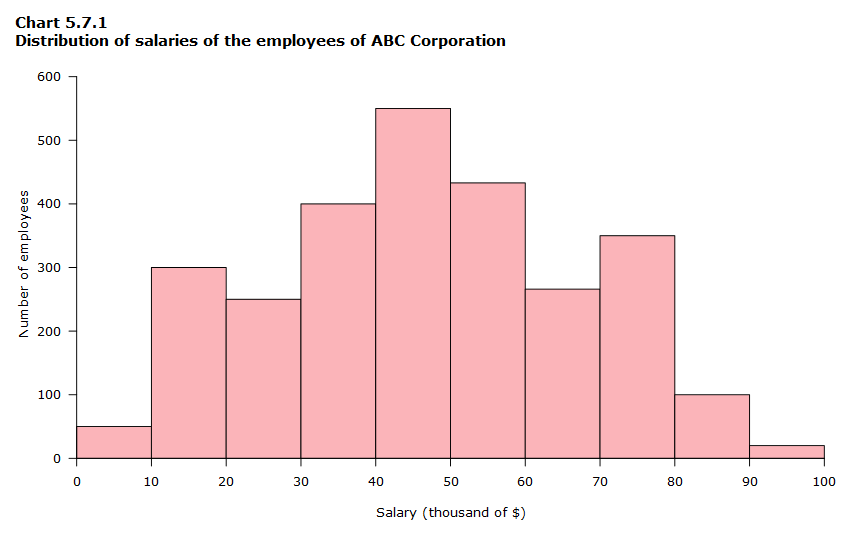
What kind of graph is this?
Histogram
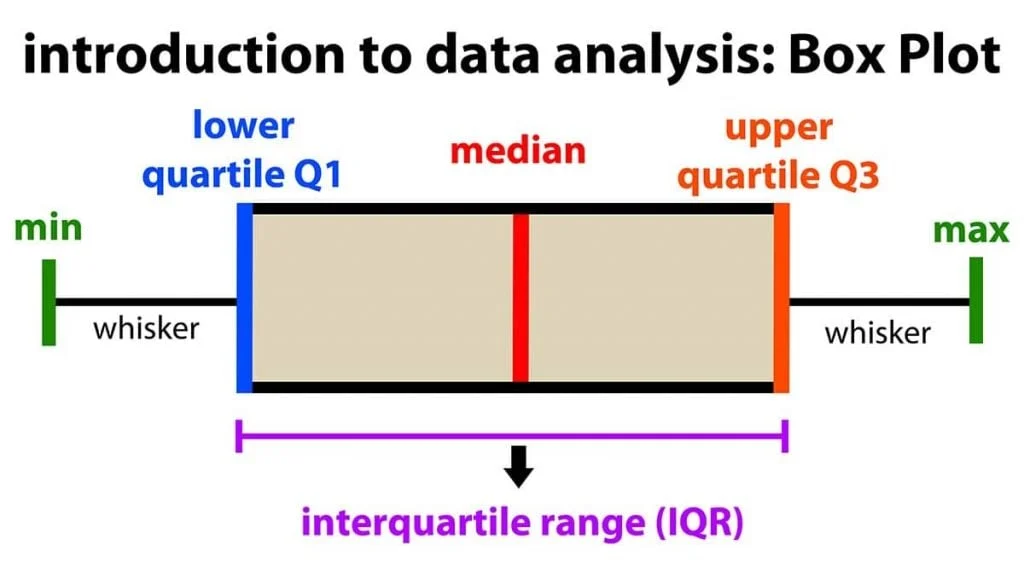
What kind of graph is this?
Boxplot
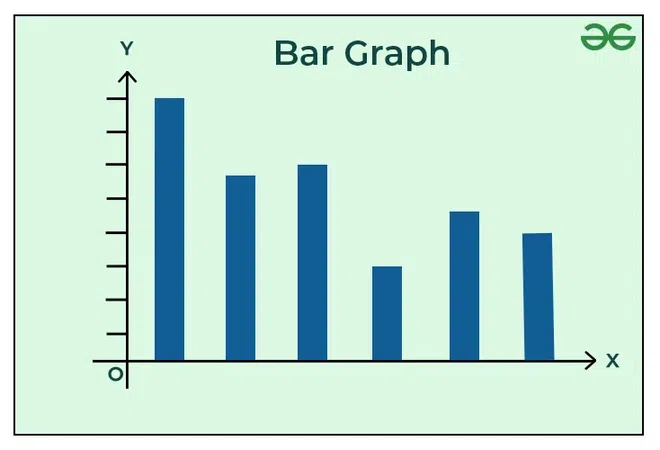
What kind of graph is this?
Bar graph
What is the mean?
The average of all of the data
What is the median?
The middle number of the data
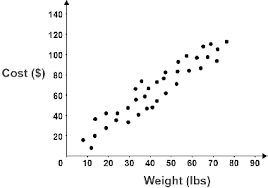
Is this negatively or positively associated, What is the slope of regression, What is the linear correlation coefficient?
Positively associated, Slope of regression line is positive, Line correlation coefficient is r= +1
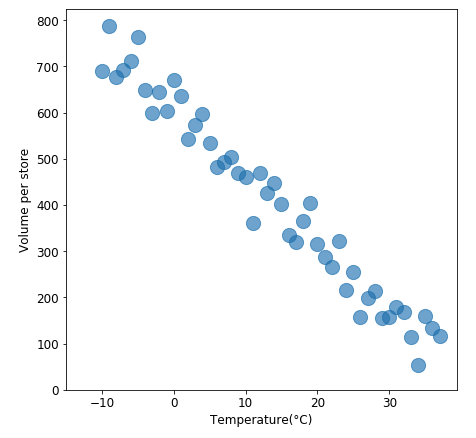
Is this negatively or positively associated, What is the slope of regression, What is the linear correlation coefficient?
Negatively associated, Slope of regression is negative, Line correlation coefficient is r= -1
Outlier equations
…less than Q1-1.5IQR
….more than Q3+1.5IQR
Variance
A measure of dispersion
Standard deviation
The square root of the variance
IQR
Inter Quartile Range, a measure of dispersion, IQR=Q3-Q1
Outliers
Data values separated from the rest if the data.
Quartiles
The quartiles mark the 25 and 75% spots in the data just like the median is the 50% mark. The first quartile is the 25% mark “Q1”. The third quartile us the 75% mark “Q3”.
Example of simple random Sampling
Putting names into a hat
Example of Cluster sampling
having high schoolers fill out a survey
Example of a systemic sample
select every 10th person coming into a store.
Example of a stratified example
dividing people by grade then surveying people from each group
Example of convenience sampling
A teacher surveying their own students.