Unit 0 AP Bio
1/21
There's no tags or description
Looks like no tags are added yet.
Name | Mastery | Learn | Test | Matching | Spaced | Call with Kai |
|---|
No analytics yet
Send a link to your students to track their progress
22 Terms
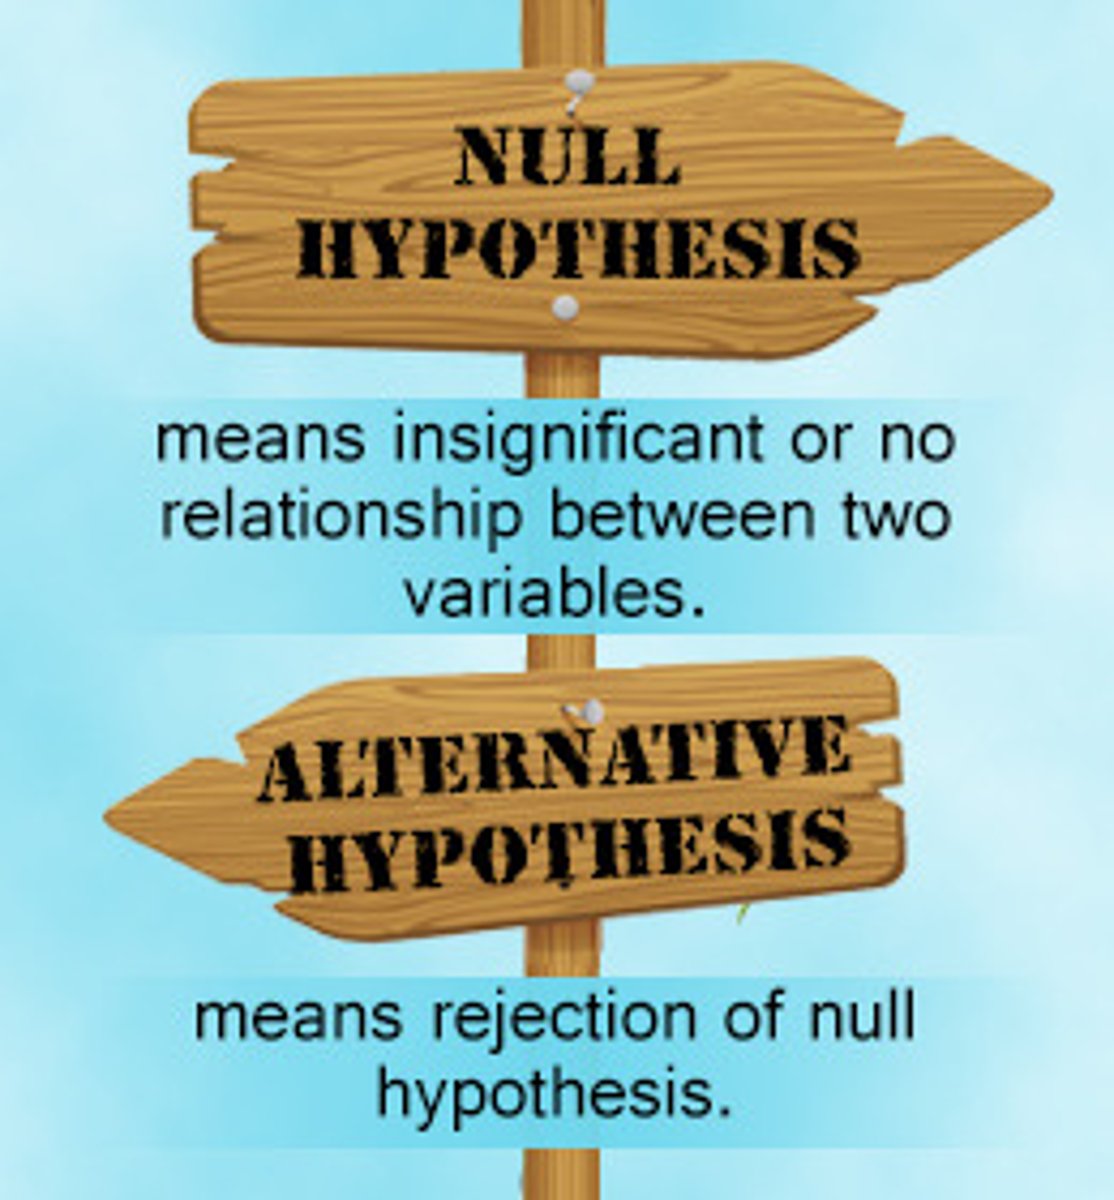
alternative hypothesis (Ha)
the hypothesis that there is a relationship between the dependent and independent varibales

Null Hypothesis (H0)
A statement of "no difference between variables"
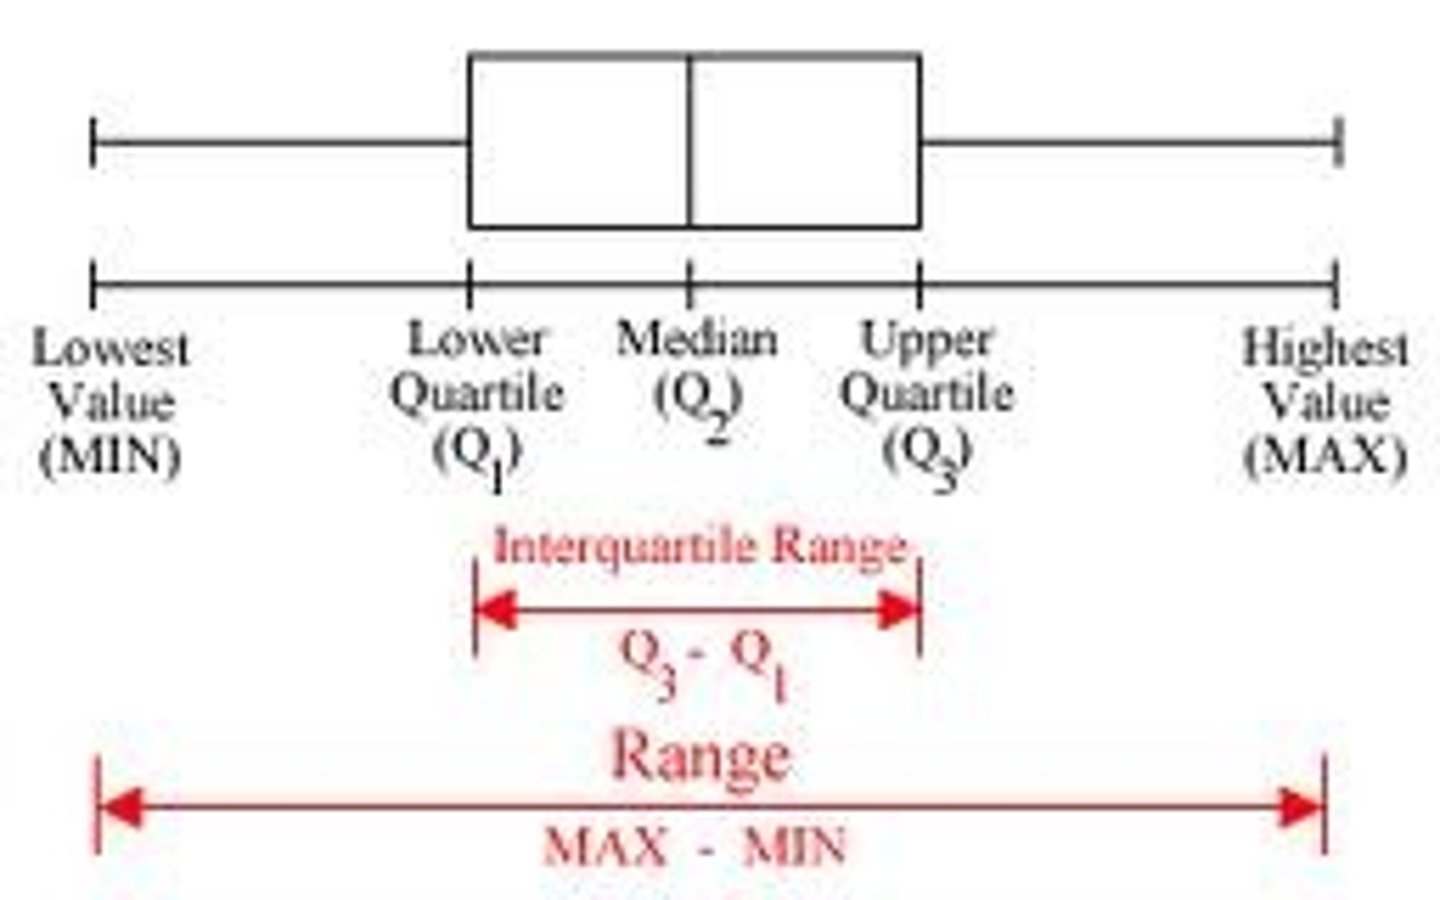
box and whisker plot
A graph that displays the highest and lowest quarters of data as whiskers, the middle two quarters of the data as a box, and the median
controlled experiment
experiment in which only one variable is changed
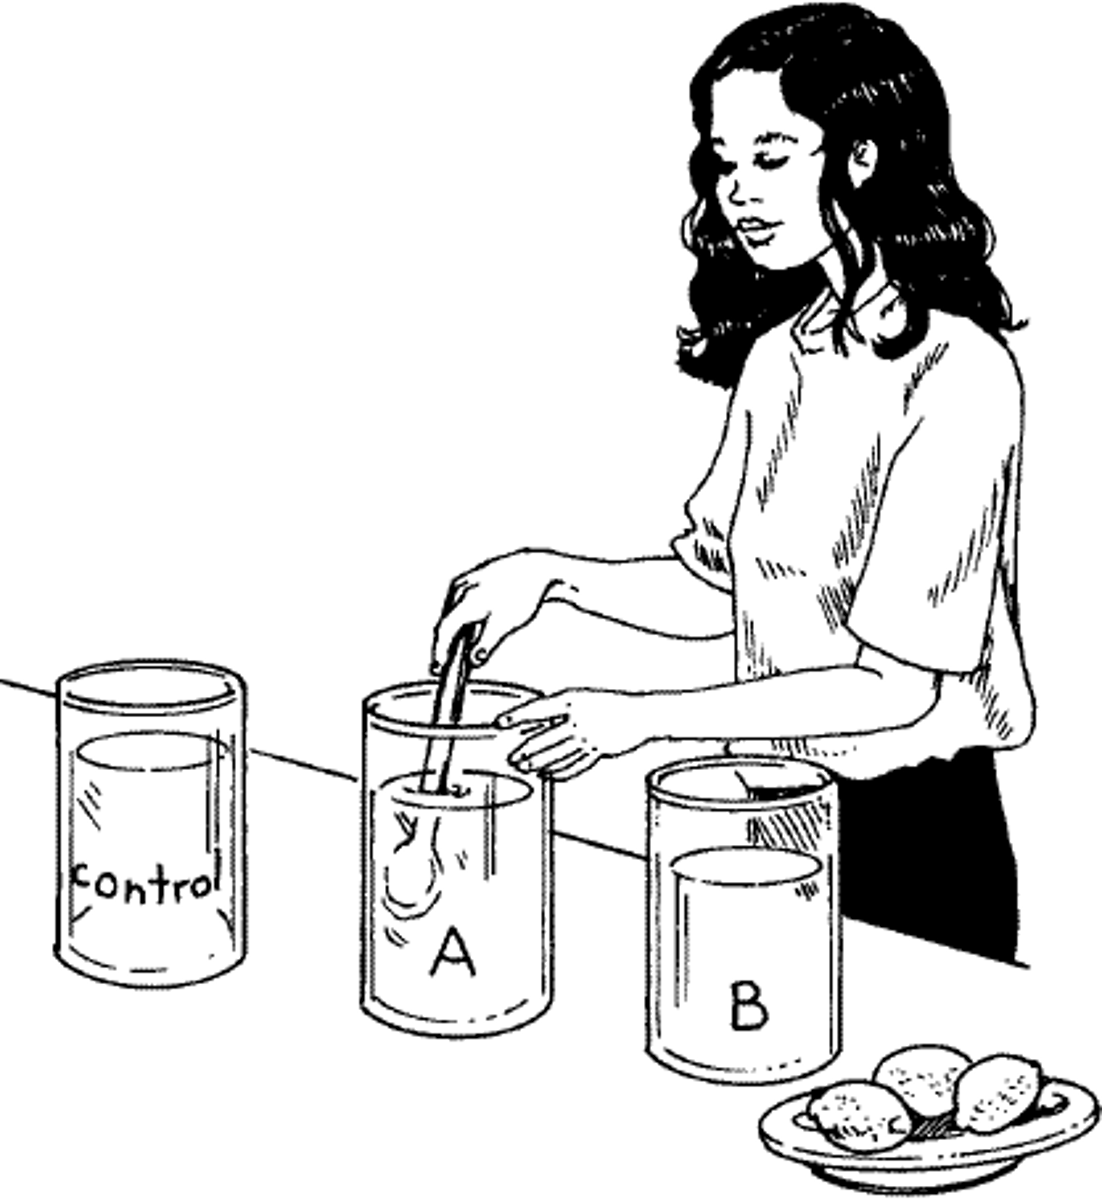
positive control
Treatment with known response
negative control
Group with no response expected
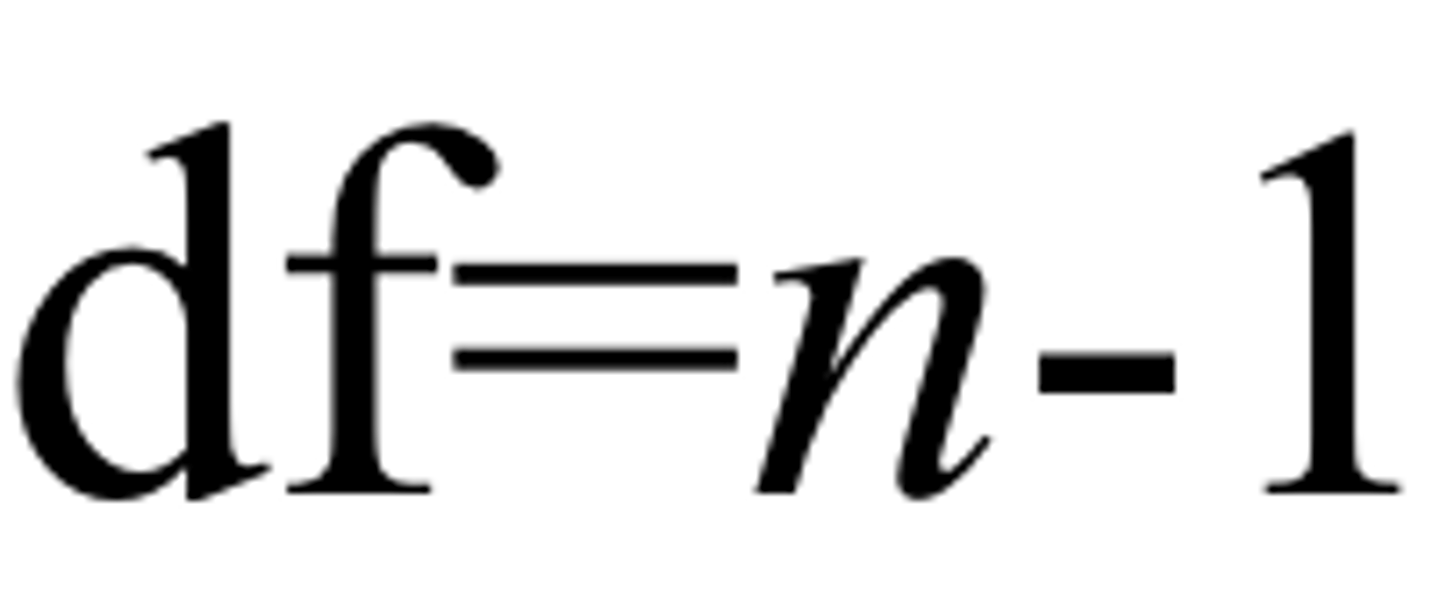
degrees of freedom
The number of individual scores that can vary without changing the sample mean. Statistically written as 'N-1' where N represents the number of subjects.
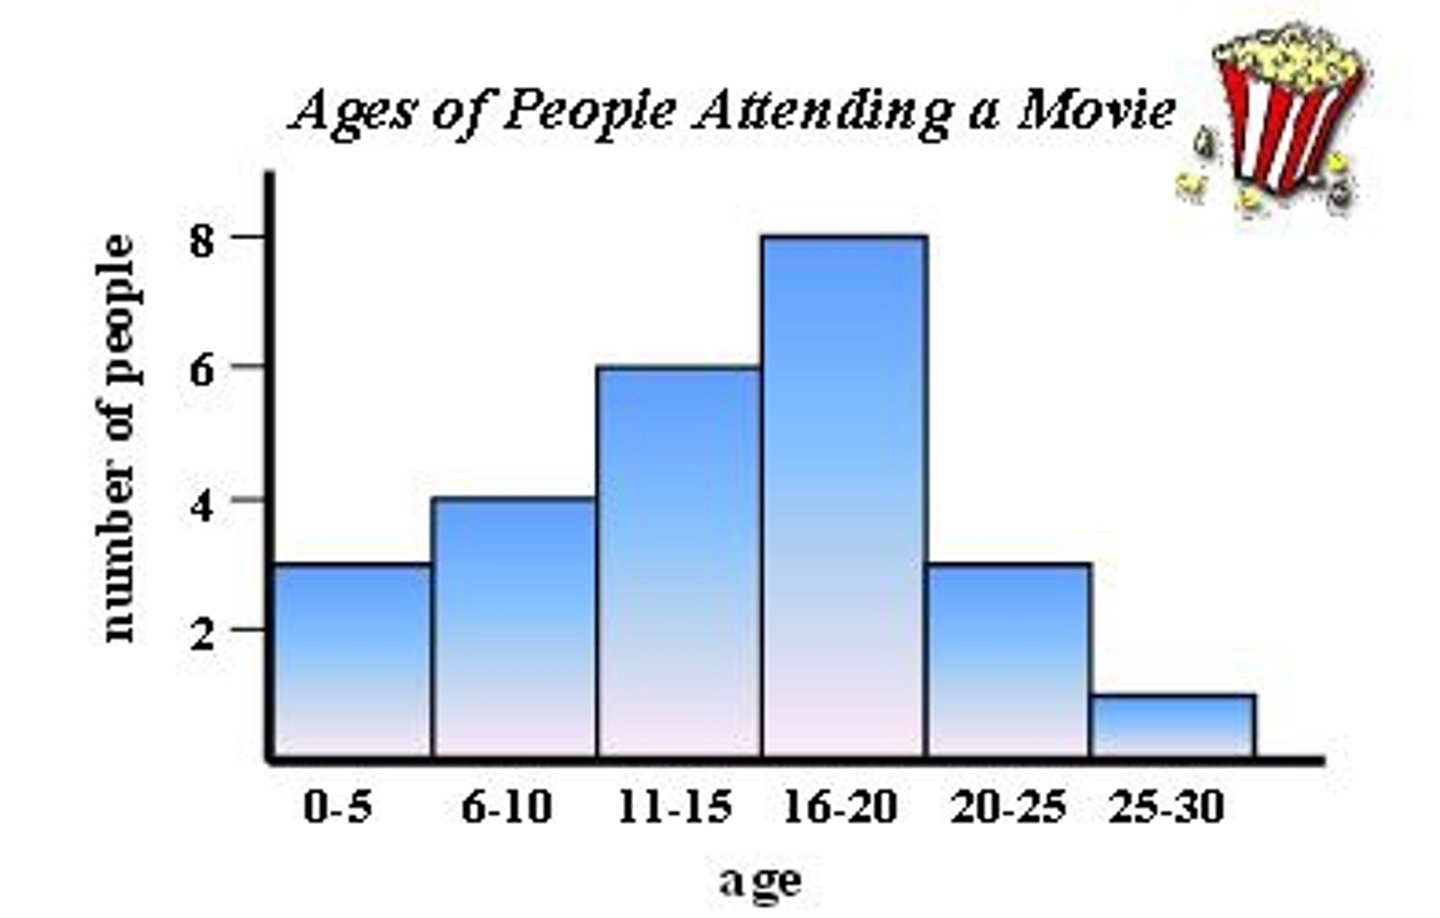
histogram
a bar graph depicting a frequency distribution
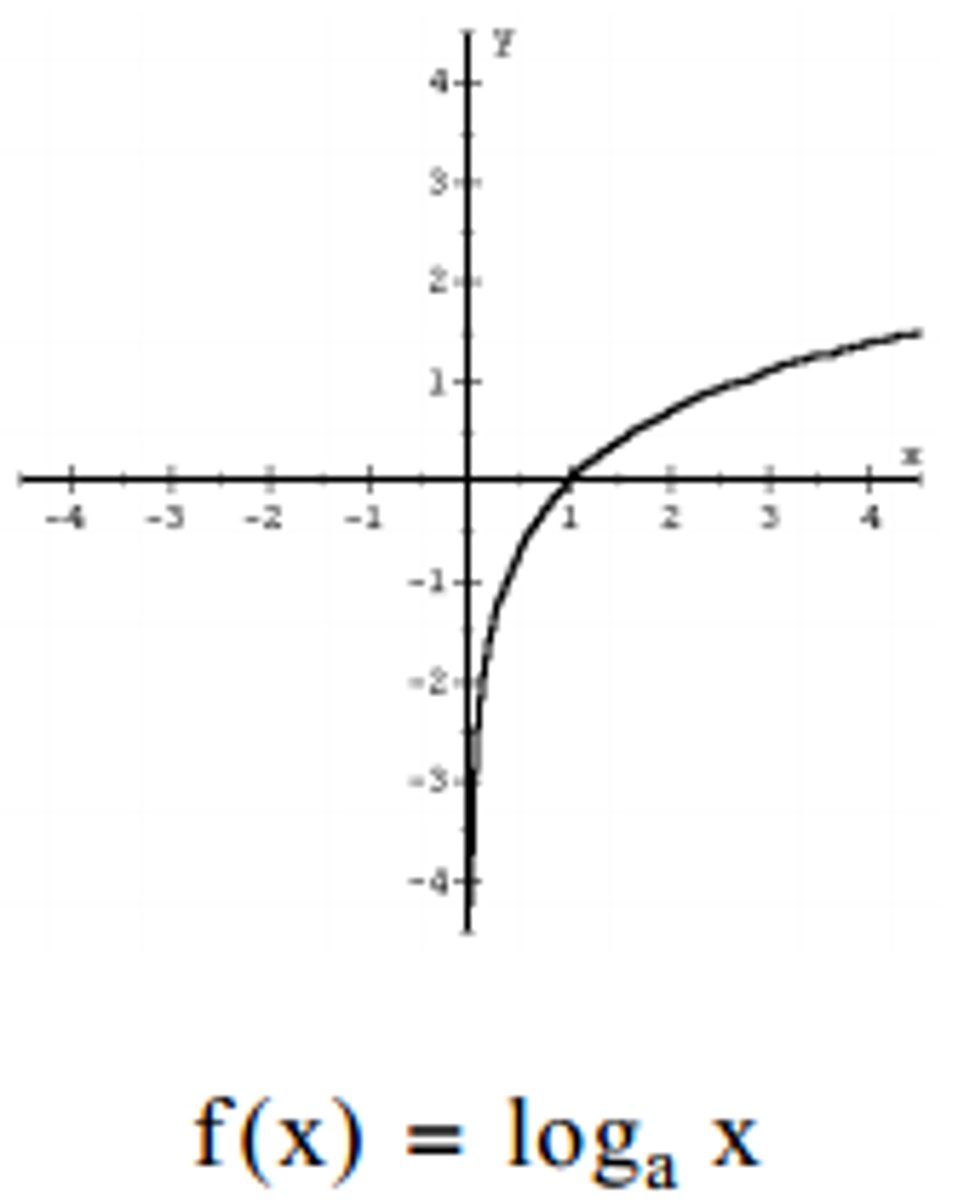
logarithmic graph
Straight line with steep curves (y = log x)
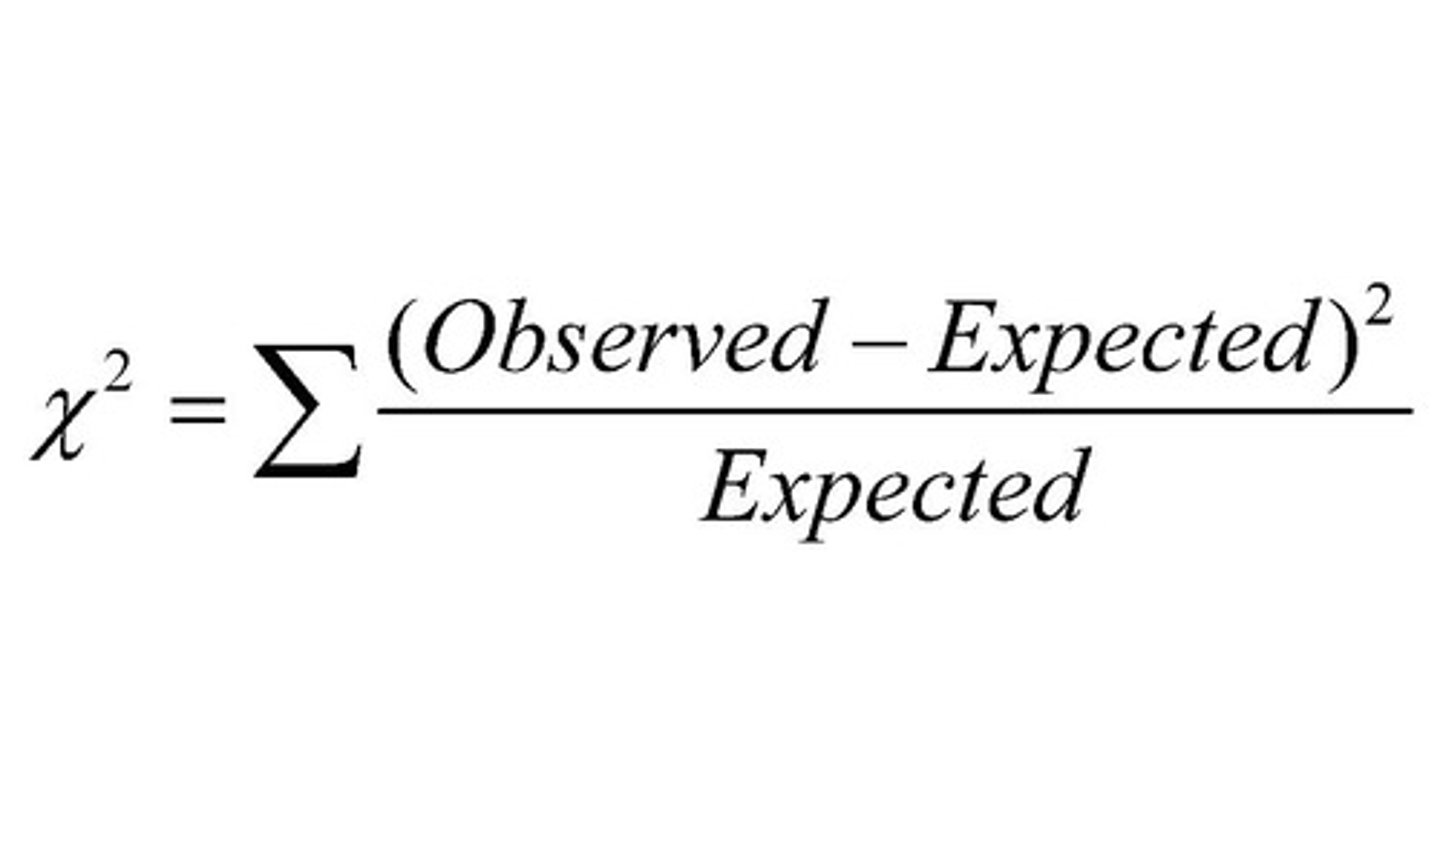
chi square formula
x^2 = Σ (Observed - Expected)^2/ Expected
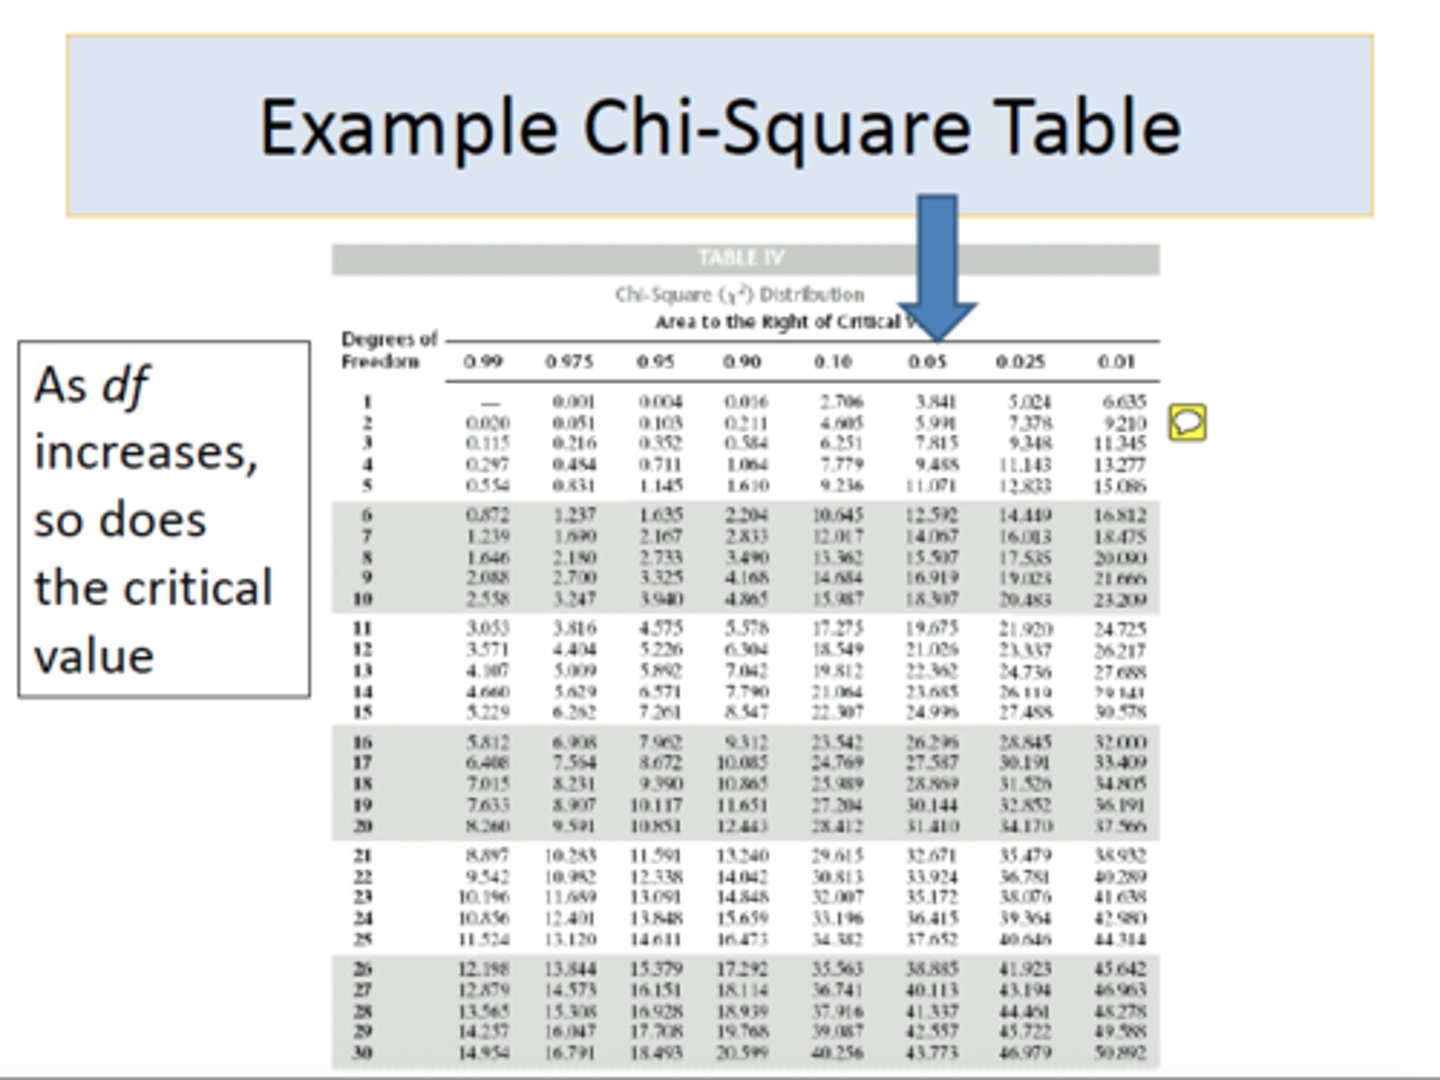
chi square value
larger for a statistically significant result than for a nonsignificant result
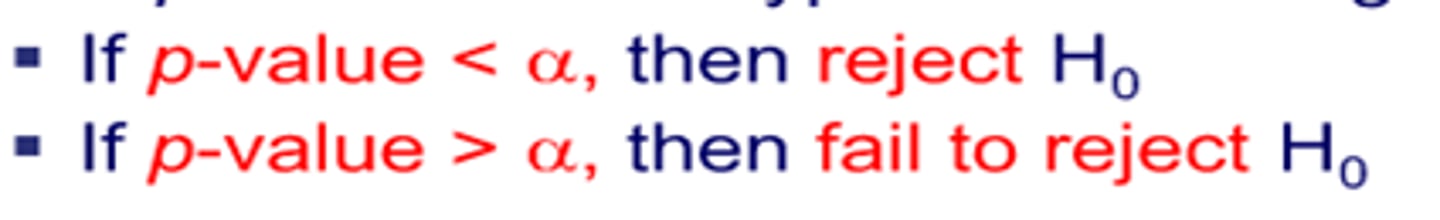
p-value
The probability level which forms basis for deciding if results are statistically significant (not due to chance).
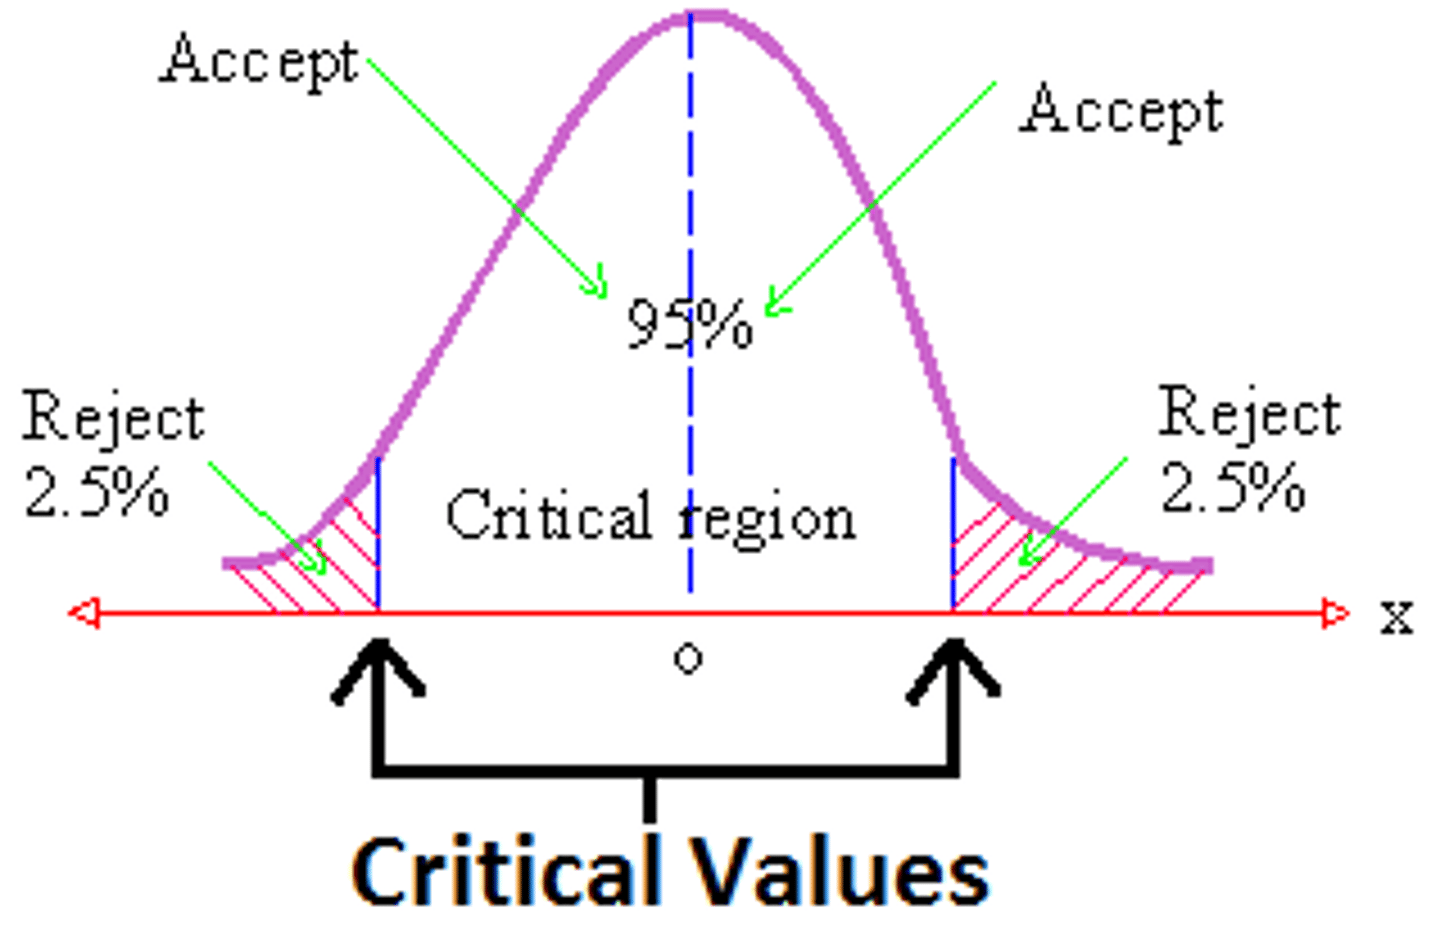
critical value
The dividing point between the region where the null hypothesis is rejected and the region where it is not rejected.
characteristics of an effective graph
LUTES:
Label your axes
Use correct graph type
Title the graph
Error bars (if applicable)
Scale axes properly
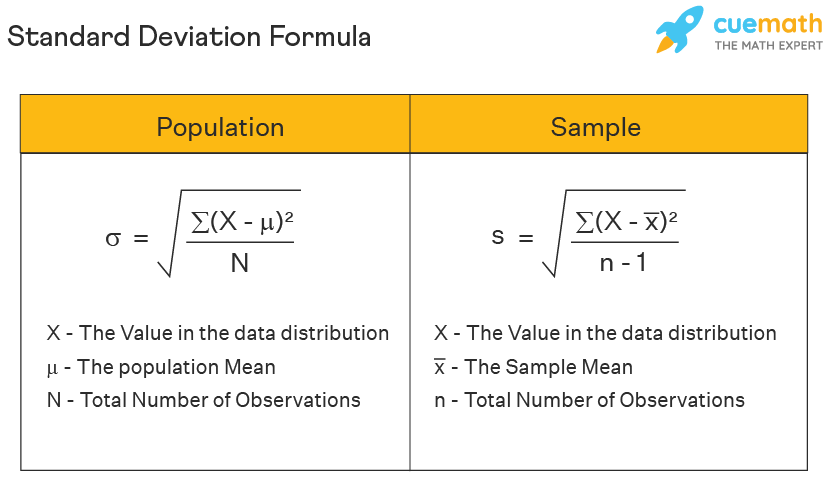
true mean (N) vs sample mean (n)
true mean: avg value for data taken from every member of pop
sample mean: avg value for data in individual experimental groups
variance
degree of variation of data from mean
standard deviation
statistical test that quantifies amount of variation in data set; allows for comparison of points within data set to see if one point is significantly different than the others
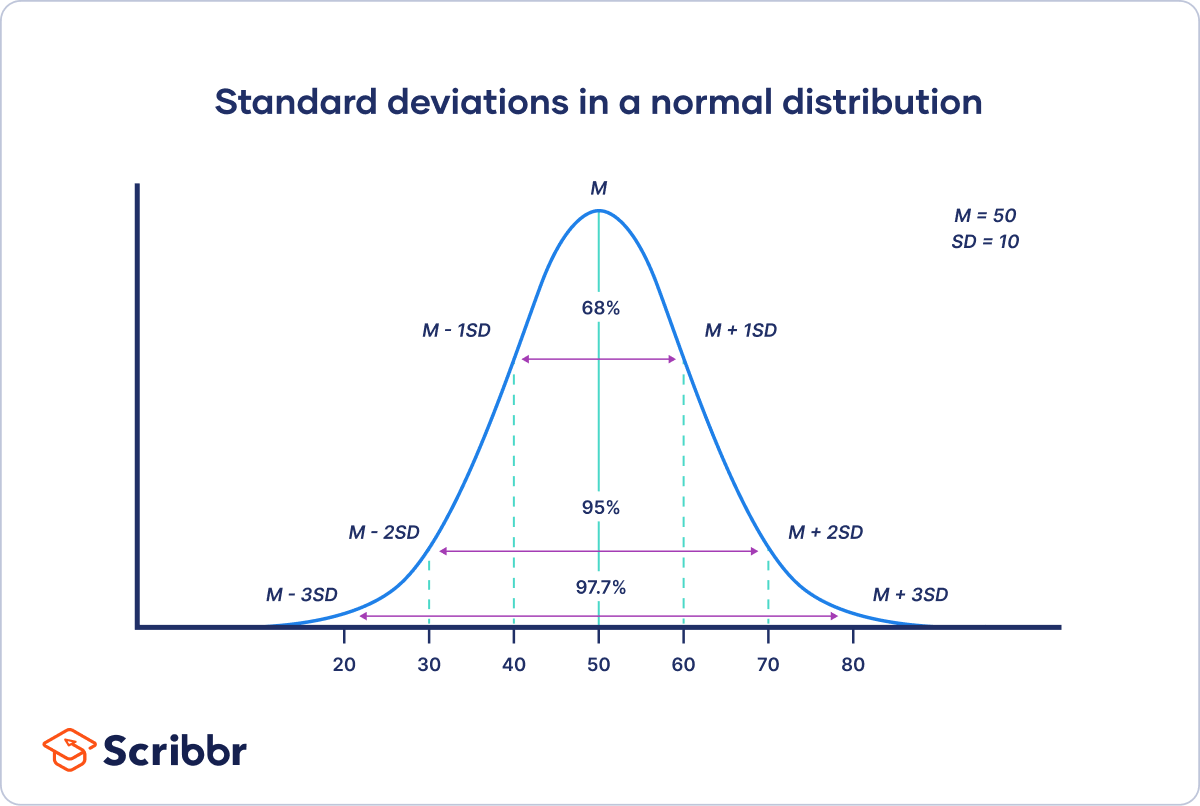
SD normal curve
each vertical line is 1 standard deviation of the mean
95% of data fall within +- 2 SDs of mean, therefore data points outside of 2 SDs are statistically significant
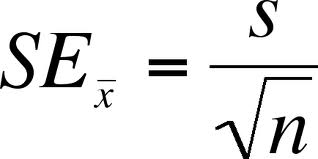
standard error of mean (SEM)
statistical test measuring probability you’ve captured true mean of entire pop; smaller SEM (more data) → more likely sample mean = true mean
calculating SEM
SEM = SD/sqrt sample size
calculating 95% confidence intervals
+- 2 SEM gives us 95% confidence interval which we can put as error bars on bar graph (no overlap = significant)
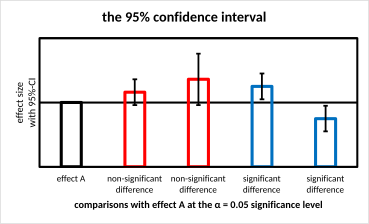
error bars
represent range of values btw which true mean could fall