HRWC Chem Flow Program
 Call Kai
 Learn
Learn Practice Test
 Spaced Repetition
 Match
Match Flashcards
 Knowt Play
1/48

There's no tags or description
Looks like no tags are added yet.
Name | Mastery | Learn | Test | Matching | Spaced | Call with Kai | Chat |
|---|
No analytics yet
Send a link to your students to track their progress
49 Terms
What grade did the Huron River earn in 2025?
C+
What were the grades of the various categories of the report card?
Water - B (good)
Recreation - B
Economy - C (moderate)
Ecosystem - C
Human Health - C
Infrastructure - C
What were the highest scoring subcategories of the report card?
household income, bird diversity, beach access, Nitrogen, dissolved oxygen, turbidity, sewer overflows
What were the lowest scoring subcategories of the report card?
very poor - cost of flooding, income equality, bacteria
poor - farmland, flooding, fish consumption, river economy
What are the most significant threats to the Huron River (as indicated by the report card)?
stormwater runoff, habitat loss, sediment and nutrient pollution, bacteria, chemical contaminants
OF COURSE CLIMATE CHANGE
What contaminants do we assess for water quality testing in the Chem Flow program?
Total Phosphorus
Total Suspended Solids
Pathogens/Bacteria (E. coli)
Dissolved Oxygen
Conductivity
pH
Temperature
What are the TMDL targets or acceptable ranges for each parameter?
Total Phosphorus - 0.03 mg/L
Total Suspended Solids - 80 mg/L (optimum is less than 25 mg/L, good is 25 to 80mg/L)
E. coli - 130 per 100mL for total body, 300 per 100mL for total body, 1000 per 100mL for partial body
Dissolved Oxygen - >5 mg/L (less than 2mg/L is hypoxic)
Conductivity - 100 to 800 µS/cm
pH - 7.5 to 8.5
Temperature - max temps range throughout the season (highest would be 85 in June, July, August)
Nitrate - 0.5 mg/L
Nitrite - 0.01 to 0.03 mg/L
What are the trends of Total Phosphorus in Washtenaw county?
the total phosphorus concentration increases as you travel upstream to downstream
but it has been steadily decreasing over time

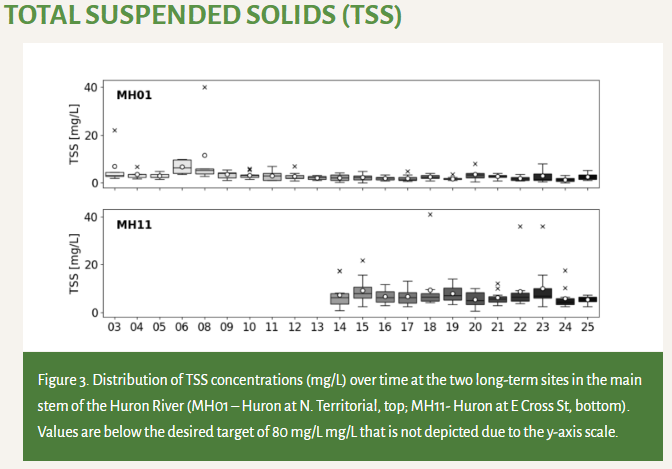
What are the trends of TSS in Washtenaw county?
it has never increased above 80 mg/L over the course of monitoring history
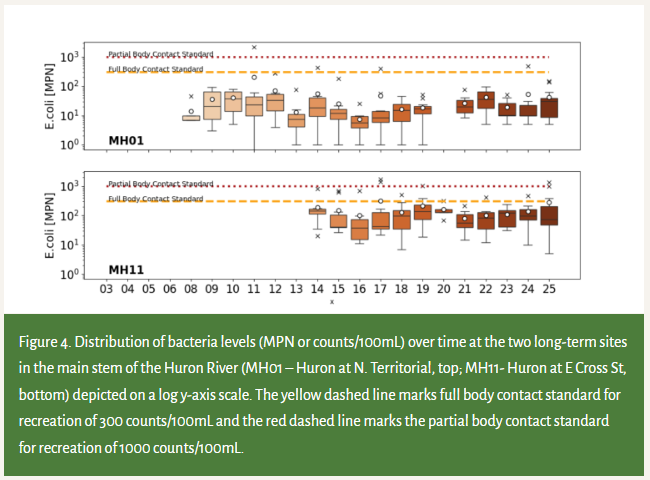
What are the trends of E. coli in Washtenaw county?
as you travel from upstream to downstream, the E. coli concentration increases
there has been sampling averages above the full body contact and partial body contact in both upstream and downstream sites
What are the trends of Nitrogen in Washtenaw county?
in tributaries throughout agricultural lands, there is an increase in the concentration of nitrate that contribute to higher downstream concentrations
throughout the main stem of the Middle Huron River, nitrate values are lower than 1 mg/L
nitrite values in the main stem of the Huron are lower than laboratory detection levels
What are the conductivity trends in Washtenaw county?
upstream, the mean conductivity measure is 730 µS/cm
downstream, the mean conductivity measure is 825 µS/cm
sulfate inputs are much lower than the state regulated inputs
chloride inputs are high, but the data and history of monitoring is too short to identify further trends
What are the trends of DO in Washtenaw county?
DO measurements typically meet state standards
What are the trends of pH in Washtenaw county?
most values of tributaries fall between 7.5 and 8.3
more basic values (8.1 to 8.2) are medians of the main stem of the Huron at both upstream and downstream
What are the temperature trends in Washtenaw county?
water temperatures have a normal range that supports freshwater aquatic life
April (5 to 10 degrees Celsius) to summer (between 20 to 30 degrees Celsius)
What are the tributaries we assess in Washtenaw county?
Mill, Boyden, Honey, Allen, Traver, Millers, Malletts, Fleming, and Swift Run creeks
What is the LU/LC of the tributaries in Washtenaw county?
mainly agricultural - Mill, Boyden, Fleming
agricultural/residential - Honey, Traver
urban/residential - Allen, Millers, Malletts, Swift Run
What are the most impaired tributaries for Phosphorus in Washtenaw county?
Mill, Mallets, Swift Run, Fleming
What are the most impaired tributaries for bacteria in Washtenaw county?
Mill, Millers, Swift Run, Malletts, Traver

What are the most impaired sites for conductivity/chloride in Washtenaw county?
Millers, Malletts, Swift Run
Allen, Honey, Traver, and Fleming all have elevated chloride as well
What is the most impaired stream for DO in Washtenaw county?
Swift Run (flashy flows with hot and dry periods lead to major decline in DO)
What is the most impaired tributaries for pH in Washtenaw county?
Swift Run (9.05 in 2017), Malletts (9.06 in 2021)
What tributaries do we assess in Wayne county?
Detroit River tribs: Frank & Poet, Brownstown, Blakely, Ecorse Creek and Reeck Drain
Huron River tribs: Woods, Silver, Smith
What are the trends of Total Phosphorus in Wayne county?
all TP concentrations are higher than target levels
however, there has been declining phosphorus levels throughout monitoring history

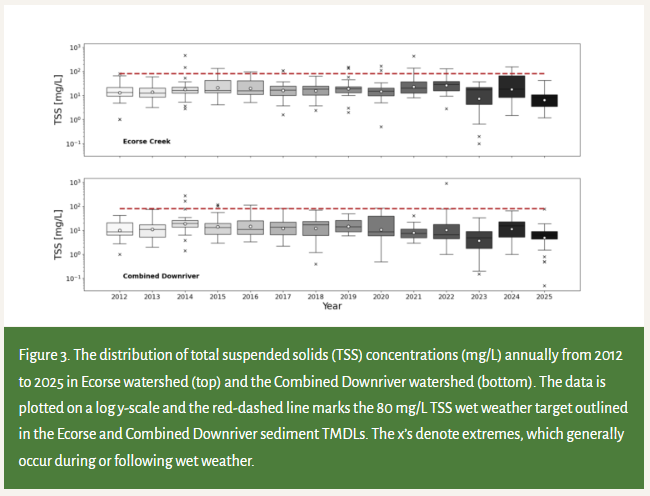
What are the trends of TSS in Wayne county?
all sites have lower mean and median values than the threshold set
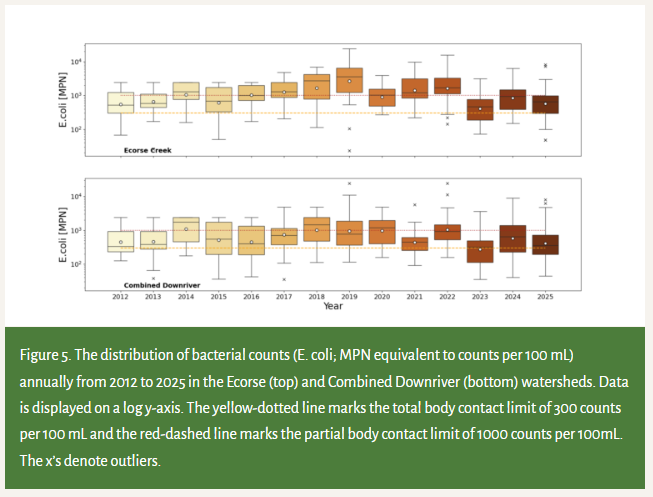
What are the trends of bacteria in Wayne county?
the means and medians of the tributaries regularly meet one standard, but are often at or above total body contact limits
they regularly exceed state standards for recreation
What are the trends of conductivity in Wayne county?
the upstream site on the main stem has a median of 850 µS/cm (25 µS/cm higher than standard)
the Ecorse Creek and Combined Downriver watersheds has even higher medians with 900-1000 µS/cm
What are the trends of DO in Wayne county?
upstream site in the main stem has adequate DO levels
the downriver watersheds fluctuate DO by tributary with many creeks being impaired (Brownstown (regularly hypoxic), Frank & Poet, Blakely)
What are the trends of pH in Wayne county?
throughout all areas of the county, the pH ranges from 7.6 to 8.2
What are the trends of temperature in Wayne county?
throughout all areas and tributaries, the temperature conditions are supportive of aquatic life
What are the results of benthic macroinvertebrate (BMI) surveys?
additional work is needed to restore the benthic macroinvertebrate community in the Downriver area
What are the tributaries we assess in Wayne county?
Woods, Silver, Smith, N. Ecorse, S. Ecorse, Frank & Poet, Blakely, and Brownstown creeks
What is the LU/LC of the tributaries in Wayne county?
agricultural/natural - Woods
agricultural/residential - Silver, Smith
urban/residential - N. Ecorse, S. Ecorse, Frank & Poet, Blakely, Brownstown (ALL FLOW INTO DETROIT RIVER)
What are the most impaired tributaries for Total Phosphorus in Wayne county?
N. Ecorse, S. Ecorse, Silver

What are the most impaired tributaries for bacteria in Wayne county?
S. Ecorse, Brownstown, N. Ecorse, Silver, Blakely, Smith

What are the most impaired tributaries for conductivity in Wayne county?
ALL besides Woods creek!
the urban sites in the downriver area (branches of Ecorse creek) have the highest readings
What are the most impaired streams for DO in Wayne county?
All but Woods creek fall below the 5 mg/L that is recommended at some point in the season
Brownstown is by far the worst, followed by N. Ecorse
What are the trends of Total Phosphorus in Livingston county?
majority of sites met target values with two tributaries exceeding the value
What are the trends of bacteria in Livingston county?
tributaries generally meet state standards, but on occasion, the bacteria levels will increase over the partial body contact standard (after rain or big flow events)
What are the trends of TSS in Livingston county?
well below the targets created by the state
What are the trends of DO in Livingston county?
quality levels that fluctuate with the cycles and seasons
What are the trends of conductivity in Livingston county?
majority of the sites frequently exceed the target of 800 µS/cm
What are the trends of temperature in Livingston county?
follow seasonal patterns and cycles
What are the trends of pH in Livingston county?
follows acceptable ranges
What are the tributaries/sites we assess in Livingston county?
Horseshoe, Davis, Woodruff, and South Ore
Huron River (at Kensington Rd) and Huron River (at Hamburg Rd)
What is the LU/LC for the tributaries in Livingston county?
agricultural/natural - Horseshoe
agricultural/residential - Davis, Woodruff
residential - South Ore
What are the most impaired sites for Total Phosphorus in Livingston county?
in the main stem, Phosphorus levels are lower than the target levels
for tributaries, Horseshoe, South Ore, and Woodruff
What are the most impaired sites for bacteria in Livingston county?
Woodruff
What are the most impaired sites for conductivity in Livingston county?
ALL except South Ore