14 Lesson 2: Point and Interval Estimates of the Population Mean, Student's t-distribution, Sample Size and Biases
0.0(0)
Card Sorting
1/35
Earn XP
Description and Tags
Last updated 4:36 PM on 9/5/23
Name | Mastery | Learn | Test | Matching | Spaced | Call with Kai |
|---|
No analytics yet
Send a link to your students to track their progress
36 Terms
1
New cards
Why are point estimates and confidence intervals fundamental concepts in statistics?
Because they help make inferences about the population parameters based on sample data.
2
New cards
Define point estimate
Is a statistic calculated from sample data that serves as an approximation of an unknown parameter.
3
New cards
Give an example of a point estimate
the sample mean ¯x is a point estimate of the population mean μ. The formula used to calculate a point estimate is known as an estimator.
4
New cards
Define confidence interval
A confidence interval is a range of values constructed using sample data that is likely to contain the true (unknown) population parameter with a certain level of confidence.
5
New cards
How can we express a confidence interval?
A confidence interval is expressed as Point estimate ± Margin of Error.
6
New cards
How is the margin of error determined?
The margin of error is determined by the reliability factor (related to the desired confidence level) and the standard error of the point estimate → (reliability factor × standard error)
7
New cards
What are the factors that affect the reliability factor?
The reliability factor depends on the assumed distribution of the point estimate and the chosen confidence level (often denoted as (1 - α), where α is the level of significance).
8
New cards
State the desirable properties of an estimator
The estimator needs to be:
* Unbiased
* Efficient
* Consistent
* Unbiased
* Efficient
* Consistent
9
New cards
Define an unbiased estimator
An estimator is unbiased if, on average, it produces estimates that are equal to the true population parameter.
For example, the sample mean ¯x is an unbiased estimator of the population mean μ, as E(¯x) = μ.
For example, the sample mean ¯x is an unbiased estimator of the population mean μ, as E(¯x) = μ.
10
New cards
Define an efficient estimator
An efficient unbiased estimator is the one that has the *lowest* variance among all unbiased estimators of the same parameter.
11
New cards
Define a consistent estimator
A consistent estimator is one for which the probability of producing estimates close to the true parameter value increases as the sample size increases. As sample size grows, the estimator approaches the true parameter.
12
New cards
Where does consistency apply the most?
Consistency is particularly important in large datasets (Big Data).
13
New cards
State the properties of the t-Distribution
* It is symmetrical.
* It is characterized by a single parameter, degrees of freedom (df), where df = sample size - 1 (n - 1).
* It has a lower peak and fatter tails compared to the normal distribution.
* As degrees of freedom increase, the t-distribution approaches the shape of the standard normal distribution (z-distribution)
14
New cards
How are the degrees of freedom related to the sample size?
Higher degrees of freedom lead to a t-distribution that closely resembles the normal distribution.
15
New cards
When can we use the t-Distribution?
* To construct confidence intervals for a *normally* distributed population whose variance is *unknown* when the sample size is small (n ﹤ 30).
* *Non-normally* distributed population whose variance is *unknown* if the sample size is *large* (n ≥ 30).
* *Non-normally* distributed population whose variance is *unknown* if the sample size is *large* (n ≥ 30).
16
New cards
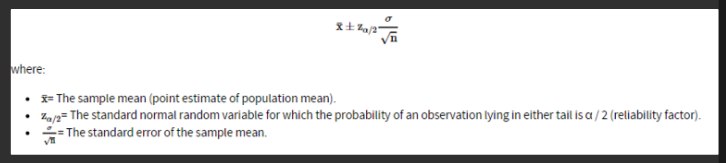
How do we calculate a confidence interval for the population mean when the population follows a *normal* distribution and its variance is *known?*
We use the z-Distribution
The following reliability factors are used frequently when constructing confidence intervals based on the standard normal distribution:
* For a 90% confidence interval we use z0.05 = 1.65
* For a 95% confidence interval we use z0.025 = 1.96
* For a 99% confidence interval we use z0.005 = 2.58
The following reliability factors are used frequently when constructing confidence intervals based on the standard normal distribution:
* For a 90% confidence interval we use z0.05 = 1.65
* For a 95% confidence interval we use z0.025 = 1.96
* For a 99% confidence interval we use z0.005 = 2.58
17
New cards
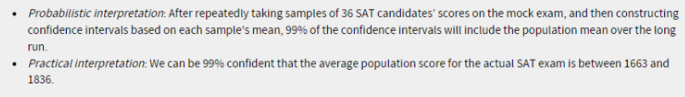
How can we interpret the results when we use z-Distribution?
18
New cards
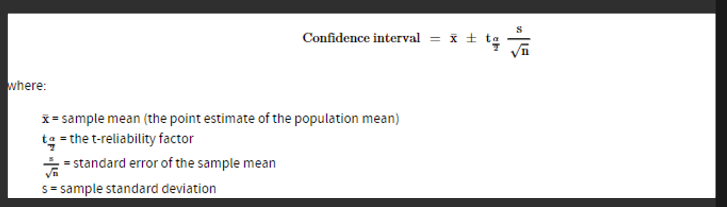
How do we calculate a confidence interval for the population mean when the population follows a *normal* distribution and its variance is *not* *known?*
We use the t-Distribution.
Remember that we need to use the table for the T-Distribution and to calculate the reliability factor we need: degrees of freedom and level of significance/2 (for both tails)
Remember that we need to use the table for the T-Distribution and to calculate the reliability factor we need: degrees of freedom and level of significance/2 (for both tails)
19
New cards
What can we use when the population distribution is non normal?
* If the population variance is *known* and the sample size is large (n ≥ 30) we use the z-statistic. This is because the central limit theorem tells us that the distribution of the sample mean is approximately normal when sample size is large.
* If the population variance is *not known* and sample size is large, we can use the z-statistic or the t-statistic. However, in this scenario the use of the t-statistic is encouraged because it results in a more conservative measure.
* If the population variance is *not known* and sample size is large, we can use the z-statistic or the t-statistic. However, in this scenario the use of the t-statistic is encouraged because it results in a more conservative measure.
20
New cards
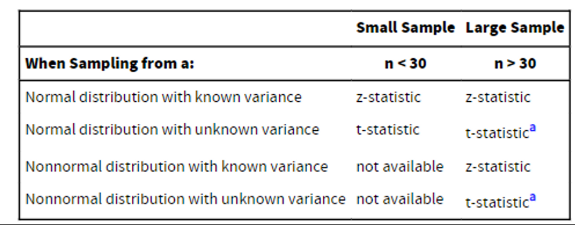
Summarize when to apply the z and t-Distributions
a: z-statistic also accepted
21
New cards
What is the process of bootstrapping?
Bootstrap is a technique that simulates the process of repeatedly drawing samples from the original observed data sample, with replacement, to estimate the sampling distribution of a statistic.
22
New cards
What does the resampling with replacement implies on bootstrapping?
Some items may appear multiple times, and others may not appear at all in the resamples.
23
New cards
Does bootstrap rely on analytical formulas?
No. That is why is known for its accuracy.
24
New cards
Where can we apply bootstrapping?
Bootstrap finds extensive applications in historical simulations, asset allocation, and assessing investment strategy performance against benchmarks.
25
New cards
What is the jackknife resampling method?
Unlike bootstrap, jackknife does not involve sampling with replacement; instead, it leaves out chosen observations (one at a time) from subsequent resamples.
26
New cards
Why does jackknife uses resampling without replacement
To reduce the bias of an estimator, particularly when dealing with small sample sizes.
27
New cards
When is jackknife useful?
Jackknife typically produces similar results for every run, making it a useful method when consistency in outcomes is preferred.
28
New cards
What facto affect confidence intervals?
* The choice of test statistic: A t-statistic gives a wider confidence interval.
* The degree of confidence: A higher desired level of confidence increases the size of the confidence interval.
* The degree of confidence: A higher desired level of confidence increases the size of the confidence interval.
29
New cards
What is the relationship between standard errors, sample size and confidence intervals?
The *larger* the standard error, the *wider* the confidence interval. The standard error, in turn, is a function of sample size. More specifically, a *larger* sample size results in a *smaller* standard error and *reduces* the width of the confidence interval. Therefore, large sample sizes are desirable as they increase the precision with which we can estimate a population parameter.
30
New cards
What are some disadvantages of increasing sample size?
* Increasing the size of the sample may result in drawing observations from a different population.
* Increasing the sample size may involve additional expenses that outweigh the benefit of increased accuracy of estimates.
* Increasing the sample size may involve additional expenses that outweigh the benefit of increased accuracy of estimates.
31
New cards
What is the data snooping bias?
Occurs when researchers extensively search through a dataset for statistically significant relationships without a predetermined hypothesis, leading to the discovery of apparent correlations that are, in fact, coincidental.
32
New cards
How can we avoid data snooping bias?
Statistically significant relationships should be tested on "out-of-sample" data to see if they hold.
33
New cards
What is the sample-selection bias?
Sample-selection bias occurs when certain assets are excluded from a study due to unavailability of data, leading to a biased sample.
34
New cards
What is the look-ahead bias?
Look-ahead bias arises when a study uses information that was not available on the test date, potentially leading to inaccurate conclusions.
35
New cards
How can we mitigate look-ahead bias?
To mitigate this bias, researchers can use point-in-time (PIT) data whenever possible, which reflects the information available at a specific point in time.
36
New cards
What is the time-period bias?
Time-period bias occurs when a study is based on a specific time period, potentially making the results time-period specific and not applicable to other periods.