Bio lab midterm (background Information)
1/101
There's no tags or description
Looks like no tags are added yet.
Name | Mastery | Learn | Test | Matching | Spaced | Call with Kai |
|---|
No analytics yet
Send a link to your students to track their progress
102 Terms
sig figs (ph)
individual measurements are reported with 3 sig figs
sig figs (even number before 5)
stays the same
sig figs (odd number before 5)
round up
mega
one million
mega
10^6
kilo
one thousand
kilo
10³
milli
one thousandth
milli
10^-3
micro
one millionth
micro
10^-6
nano
one billionth
nano
10^-9
pico
one-trillionth
pico
10^-12
P-20 pipette
2-20uL
P-200 pipette
20-200 uL
P-1000
100-1000 uL
sterile technique
aseptic technique
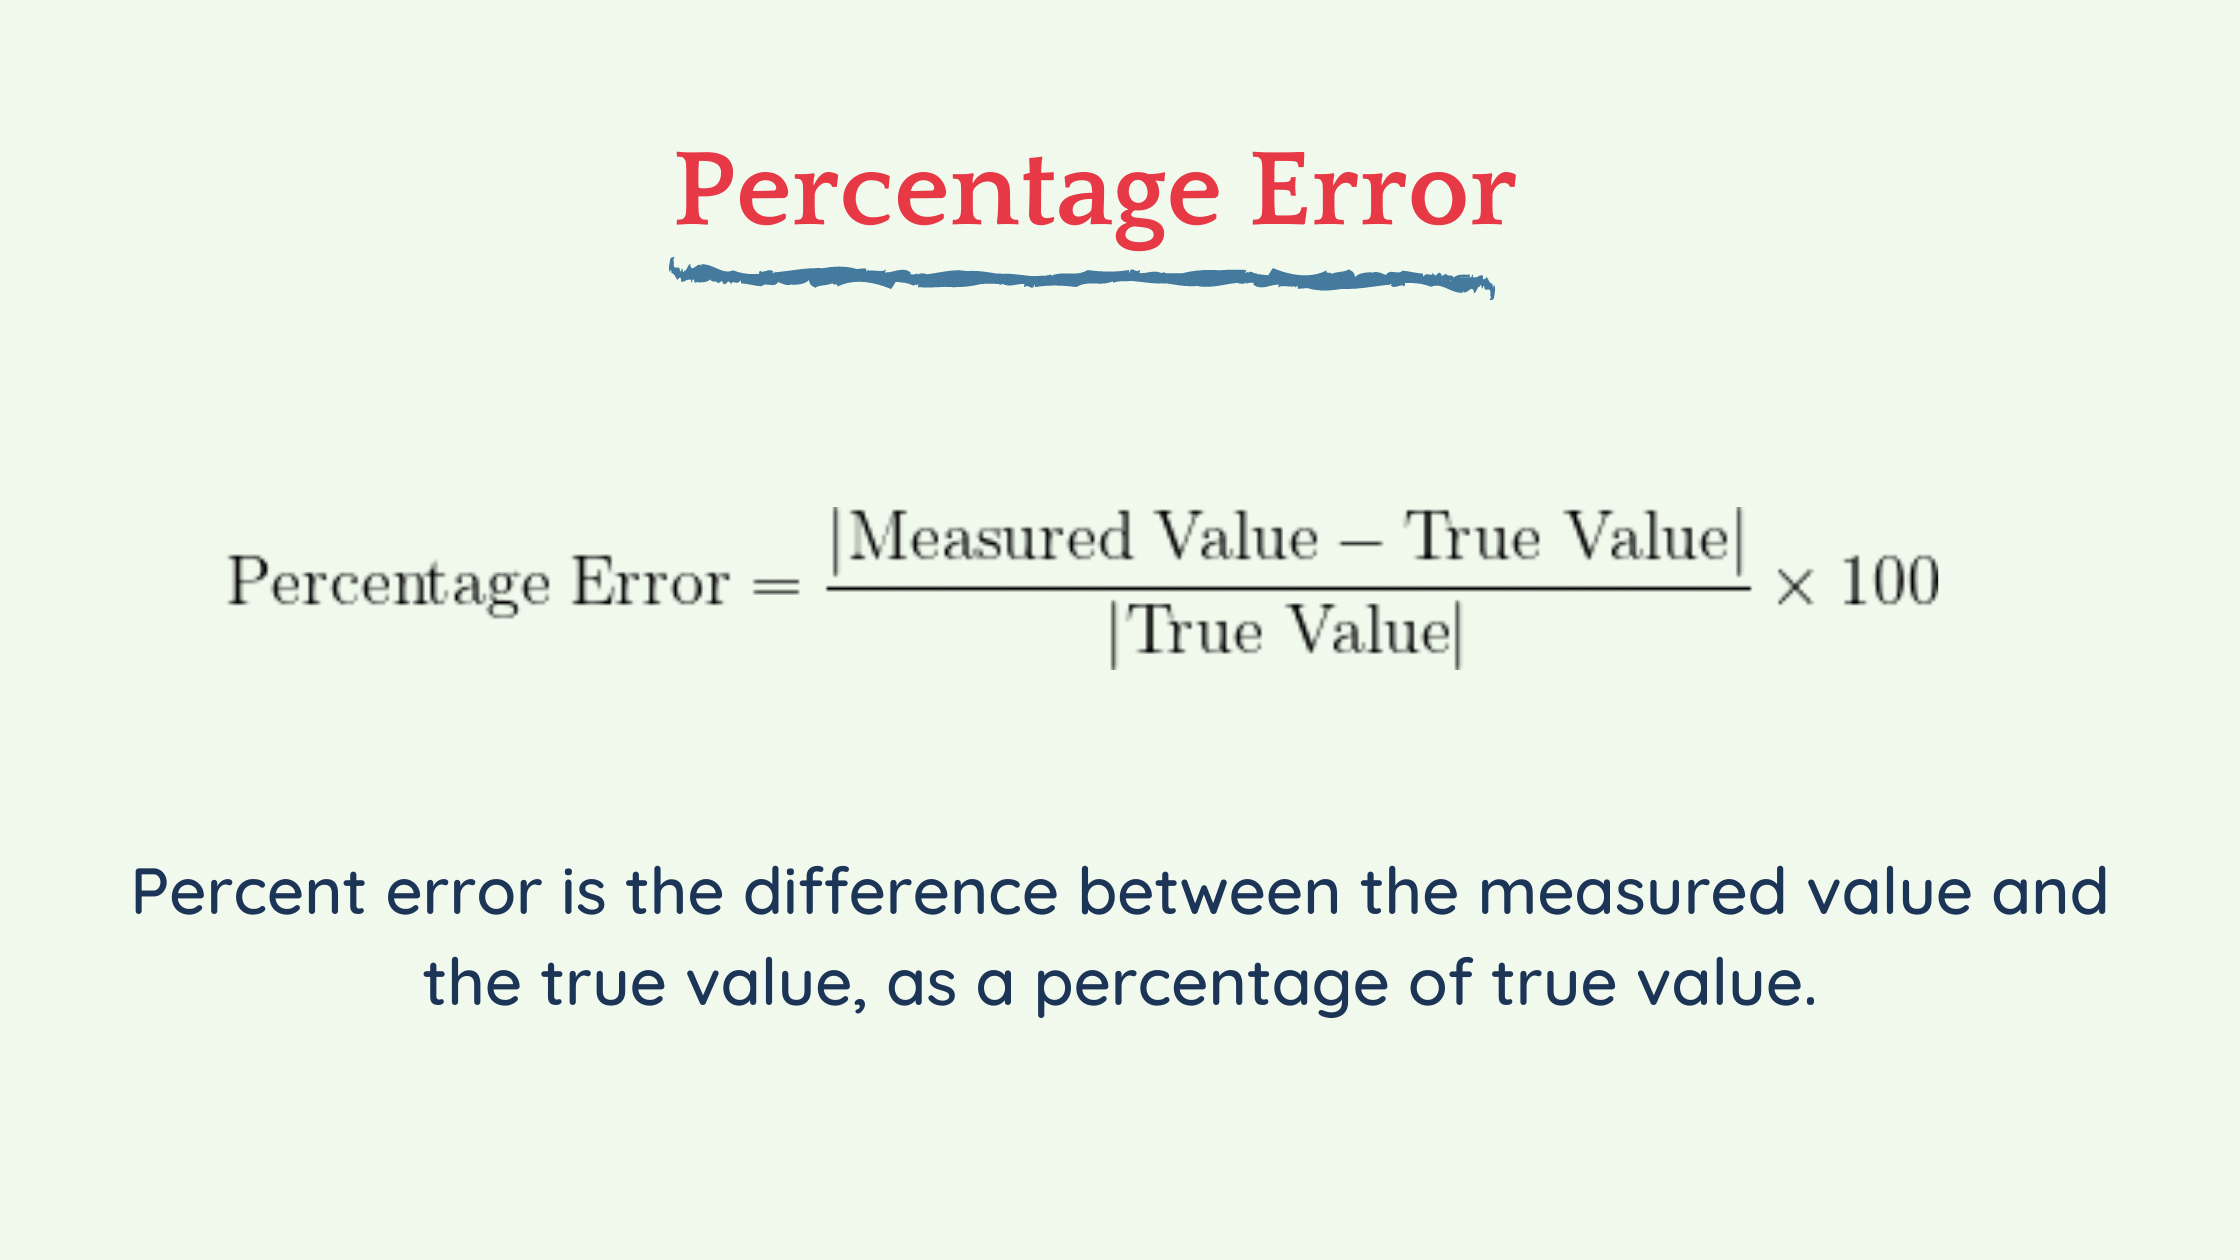
percent error
buffer
an aqueos solution containing a specific mixture of salts, buffering agents, and reducing agents, detergents, or cofactors. optimize reaction
basic function of buffer
resist changes in hydrogen ion concentration
stock solutions are diluted with
water
using stock solutions is beneficial because
save time, reduce storage space, and improve accuracy
X factor (ex. 5X, 10X)
5X concentrated solution will be diluted 5-fold
equation to make a specific volume of a dilute solution from a stock solution
C1V1=C2V2
C1
concentration of stock solution
C2
final concentration of dilute solution
V1
volume of stock solution needed to make a dilute solution
V2
final volume of dilute solution
Dilution factor (DF)
the concentration of the dilute solution is reduced compared to the concentration of the stock solution
DF equation
C1/C2=V2/V1
standard curve
is a graph that shows the relationship between the concentration of a substance and its corresponding absorbance
discovery science
uses large amounts of data or surveys of natural systems to discover patterns or correlations
hypothesis driven science
scientific method
scientific method (step 1)
the problem or observation
scientific method (step 2)
collection of background information
scientific method (step 3)
state the hypothesis
scientific method (step 4)
state predictions
scientific method (step 5)
Test predictions
scientific method *step 6)
draw conclusions
scientific method final step
report conclusions
for a hypothesis to be supported
none of the predictions can be incorrect
if the predictions are correct
then hypothesis is supported and likely to be correct, it has not been proven correct
controlled experiment
three variables independent, dependent, and controlled)
independent variable
parameter that is changed by the researcher
The dependent variable
is a parameter that responded to the changes in the independent variable and is the variable measured by the researcher
controlled variables
other factors that can affect the depended variable and thus should be kept constant or controlled by the researcher
experimental group
the independent variable is added and or changed
control group
independent variable is either not included or kept constant in its natural state
example: fertilizer with increase in growth rate of tomato plants (independent)
fertilizer concentration
example: fertilizer with increase in growth rate of tomato plants (dependent)
growth rate
example: fertilizer with increase in growth rate of tomato plants (control)
amount of water, soil, water, temperature
example: fertilizer with increase in growth rate of tomato plants (control group)
no fertilizer
example: fertilizer with increase in growth rate of tomato plants (experimental group)
fertilizer of different concentrations
p-value greater than 0.05
not significant
p-value less than 0.05
significant
9 parameters to test Water Quality
temperature, pH, DO, BOD, TS, Turbidity, Nitrates, Fecal Coliform, and Total Phosphate
Fecal coliform test
is about whether or not sewerage may be entering the system.
The presence of fecal coliform means
there is bacteria in the water
lotic sources
moving water like a stream
lentic sources
pond or lake still water
non-point source pollution
generates from runoff, acid rain, and atmospheric disposition. caused by rainfall or snowmelt
increased water temperature
increase the photosynthetic rate of aquatic plants ad algae leading to plant growth and algal blooms (harm ecosystem)
changes in Ph can happen due to
algal blooms, industrial processes resulting in a release of bases or acids, or the oxidation go sediments
streams and lakes have a pH of
7 to 8 sometimes 8.5
capstone project is an example of
hypothesis driven sciee
nitrates are important for plant and animals
to synthesize amino acids and proteins
nitrogen is found
in the atmosphere in the form go Nitrogen gas through a process called nitrogen cycle
major source of nitrate pollution is
livestock in feedlots, fertilizer runoff
Eutrophication
a process by which nutrients particularly phosphorus and nitrogen become highly concentrated in a body of water leaded to increased growth of organisms such as algae or cyanobacteria
most common fecal coliform
Escherichia coli
feacal coliform is a type of bacteria that
lives in the intestinal tracts of animals and humans. their presence indicated that other pathogens of fecal orginins like viruses and parasites may be present
High E. coli levels happen from
leaking septic or sewer systems, polluted runoff that has picked up animal waste en route to the stream, waterfowl in the stream, or wading cows
coliform bacteria
facultative aerobes that can tolerate oxygen but can survive without it that ferment lactose to produce gas
phosphorus
limiting factor in plant and algal growth
excess phosphorus can lead to
eutrophication
eutrophication can
lower levels of DO in water
High level of phosphate
increased BOD and decreased DO
DNA barcoding
the use of specific DNA sequences DNA markers and genes to identify organisms to species level
DNA barcoding is a technique
that determines the taxonomic identity of biological specimens using DNA sequences
DNa barcodin
helps to identify to a species level
General DNA barcoding process
collect sample,extraction from samples, barcodes are amplified by PCR using taxa specific primers, visualized via agarose gel electrophoresis, and DNA sequenced, then BLASTn, identify specimen
DNA barcoding process for bacteria
collect water/ bacteria sample, barcodes are direct amplified by PCR (16S rRNA), visualized via agarose gel electrophoresis, and DNA sequenced, then BLASTn, identify specimen
PCR is used
to amplify specific fragment of DNA from a complex mixture of DNA
PCR steps
denaturation at 95 degrees C, then primer annealing drops temp to 50 degrees C, Synthesis temp raised to 72 C allows Taq polymerase to work
PCR uses
DNA polymerase, dNTPS, taq polymerase, primers,
master mix
helps reduce pipetting errors and time to set up reaction
positive control
known sample of DNA and it is used to show that the primers and PCR conditions successfully amplify the DNA barcode fragment
negative control
sample without DNA and it is used to show no contamination of the basic PCR.
Agragrose gel electrophoresis
separate based on size , identify, and purify DNA fragments
the phosphate groups on the DNA backbone confer a
net negative charge on the molecule
if a solution of DNA is placed into an electric field
DNa molecules will migrate towards the positevely charged electrode
setting up agragrose gel
agarose is melted in a buffer and then cooled in a casting tray to form a jello consistency, then place I plastic combs to create wells, hardenend gel then palced into a box with electrodes and covered in buffer.
loading dye consists of g
lycerol and two tracking dyes xylene cyan and bromophenol blue
glycerol is dense
so DNA samples will sink to the bottom of the wells
the two tracking dyes allow for
monitoring how far the DNA has migrated in the gel